Product demo.
  What is data observability?
  What is a data mesh--and how not to mesh it up
  The ULTIMATE Guide To Data Lineage
 Modern Data Quality Management: A Proven 6 Step Guide


Barr Moses
CEO and Co-founder, Monte Carlo. Proponent of data reliability and action movies.

Will Robins
Will Robins is a member of the founding team at Monte Carlo.
Data quality management is the process of setting quality benchmarks, actively improving data based on those benchmarks, and continually maintaining those data quality levels.
Historically, it was a simple affair. Data was small, slow, and confined within the walls of on-premise databases. Managing it was akin to keeping a small garden.
Now, as we’ve catapulted into the cloud era, the game has changed. The quaint garden has become a sprawling jungle, wild and untamed. Data sources proliferate like rabbits and data models and tables are as numerous as stars in the sky.
Data leaders need data quality management programs designed for the modern data stack. While the six dimensions of data quality (accuracy, completeness, integrity, validity, timeliness, uniqueness) still apply, there needs to be a much larger focus on the overall reliability of data systems, sources, and pipelines.
Most of all, there needs to be a repeatable process beyond static data cleansing, testing and profiling. These legacy approaches just can’t scale across dozens of data sources, hundreds of data models, and thousands of tables.
We’ve worked with hundreds of data teams that have successfully leveraging this six step process to achieve the data quality levels required by their business.
Data Quality Management Steps
- Step 1: Baseline Current Data Quality Levels
- Step 2: Rally And Align The Organization
- Step 3: Implement Broad Data Quality Monitoring
- Step 4: Optimize Incident Resolution
- Step 5: Create Custom Data Quality Monitors
- Step 6: Incident Prevention
Step 1: Baseline Current Data Quality Levels
One of the best places to start with your data quality management strategy is an inventory of your current (and ideally near future) data use cases. Categorize them by:
- Analytical: Data is used primarily for decision making or evaluating the effectiveness of different business tactics via a BI dashboard.
- Operational: Data used directly in support of business operations in near-real time. This is typically steaming or microbatched data. Some use cases here could be accommodating customers as part of a support/service motion or an ecommerce machine learning algorithm that recommends, “other products you might like.
- Customer facing: Data that is surfaced within and adds value to the product offering or data that IS the product. This could be a reporting suite within a digital advertising platform for example.
Why is this important? As previously mentioned, data quality is contextual. There will be some scenarios, such as financial reporting, where accuracy is paramount. Other use cases, such as some machine learning applications, freshness will be key and “directionally accurate” will suffice.
The next step is to assess the overall performance of your systems and team. At this stage you have just begun your journey so it’s unlikely you have detailed insights into your overall data health or operations. There are some quantitative and qualitative proxies you can use however.
- Quantitative: You can measure the number of data consumer complaints, overall data adoption, and levels of data trust (NPS survey). You can also ask the team to estimate the amount of time they spend on data quality management related tasks like maintaining data tests and resolving incidents.
- Qualitative: Is there a desire or an opportunity for more advanced data use cases? Do leaders feel like they’ve unlocked the full value of the organization’s data? Is the culture data driven? Was there a recent data quality disaster that led to very senior escalation?
Categorizing your data use cases and baselining current performance will also help you assess the gap between your current and desired future state across your infrastructure, team, processes, and performance. It’s an answer to broader tactical questions that impact data quality across:
- Technology:
- Do I need to migrate any on-premises databases to the cloud?
- Where do we need to have data streaming vs batch? ETL vs ELT?
- How do I prioritize and build the layers of my modern data platform across ingestion, storage, transformation/orchestration, visualization, data quality, data governance/access management?
- What level of data pipeline monitoring coverage do we need?
- People:
- Should there be a central data team, decentralized data mesh, or a hybrid with a data center of excellence?
- Do I need specialized roles and/or teams to manage data governance such as data stewards or data quality such as data reliability engineers?
- Process:
- Are we efficient at identifying the root cause of data incidents?
- Do we understand the relative importance of each asset and how they are related?
- What data SLAs should we have in place?
- How do we onboard data sets?
- What level of documentation is appropriate?
- How do we enable discovery and prioritize self-service access to data?
“Given that we are in the financial sector, we see quite disparate use-cases for both analytical and operational reporting which require high-levels of accuracy” says Checkout.com Senior Data Engineer Martynas Matimaitis. “That forced our hands to [scale data quality management] quite early on in our journey, and that became a crucial part of our day-to-day business.”
Step 2: Rally And Align The Organization
Once you have a baseline and an informed opinion, you are ready to start building support for your data quality initiative. You will want to start by understanding what pain is felt by different stakeholders.
If there is no pain, you need to take a moment to understand why. It could be the scale of your data operations or the overall importance of your data isn’t mature enough to warrant an investment in improving data quality. However, assuming you have more than 50 tables and a few members on your data team that is unlikely to be the case.
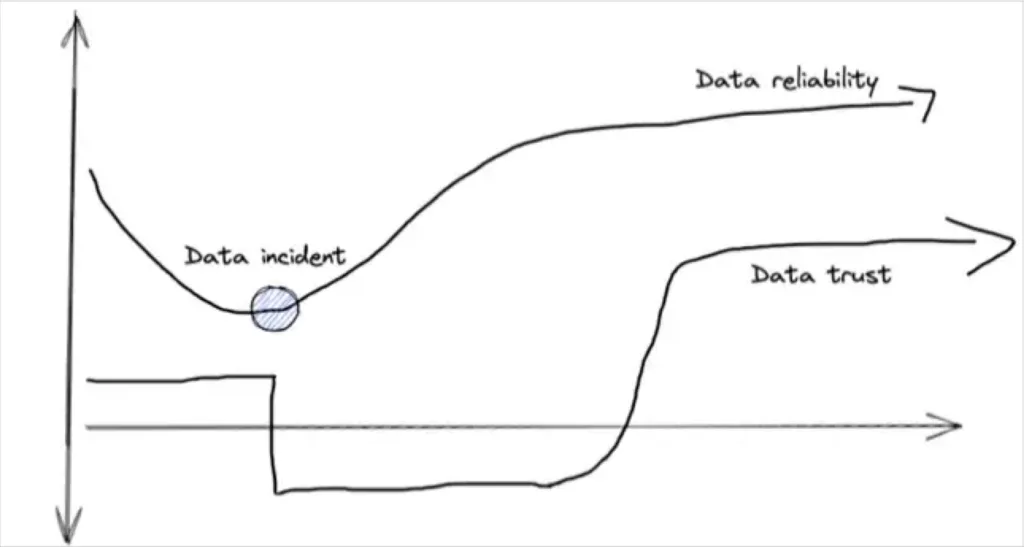
What’s more likely is your organization has quite a bit of unrealized risk. The data quality is low and a costly data incident is just around the corner…but it hasn’t struck yet. Your data consumers will generally trust the data until you give them a reason not to. At that point, trust is much harder to regain than it was to lose.
The overall risk of poor data quality can be difficult to assess. The consequences of bad data can range from slightly under optimized decision making to reporting incorrect data to Wall Street.
One approach is to pool this risk by estimating your data downtime and attributing an inefficiency cost to it. Or you could take established industry baselines– our study shows bad data can impact on average 26% of a company’s revenue.
That risk assessment and cost of business stakeholders dealing with bad data will be informative if a bit fuzzy. It should also be paired with the cost to the data team of dealing with bad data. This can be done by totaling up the amount of time spent on data quality related tasks, wincing, and then multiplying that time by the average data engineering salary.
Pro-Tip: Data testing is often one of the data team’s biggest inefficiencies. It is time consuming to define, maintain, and scale every expectation and assumption across every dataset. Worse, because data can break in near infinite number of ways (unknown unknown) this level of coverage is often woefully inadequate.
Congratulations! You now have a business case for your data quality management initiative and the changes you need to make across your people, technology, and processes.
At this point, the following stages will assume you have obtained a mandate and made a decision to either build or acquire a data quality or data observability solution to assist in your efforts. Now, it’s time to implement and scale.
Step 3: Implement Broad Data Quality Monitoring
The third data quality management stage is to make sure you have basic machine learning monitors (freshness, volume, schema) in place across your data environment. For many organizations (excluding the largest enterprises), you will want to roll this out across every data product, domain, and department rather than pilot and scale.
This will accelerate your time to value and help you establish critical touch points with different teams if you haven’t done so already.
Another reason for a wide roll out is that, even with the most decentralized organizations, data is interdependent. If you install fire depressant systems in the living room while you have a fire in the kitchen, it doesn’t do you much good.
Also, wide-scale data monitoring and/or data observability will give you a complete picture of your data environment and the overall health. Having the 30,000 foot view is helpful as you enter the next stage of data quality management.
“With…broad coverage and automated lineage…our team can identify, understand downstream impacts, prioritize, and resolve data issues at a much faster rate,” said Ashley VanName, general manager of data engineering, JetBlue.
Step 4: Optimize Incident Resolution
At this stage, we want to start optimizing our incident triage and resolution response. This involves setting up clear lines of ownership. There should be team owners for data quality as well as overall data asset owners at the data product and even data pipeline level.
Breaking your environment into domains, if you haven’t already, can help create additional accountability and transparency for the overall data health levels maintained by different groups.
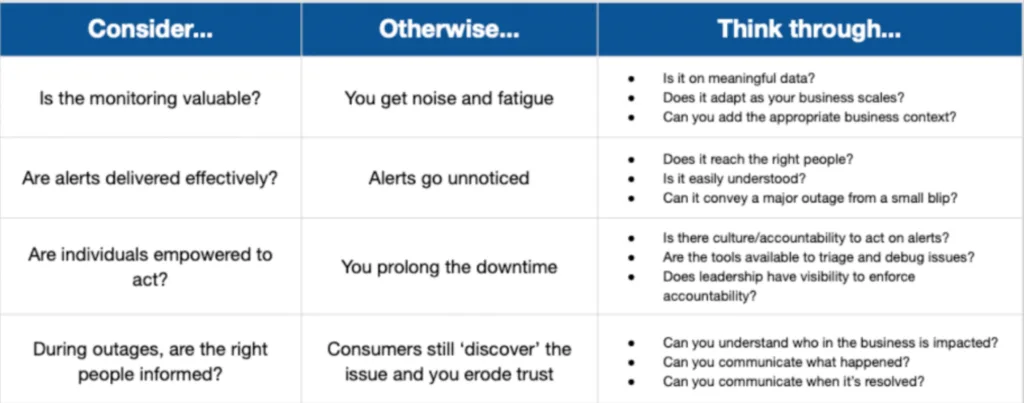
Having clear ownership also enables fine tuning your alert settings, making sure they are sent to the right communication channels of the responsible team at the right level of escalation.
“We started building these relationships where I know who’s the team driving the data set,” said Lior Solomon, VP of Data at Drata. “I can set up these Slack channels where the alerts go and make sure the stakeholders are also on that channel and the publishers are on that channel and we have a whole kumbaya to understand if a problem should be investigated.”
Step 5: Create Custom Data Quality Monitors
Next you will want to focus on layering more sophisticated, custom monitors. These can be either manually defined–for example if data needs to be fresh at 8:00 am every weekday for a meticulous executive–or machine learning based. In the latter case, you indicate which tables or segments of the data are important to examine and the ML alerts trigger when the data starts to look awry.
We recommend layering on custom monitors on your organization’s most critical data assets. These can typically be identified as those that have many downstream consumers or important dependencies.
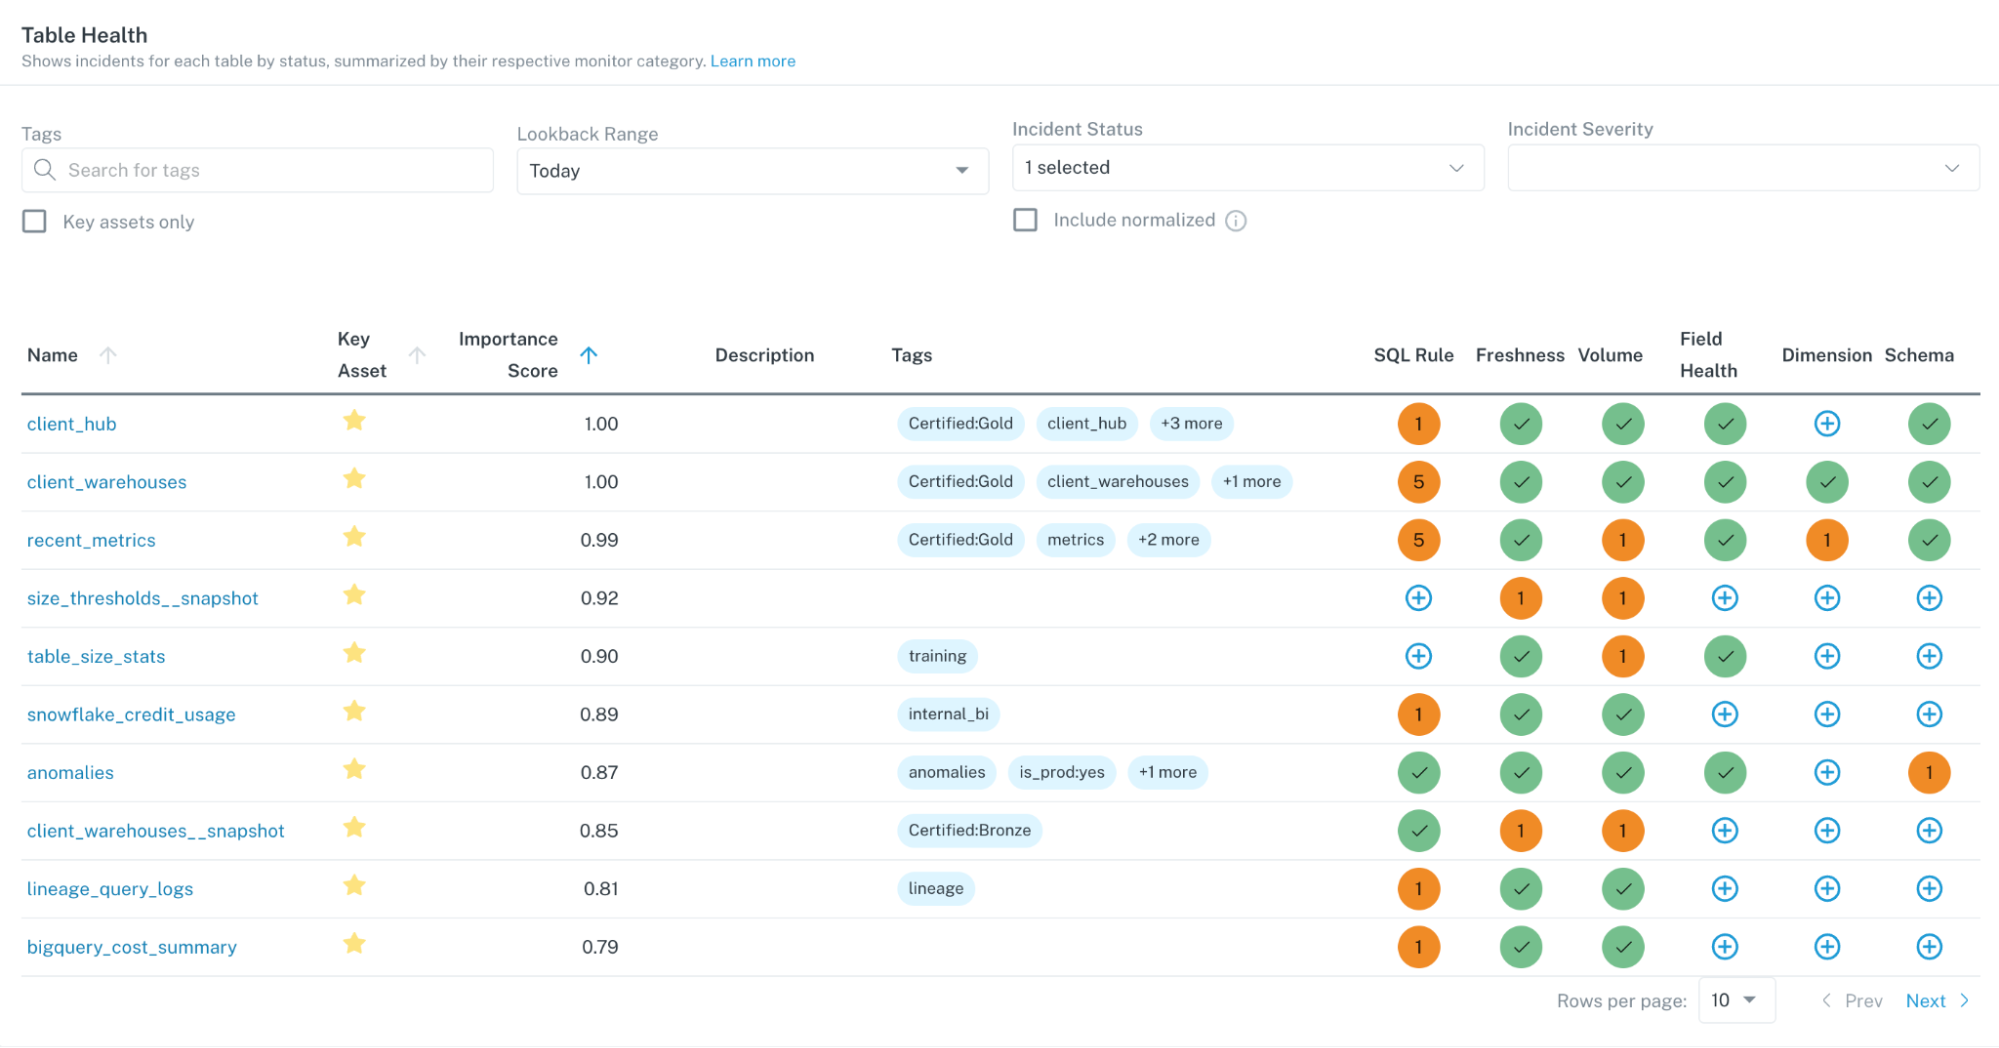
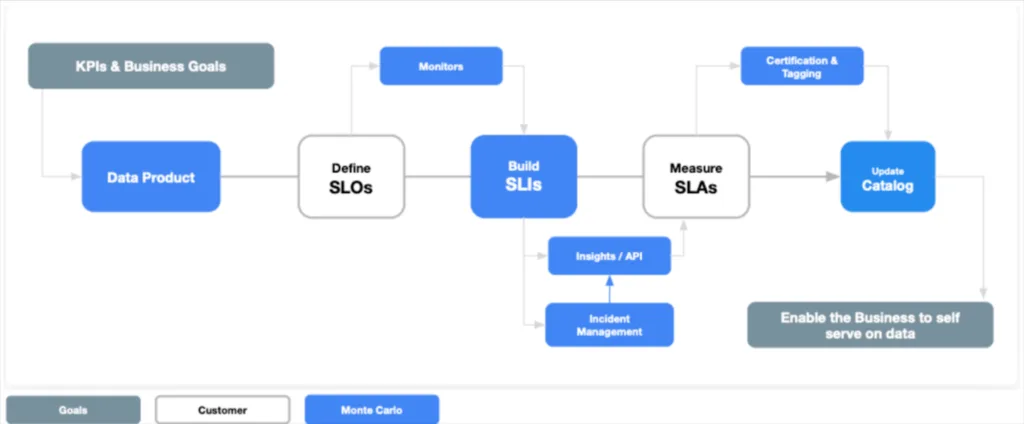
Custom monitors and SLAs can also be built around different data reliability tiers to help set expectations. You can certify the most reliable datasets “gold” or label an ad-hoc data pull for a limited use case as “bronze” to indicate it is not supported as robustly.
The most sophisticated organizations manage a large portion of their custom data quality monitors through code (monitors as code) as part of the CI/CD process.
The Checkout.com data team reduced its reliance on manual monitors and tests by adding monitors as code functionality into every deployment pipeline. This enabled them to deploy monitors within their dbt repository, which helped harmonize and scale the data platform.
“Monitoring logic is now part of the same depository and is stacked in the same place as a data pipeline, and it becomes an integral part of every single deployment,” says Martynas. In addition, that centralized monitoring logic enables the clear and easy display of all monitors and issues, which expedites time to resolution.
Step 6: Incident Prevention
At this point, we have driven significant value to the business and noticeably improved data quality management at our organization. The previous data quality management stages have helped dramatically reduce our time-to-detection and time-to-resolution, but there is a third variable in the data downtime formula: number of data incidents.
n other words we want to try preventing data incidents before they happen.
That can be done by focusing on data health insights like unused tables or deteriorating queries. Analyzing and reporting the data reliability levels or SLA adherence across domains can also help data leaders determine where to allocate their data quality management program resources.
“Monte Carlo’s lineage highlights upstream and downstream dependencies in our data ecosystem, including Salesforce, to give us a better understanding of our data health,” said Yoav Kamin, business analysis group leader at Moon Active. “Instead of being reactive and fixing the dashboard after it breaks, Monte Carlo provides the visibility that we need to be proactive.”
Final thoughts
We covered a lot of ground in this article – some might call it a data reliability marathon. Some of our key data quality management takeaways include:
- Make sure you are monitoring both the data pipeline and the data flowing through it.
- You can build a business case for data monitoring by understanding the amount of time your team spends fixing pipelines and the impact it has on the business.
- You can build or buy data monitoring–the choice is yours–but if you decide to buy a solution be sure to evaluate its end-to-end visibility, monitoring scope, and incident resolution capabilities.
- Operationalize data monitoring by starting with broad coverage and mature your alerting, ownership, preventive maintenance, and programmatic operations over time.
Perhaps the most important point is that data pipelines will break and data will “go bad” – unless you’re keeping them healthy.
Whatever your next data quality management step entails, it’s important to take it sooner rather than later. You’ll thank us later.
Considering modernizing or scaling your data quality management program? Schedule a time to talk to us about how data observability can help.
Our promise: we will show you the product.
Read more posts.