Product demo.
  What is data observability?
  What is a data mesh--and how not to mesh it up
  The ULTIMATE Guide To Data Lineage
 How to Make Data Anomaly Resolution Less Cartoonish

Mei Tao
Product at Monte Carlo

Lior Gavish
CTO and Co-founder, Monte Carlo. Programming wizard and lover of cats.
You know that cartoon trope where a leak springs in the dike and the character quickly plugs it with a finger, only to find another leak has sprung that needs to be plugged, and so on until there are no more fingers or the entire dam bursts?
Data engineers know that feeling all too well.
Anomalies spring up, a member of the data team is assigned to resolve it, but the root cause analysis process takes so long that by the time everything is fixed, another three leaks have sprung and there are no more bodies to throw at the problem.
Simply put, root cause analysis and anomaly resolution take way too long. In fact, when we surveyed 300 data professionals with Wakefield Research on the state of data quality, we found the average time-to-resolution for a data incident was 9 hours!
Respondents also reported an average of 61 data incidents a month, meaning the average data team is spinning their root cause analysis wheels a total of 549 hours a month.
Instead of running on an endless treadmill of fixing broken pipelines and investigating null values, what if data engineers could streamline this process? What if the secret to our success was right in front of our noses?
It’s a tale as old as time a few years ago, but in my opinion, the best way forward is for data teams to start treating their critical data assets like production software, including incident resolution.
We’ll talk about just how to do that including how to:
- Identify and categorize data anomalies
- Assess impact and triage
- Proactively communicate across teams
- Determine upstream dependencies
- Analyze the three infrastructure layers that introduce anomalies
- Consolidate the incident resolution process
Let’s dive in.
How to identify and categorize data anomalies
Before we get into root cause analysis best practices, it’s important to understand the way data and pipelines break. Data is very creative in this regard and one of the reasons why unit testing data is insufficient for detecting most incidents.
While there are nearly an infinite number of ways, or root causes, for why “these numbers don’t seem right,” the good news is that most can be grouped into four types of anomalies.
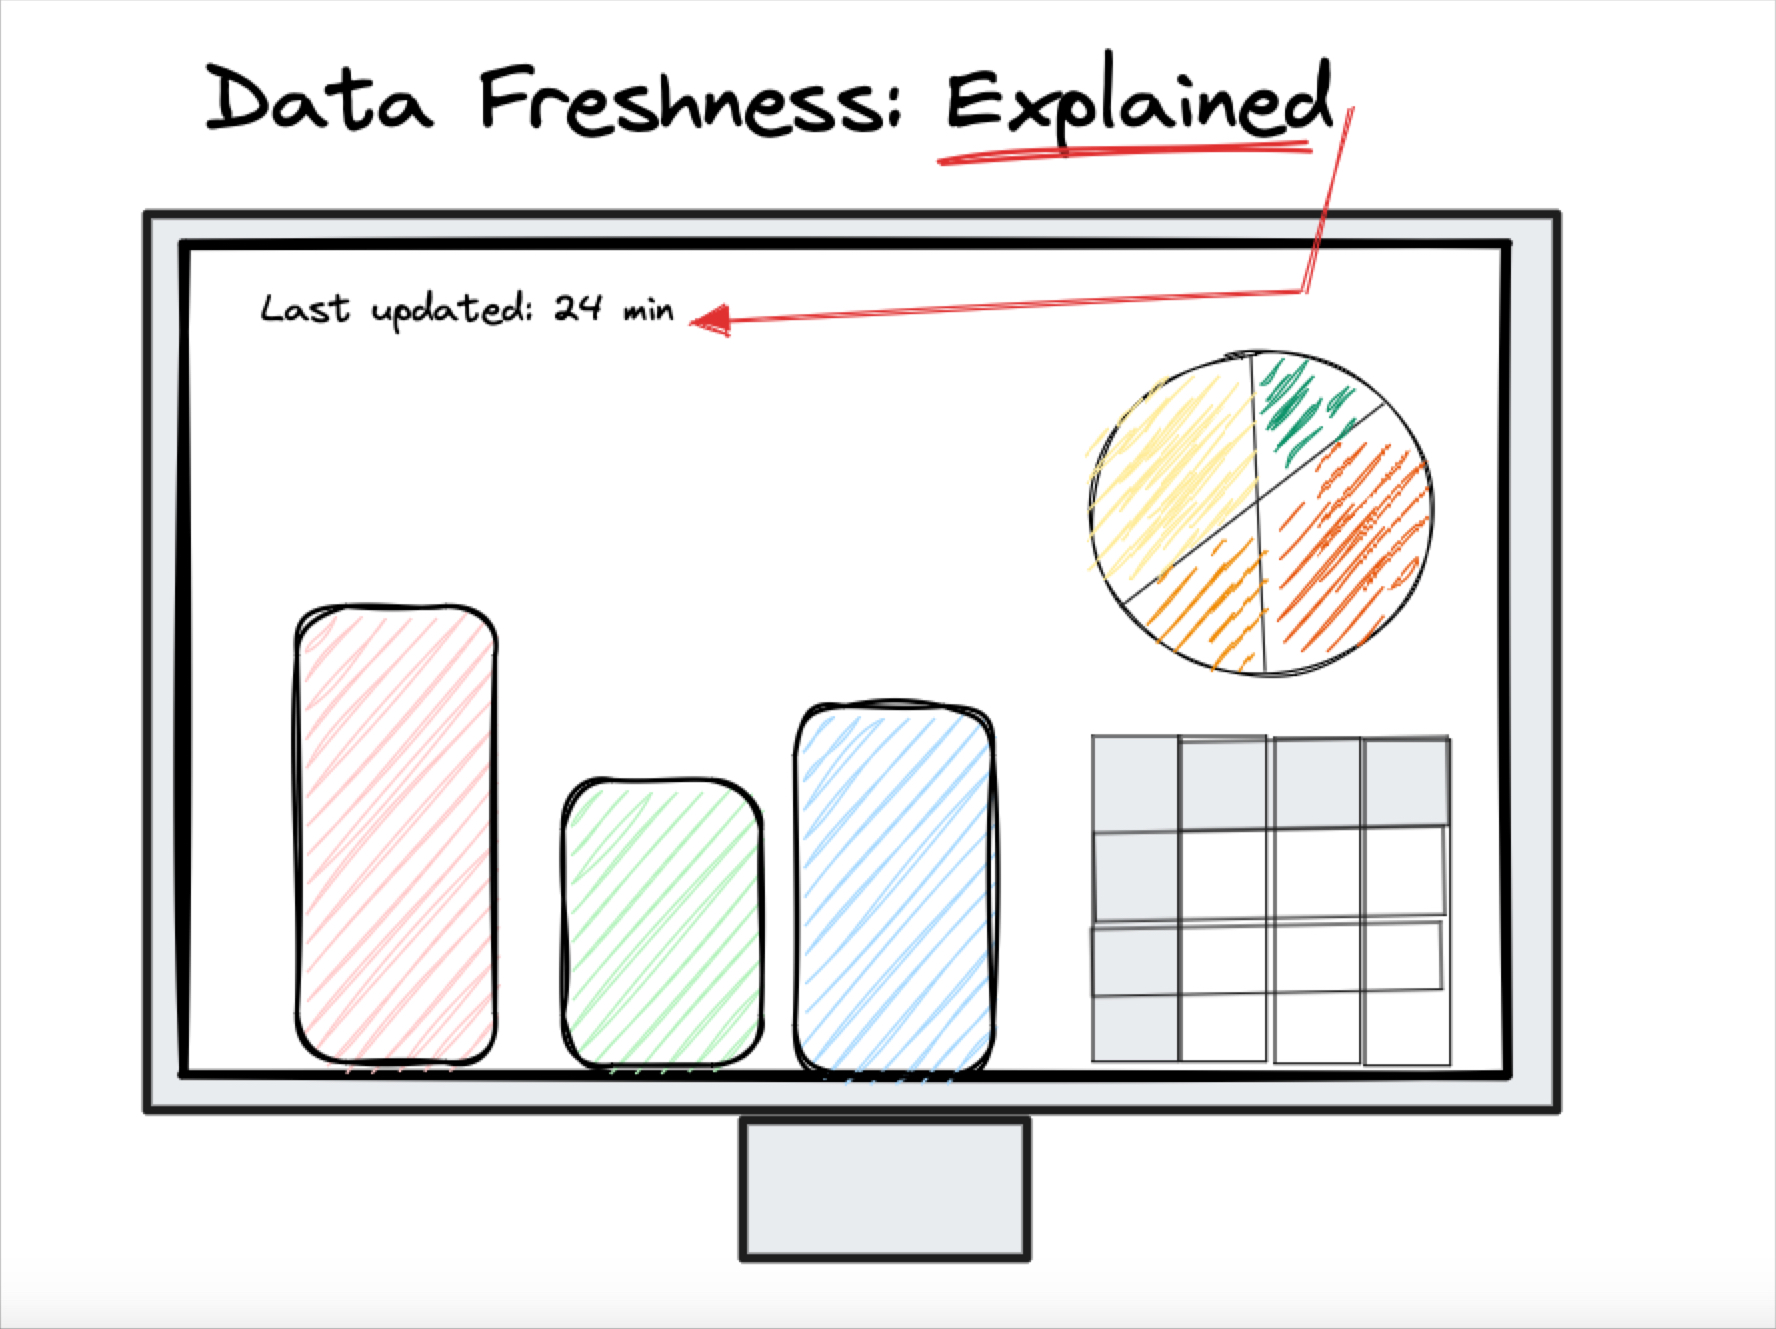
- Freshness: Data freshness anomalies (sometimes referred to as timeliness) are when the data doesn’t update when it should. This is often dictated by the needs of the business. An executive might need the customer churn data every quarter, a marketer might need new ad data every day at 8:00 am, or a machine learning driven recommendation engine on a streaming site might need the data in near real-time.
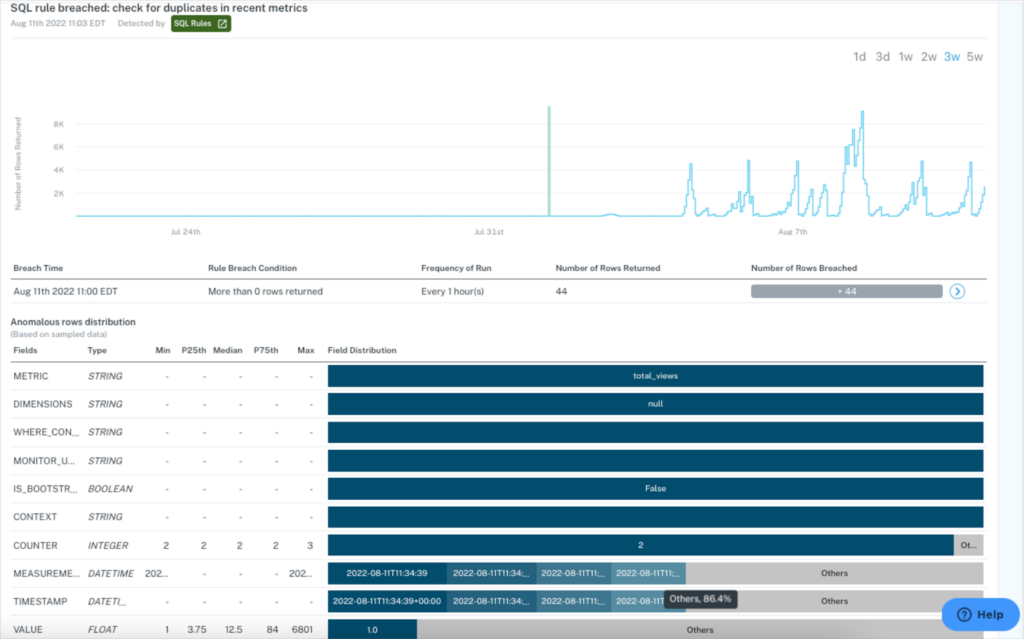
- Distribution: Distribution anomalies are when your data values are outside of an accepted range. There could be situations where it is an acceptable outlier, such as a spike of visitors hitting your website during a conference, or times where it’s nonsense like reporting a shipment from New York to LA happened in seconds. Either way, it’s an indication you should dig in and investigate.
- Volume: Volume anomalies refers to when you either have too much or too little data, indicating there might be an issue with the health of your data source. If 200 million rows suddenly turns into 5 million, you should know.
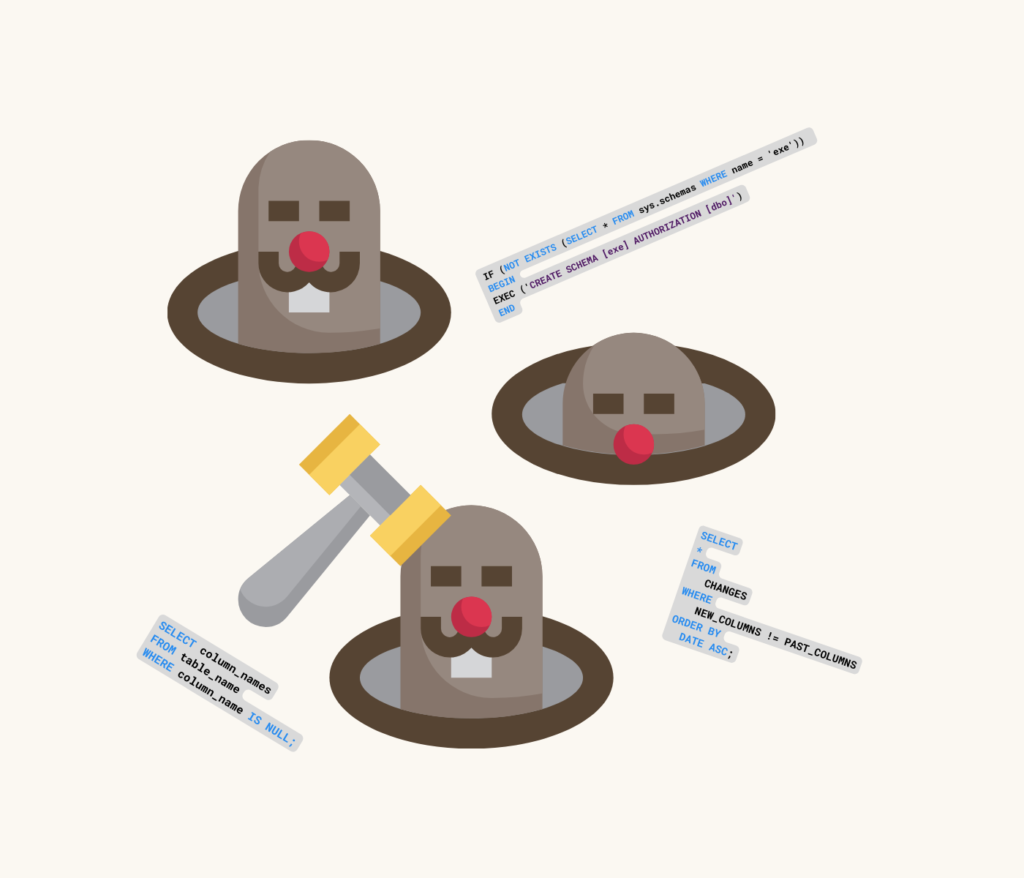
- Schema: Schema anomalies happen when the organization of the data changes. It could be as simple as renaming or adding a column or changing a field type from a stream to numeric. When these changes are unexpected (and they are more often than not) they break processes downstream.
It’s important for data teams to understand these anomaly categories so they can quickly assess the issue, label the problem, and communicate using a shared vocabulary.
The other reason to categorize your anomalies is because data anomaly type can sometimes be a clue where the problem lies (and thus expedite time-to-resolution). This is especially the case for data engineers with experience in that specific platform who wear the scars of past incidents.
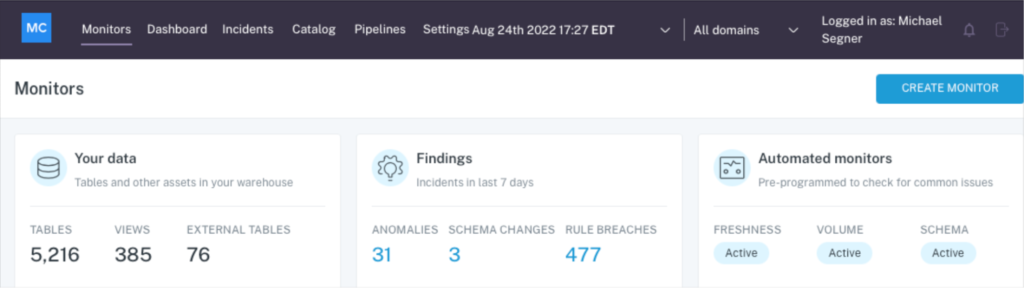
For example, there are many ways data freshness anomalies can occur, but when you see one, the first thing you should do is check your Airflow DAG to see if the job failed. These checks can be done manually once a data consumer has emailed a nasty note about the data quality, but a better way is to implement automated data monitoring so your team is the first to know.
Dare we sing from the shadowy graveyard of broken dashboards, “be prepared?”
Not only does proactive data monitoring preserve data trust and accelerate time-to-detection, but it also accelerates the time to resolution. That’s because there is a quicker cognitive jump and intuitive understanding of causation–or what could have recently changed in the environment that caused the issue.
Assess impact and triage
Do you remember those times when the coyote chased the roadrunner in such haste that when he looked down he discovered there was no ground under his feet? He moved quickly, but not effectively, and as a result plummeted to a cartoony demise.
Anomaly resolution is the same way. One of the reasons it takes data teams so much time is they find themselves chasing every anomaly with the same amount of effort without knowing when or if the bottom will fall out from under them.
In other words, they don’t know if the impact of the anomaly is proportionate to the response. For example, if a dashboard hasn’t been updated in 4 hours, is that a problem? Sometimes it is, and sometimes it isn’t.
One way to avoid going SPLAT is to identify your most important data assets and work with business stakeholders to create data SLAs. Working with the consumers to codify their expectations and use cases provides the necessary context for effective incident triage.
The challenge is that data assets are constantly being added and data consumption patterns are ever changing. Automated data lineage can help teams effectively identify their key tables in a constantly evolving environment.
Proactively communicate across teams
Communication is essential to root cause analysis and anomaly resolution. The first step is making sure the right data engineer has the right alert.
Just like Jack Skelington is much better at Halloween than Christmas, members of the data team are going to be more effective at troubleshooting anomalies within their own domain or areas of expertise. Routing alerts and assigning tasks is critical to creating ownership and accountability while avoiding burnout.
Why burnout? Well it can be tempting for teams to assign their most talented engineers to help put out fires wherever they may set ablaze, and while urgent, this task can also be tedious.
As Red Ventures Director of (Data) Product Management, Brandon Beidel said bad data could, “…trigger a 2 to 3 hour expedition for an engineer to hunt down the origin of the problem. And, unfortunately, the engineers that were the best at finding these issues then became inundated with these types of questions. We needed to find a way out of this hedonic treadmill and endless loop of time being taken away from productive people.”
The second step is to inform your data consumers there is an issue so they don’t act on or spread bad data. One data engineering leader we know described a situation where a table was used for an executive report. They identified a volume anomaly and quickly emailed their matrix partner, or business stakeholder, who owned the report just to say, “We have a problem right now, but we are working on it. Please don’t send your daily report yet.”
The business stakeholder was incredibly appreciative of their proactive initiative. It was a moment where the matrix partner knew the data engineering team had their back. All of a sudden the data team went from fixing a problem to delivering a service.
Finally, it’s important to communicate not just within the data engineering team but across other teams that may be at the root of the issue.
For example, is that schema change a one-off anomaly, or will it change the output of the product telemetry data you are ingesting as a result of a new feature pushed by the software engineering team? Your IT team probably knows.
Determine upstream dependencies
Once the type of anomaly has been identified and impact assessed, data teams need to identify the most “upstream” table impacted. In other words, where does the bad data first enter your environment?
This is critical for two main reasons. The first is that the most upstream table will provide critical context for root cause analysis. If the anomaly is one of the most upstream tables, it’s likely a system issue from the data source. If the issue is originating far downstream near the data consumer, it’s likely a code issue or dbt model that is the culprit.
The second is that you can’t fix the root cause if you aren’t…well, at the root of it. Otherwise, no matter how frequently you backfill correct data into your table, bad data will continue to cascade from wherever it is originating.
Automated data lineage can help teams avoid the cartoonish process of combing through SQL queries to manually trace and re-trace table dependencies in an endless maze to find the anomaly’s origination point. If you do this manually, you’ll find that “you should have taken a left at Albuquerque.”
Analyze the three infrastructure layers that introduce anomalies
There are a near infinite number of root causes for each type of anomaly, but they all stem from issues across three layers of your data infrastructure.
Understanding these layers and how they produce data anomalies can provide structure to your incident resolution process.
- System root causes: System or operational issues are found when there is an error introduced by the system or tools that customers apply to the data during the extraction, loading and transformation processes. An example of this could be an Airflow check that took too long to run causing a data freshness anomaly. Another example could be a job that is relying on accessing a particular schema in Snowflake, but it doesn’t have the right permissions to access that schema.
- Code root causes: The second type of data incident root causes are code related. An example would be is there anything wrong with your SQL or engineering code? An improper JOIN statement resulting in unwanted or unfiltered rows perhaps? Or is it a dbt model that accidentally added a very restrictive WHERE clause that resulted in a reducing number of rows of output data triggering a volume anomaly?
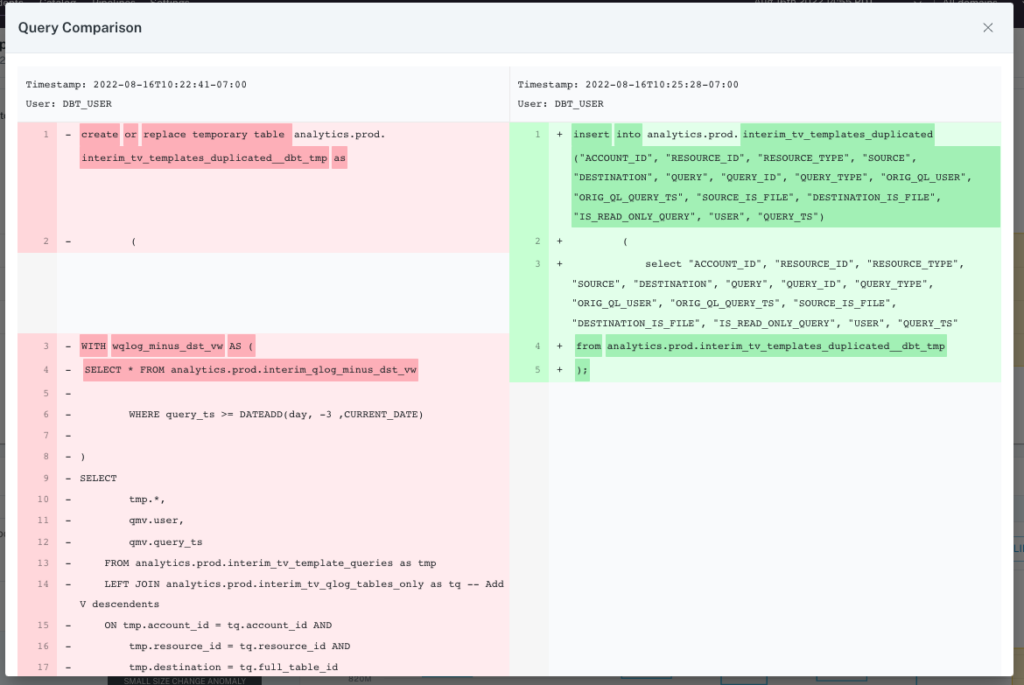
If you can find a query or dbt model was modified around the approximate time an anomaly was introduced, it’s a promising sign you’ve found your root cause. This process can be expedited with data monitoring and log analysis across your stack.
- Data root causes: System and code issues are also very typical in software engineering, but in the wonderful world of data engineering, there can also be issues that arise in the data itself making it a more dynamic variable. For example, it could be a consumer application where the customer input is just wacky. Let’s say you are an online pet retailer and someone enters their dog weighs 500 pounds instead of just 50 which results in a field health anomaly.
While you could manually run multiple queries to segment the data with the repetition of Bart Simpson writing his lines on the chalkboard in detention, this is also a process that can be automated. There are multiple data quality solutions, including data observability platforms, that can quickly visualize the “bad rows” that break a user-defined business logic to help pinpoint where the problem lies.
Consolidate the incident resolution process
Since data anomalies can originate across each component of the pipeline, as well as the data itself, incident resolution gets messy.
Data teams may have tabs open for Fivetran, Databricks, Snowflake, Airflow, and dbt, while simultaneously reviewing logs and error traces in their ETL engine and running multiple queries to segment the data.
Data observability can help consolidate this process by allowing you to see any changes to SQL code, dbt models, and Airflow issues all in a single pane of glass, with the full data lineage just a click away. This reduces context switching enabling faster resolution.
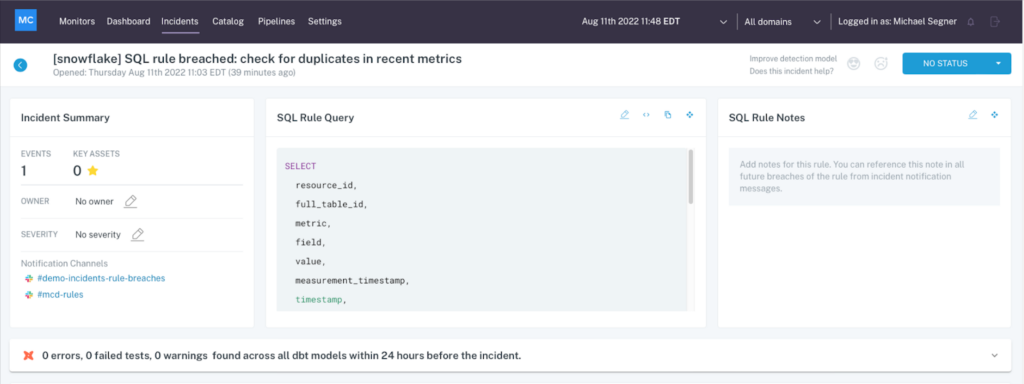
With data observability, you can instantly review an incident’s associated SQL queries, dbt models, and more in a single pane of glass.
Time to get real
Your team needs to get faster at resolving data issues to mitigate negative impacts and so it can spend more time on tasks that add value to the business.
Otherwise, every data incident will start feeling like someone dropped a piano on your head.
Interested in making data anomaly a resolution a little less cartoonish? Reach out to Mei and the rest of the Monte Carlo team.
Our promise: we will show you the product.
Read more posts.