 Product demo.
  What is data observability?
  What is a data mesh--and how not to mesh it up
  The ULTIMATE Guide To Data Lineage
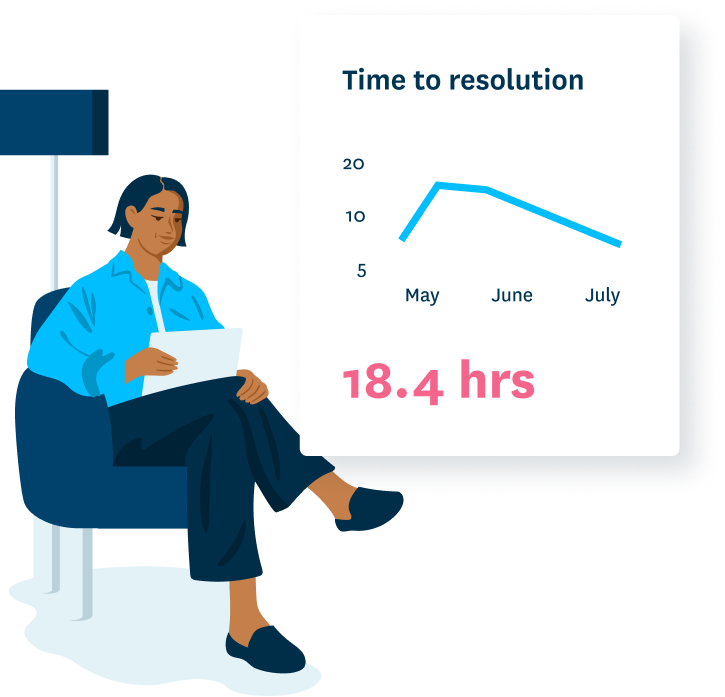


The Monte Carlo difference

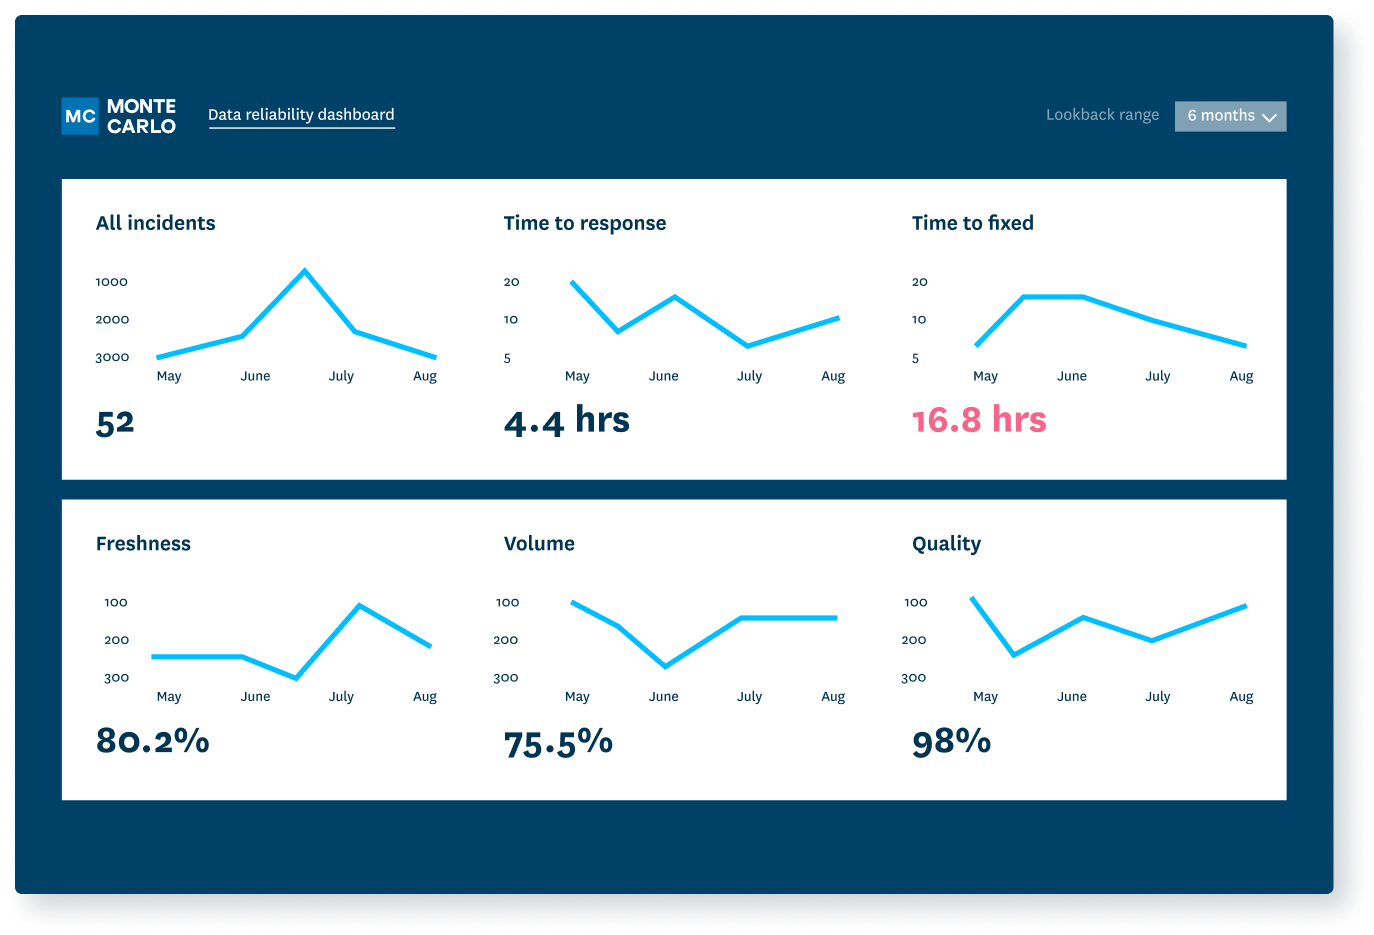
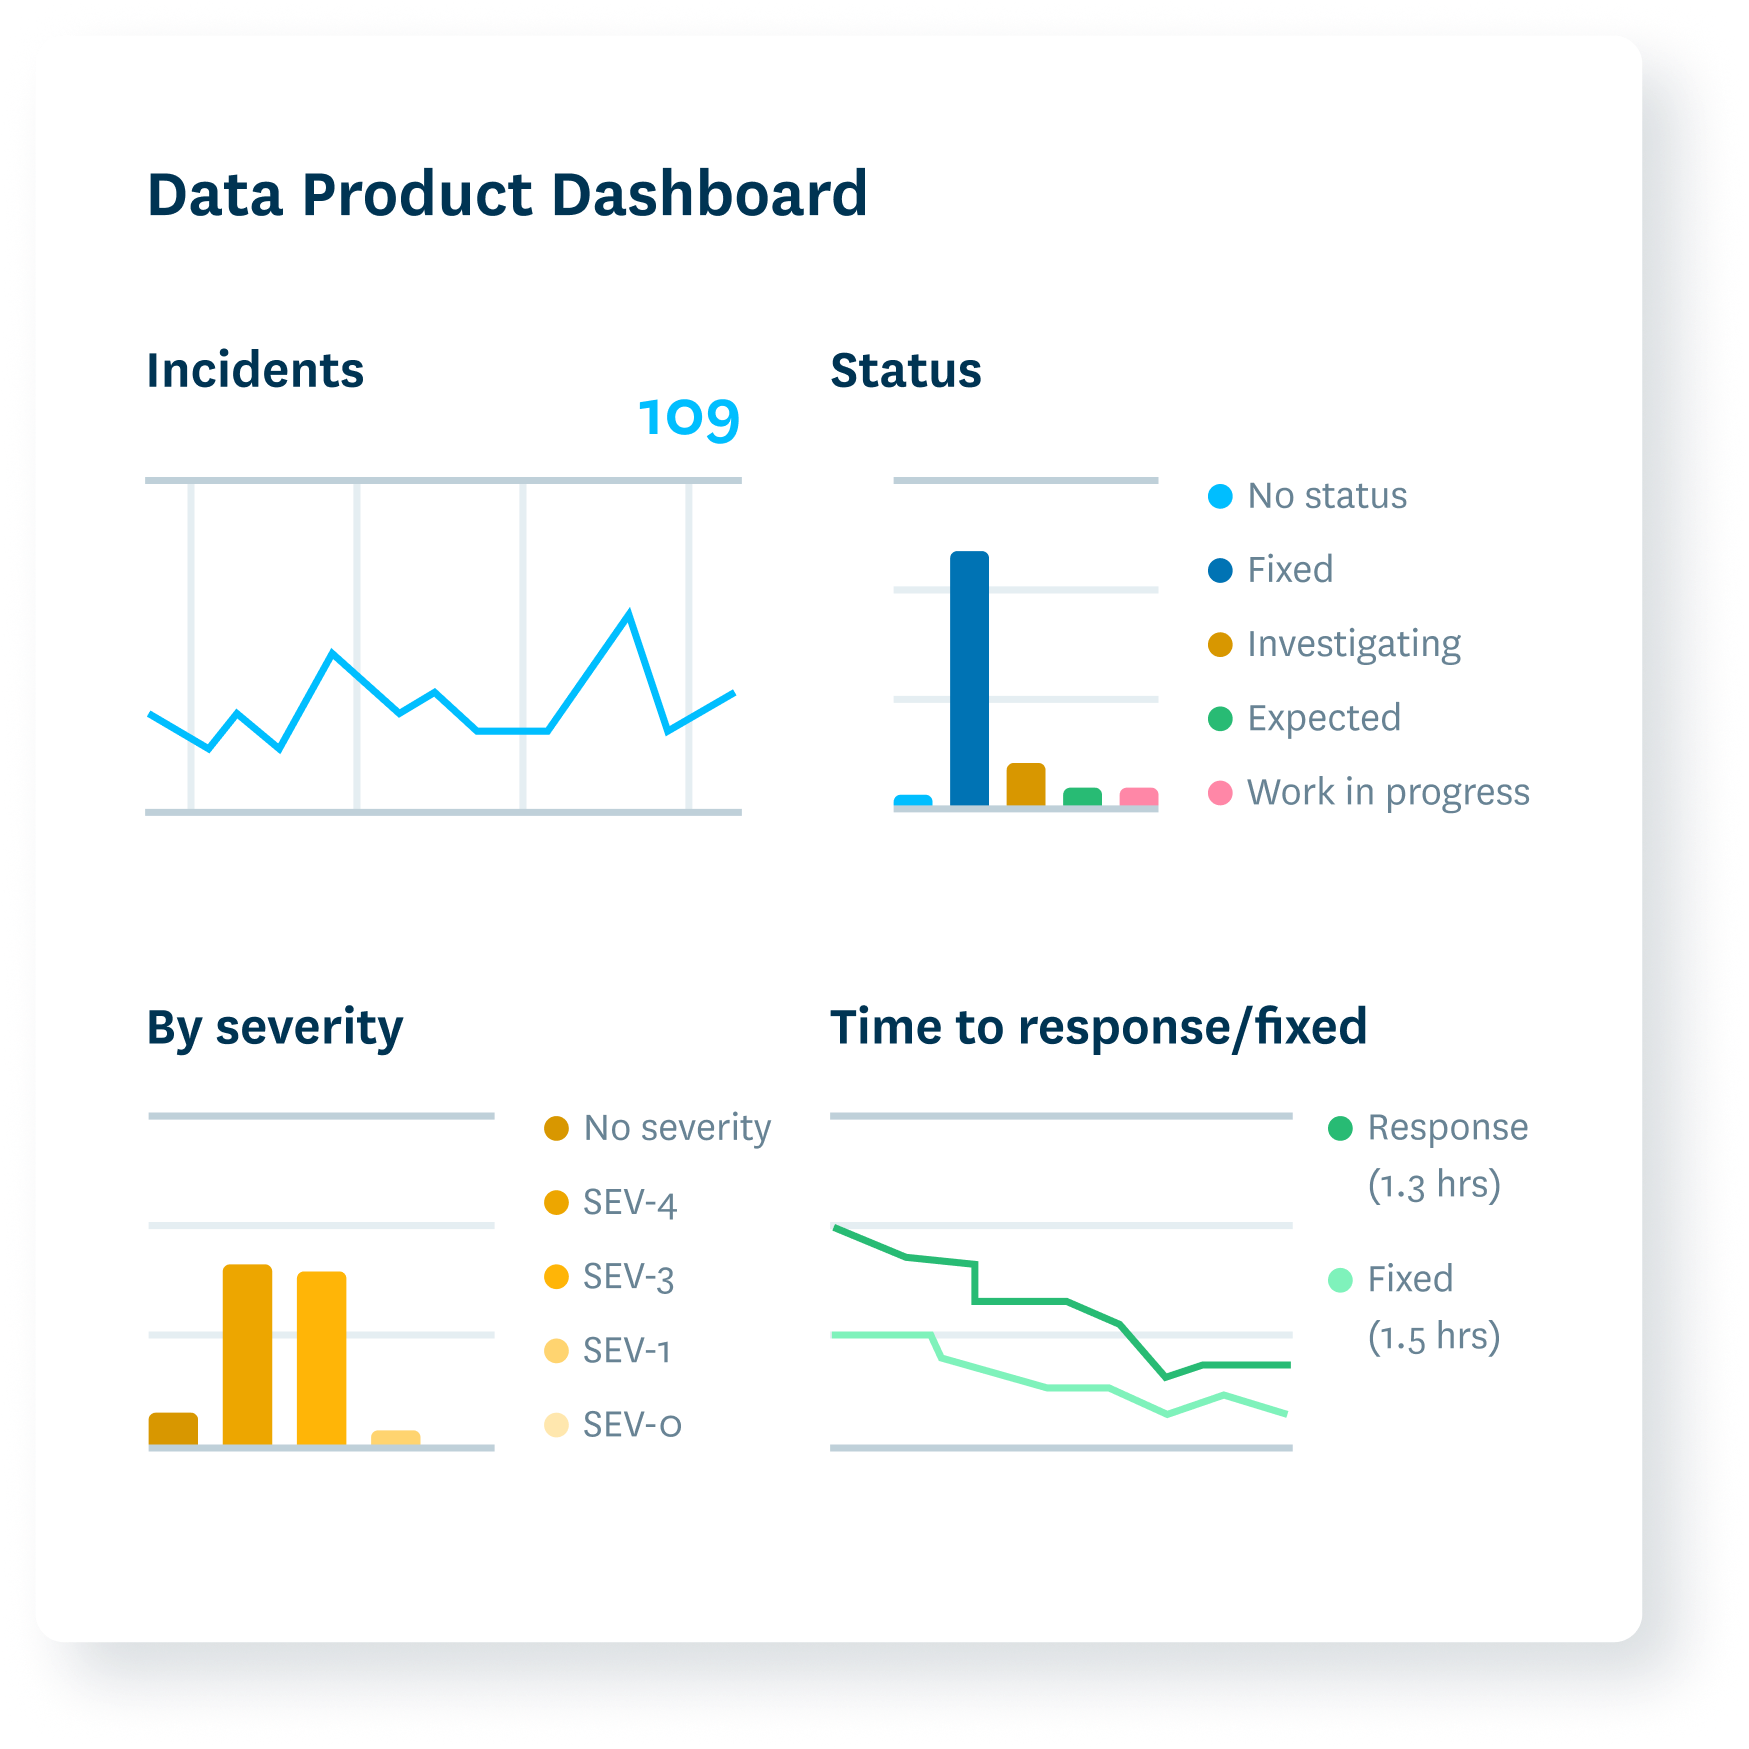
Insight into incident response times.

Reliability indicators at domain, product, and table levels.

Health status dashboards.

“It has also helped us to understand where problems are likely to occur, where things are brittle. And over time, we’ve invested effort into cleaning up our lineages, simplifying our logic.”

“It tells us where to optimize our time and resources…Having a record also evolved the evaluation of our [data] team from a feeling…to something more evidence based.”

“The platform gave me a mental picture of where to invest time fixing pipelines or changing data sources…. Whereas before Monte Carlo, we’d only see a portion of the errors that were flagged by a stakeholder or maybe a dbt test.”
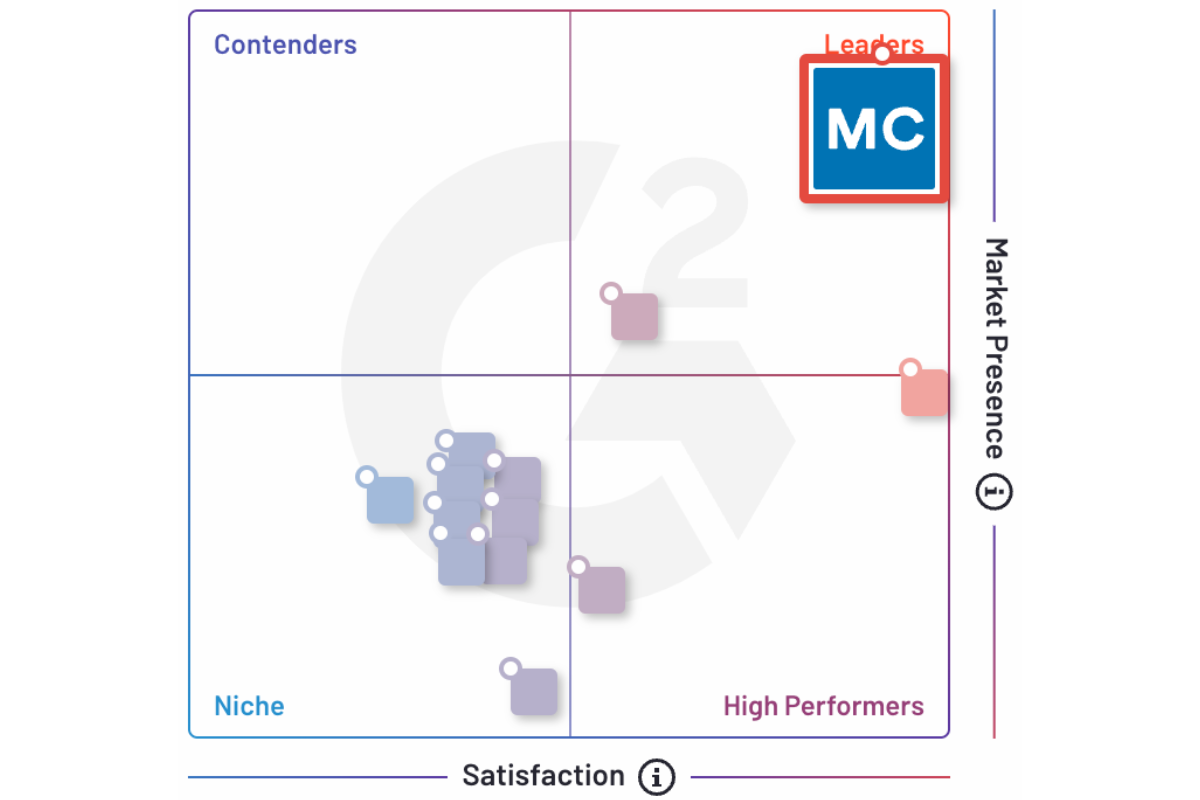
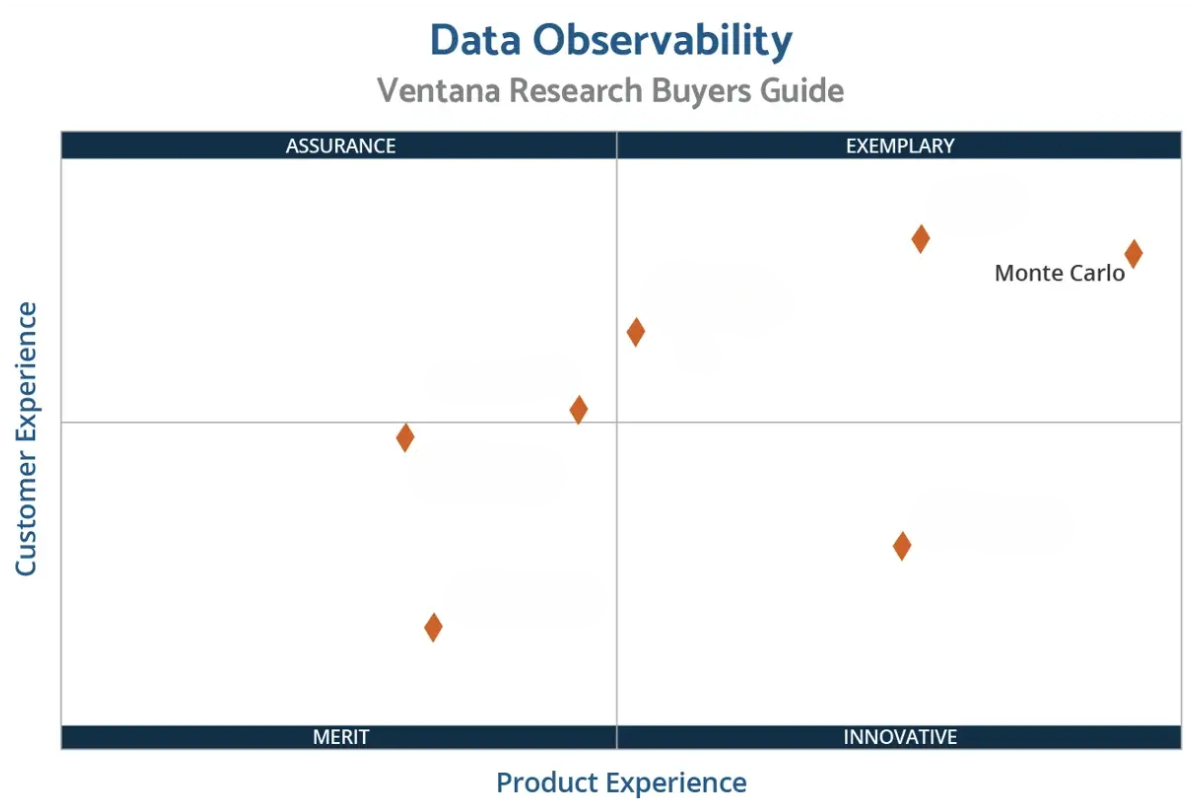
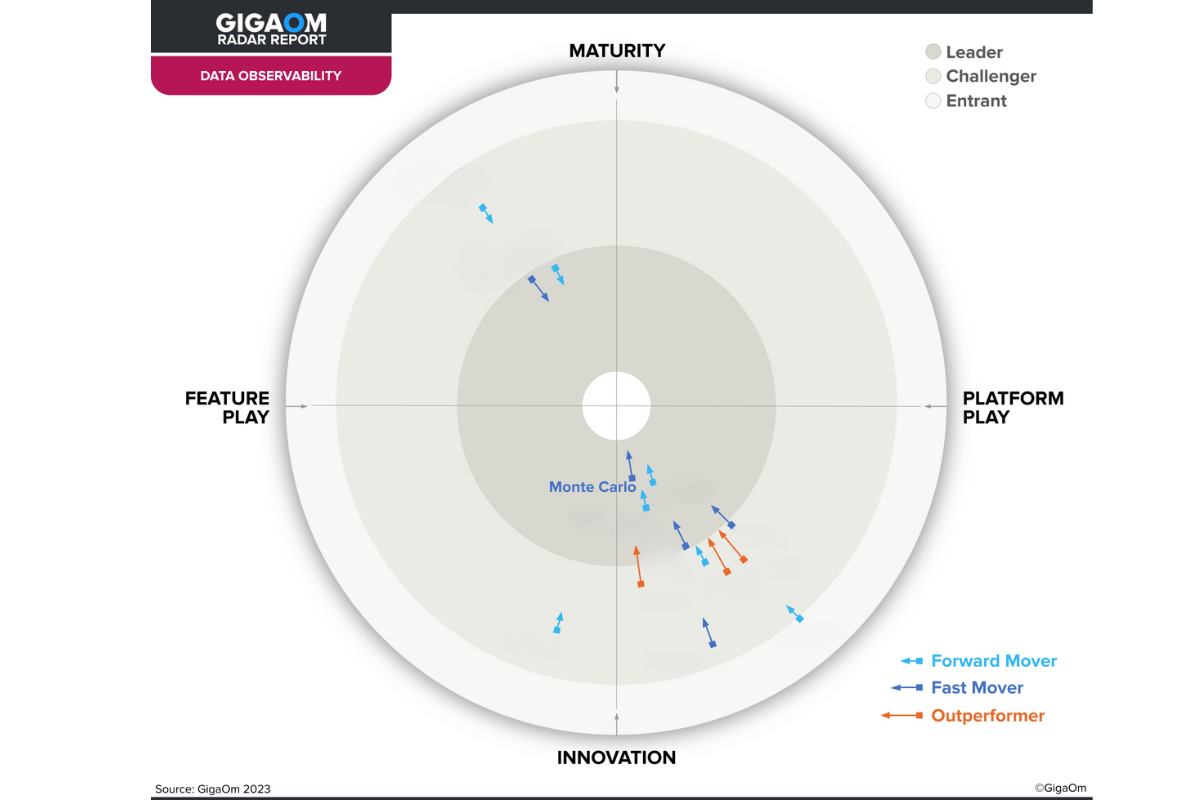
The Undisputed Leader
-
“Monte Carlo is a tool that is easy to implement, use, and drive value through for users across our organization. In our case, we started seeing value during the first week …and have continued to generate more value since!”
-
“Monte Carlo performed best in Customer Experience with an A- grade, notably in TCO/ROI, receiving an A due to its articulation of strategic values and tools to help customers calculate costs. In Usability, intelligence and user experience are strengths.”
-
“The platform’s diverse compilation of source connections, low-code user interface, ML monitoring capabilities, strong data pipeline support, and data catalog make this an extremely well-rounded offering out the gate.”
Demonstrate ROI
Step one: improve data reliability. Step two: show off data reliability
- See incident levels over time.
- Track table uptime percentages automatically for freshness, volume, and other key quality dimensions.
- Drill into uptime by domain.
Build trust
Surface key data product service level indicators so others can see if they fit their needs.
- Demonstrate data health across assets within your pipeline.
- Understand data product support levels and operational response.
- Uncover specific incidents and trends to enforce data SLAs.
Allocate resources wisely
Know where your data quality hotspots are so you can give them extra time and attention.
- See which tables suffer the most data quality incidents and which pipelines may need refactoring.
- Know which teams and domains have best practices to share and which need additional support.
- Deprecate unused tables and fields.
