Fix data issues in minutes
Every day thousands of incidents are resolved with Monte Carlo.
The Monte Carlo difference

Consolidated visibility into your data, systems, and code.

Automatic root cause analysis insights.
Integrated data lineage and anomaly detection.

“Whenever a root cause analysis insight is there, that eliminates the time we would need to take to manually query the error to see what it is. The platform automatically shows how this specific field is correlated with this change and we can quickly understand the error.”

“Within just a few clicks, we saw all of the distinct nodes flowing into the view we were querying, and it became immediately apparent what the problem was.”
“Data issues are resolved in an hour whereas before it might take a full day.”
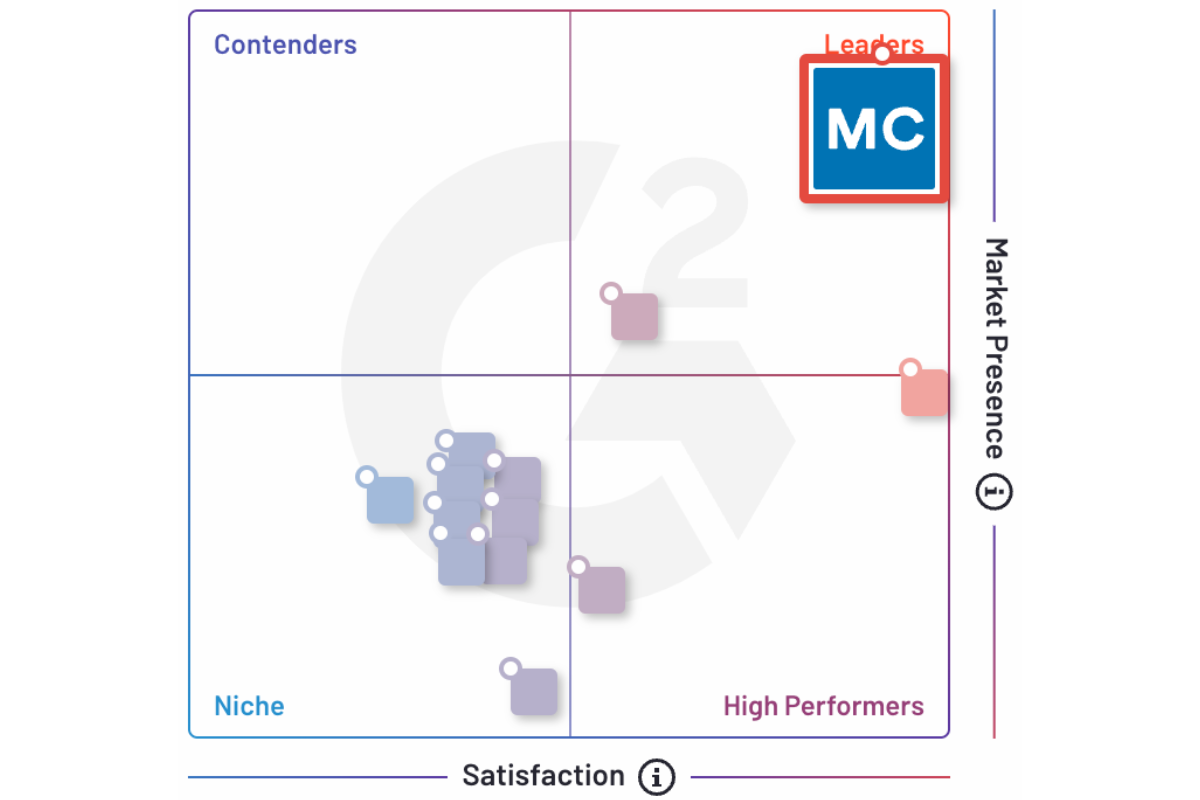
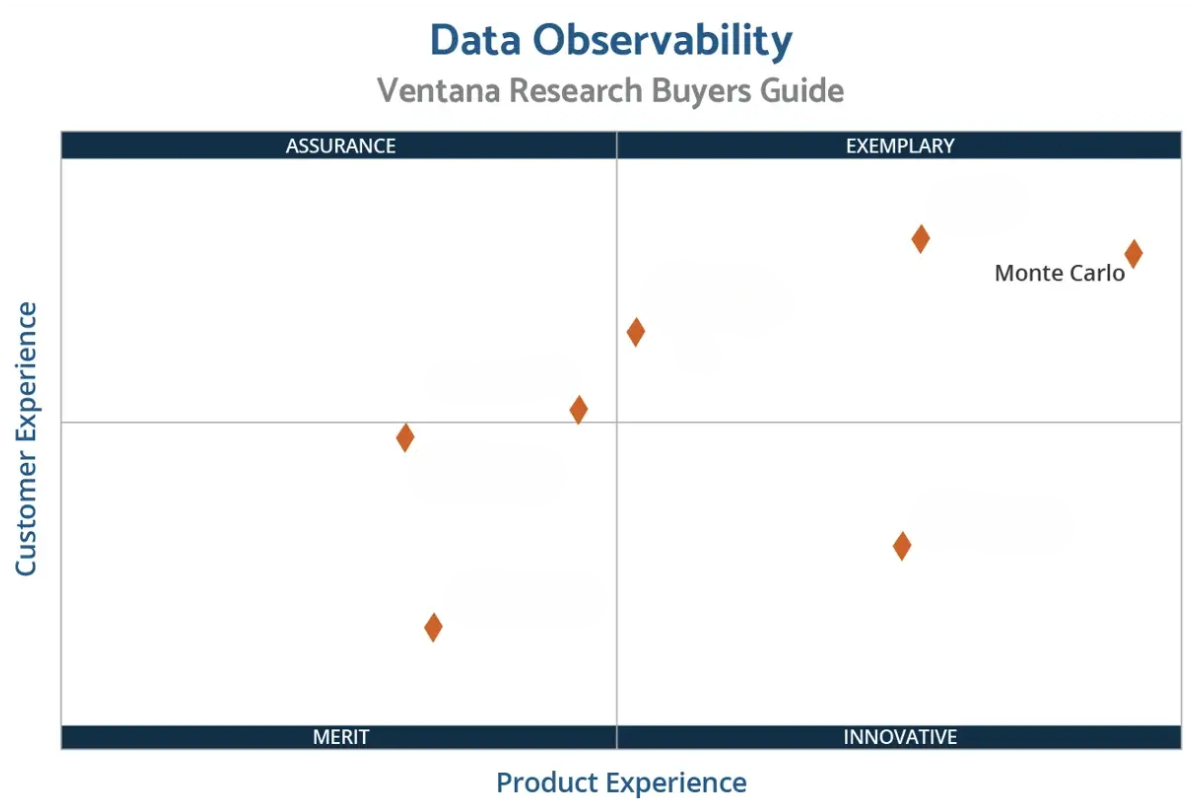
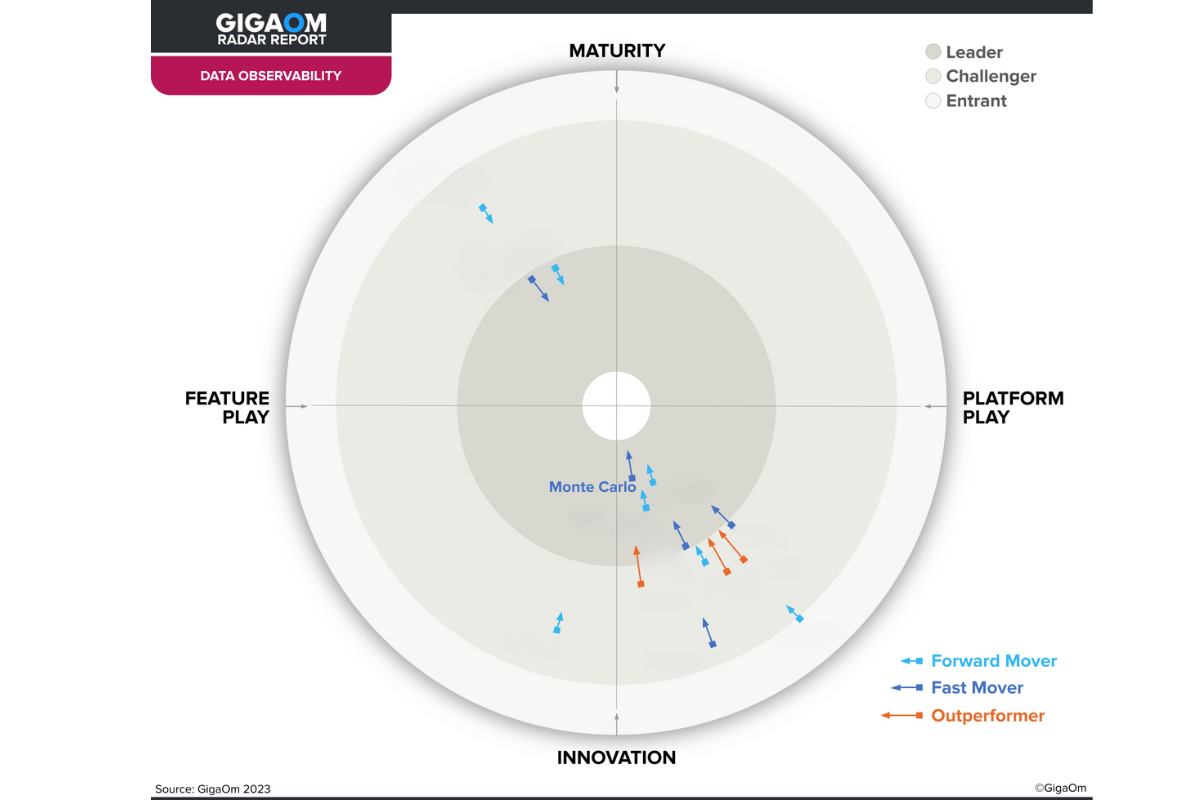
The Undisputed Leader
-
“Monte Carlo is a tool that is easy to implement, use, and drive value through for users across our organization. In our case, we started seeing value during the first week …and have continued to generate more value since!”
-
“Monte Carlo performed best in Customer Experience… notably in TCO/ROI, receiving an A due to its articulation of strategic values and tools to help customers calculate costs. In Usability, intelligence and user experience are strengths.”
-
“The platform’s diverse compilation of source connections, low-code user interface, ML monitoring capabilities, strong data pipeline support, and data catalog make this an extremely well-rounded offering out the gate.”
Surface insights
Shorten your investigation with automatic insights that tell you where to look first.
- Go right to the root cause.
- Investigate the full incident context with a single click.
- More automated and accurate insights than any other data observability solution.
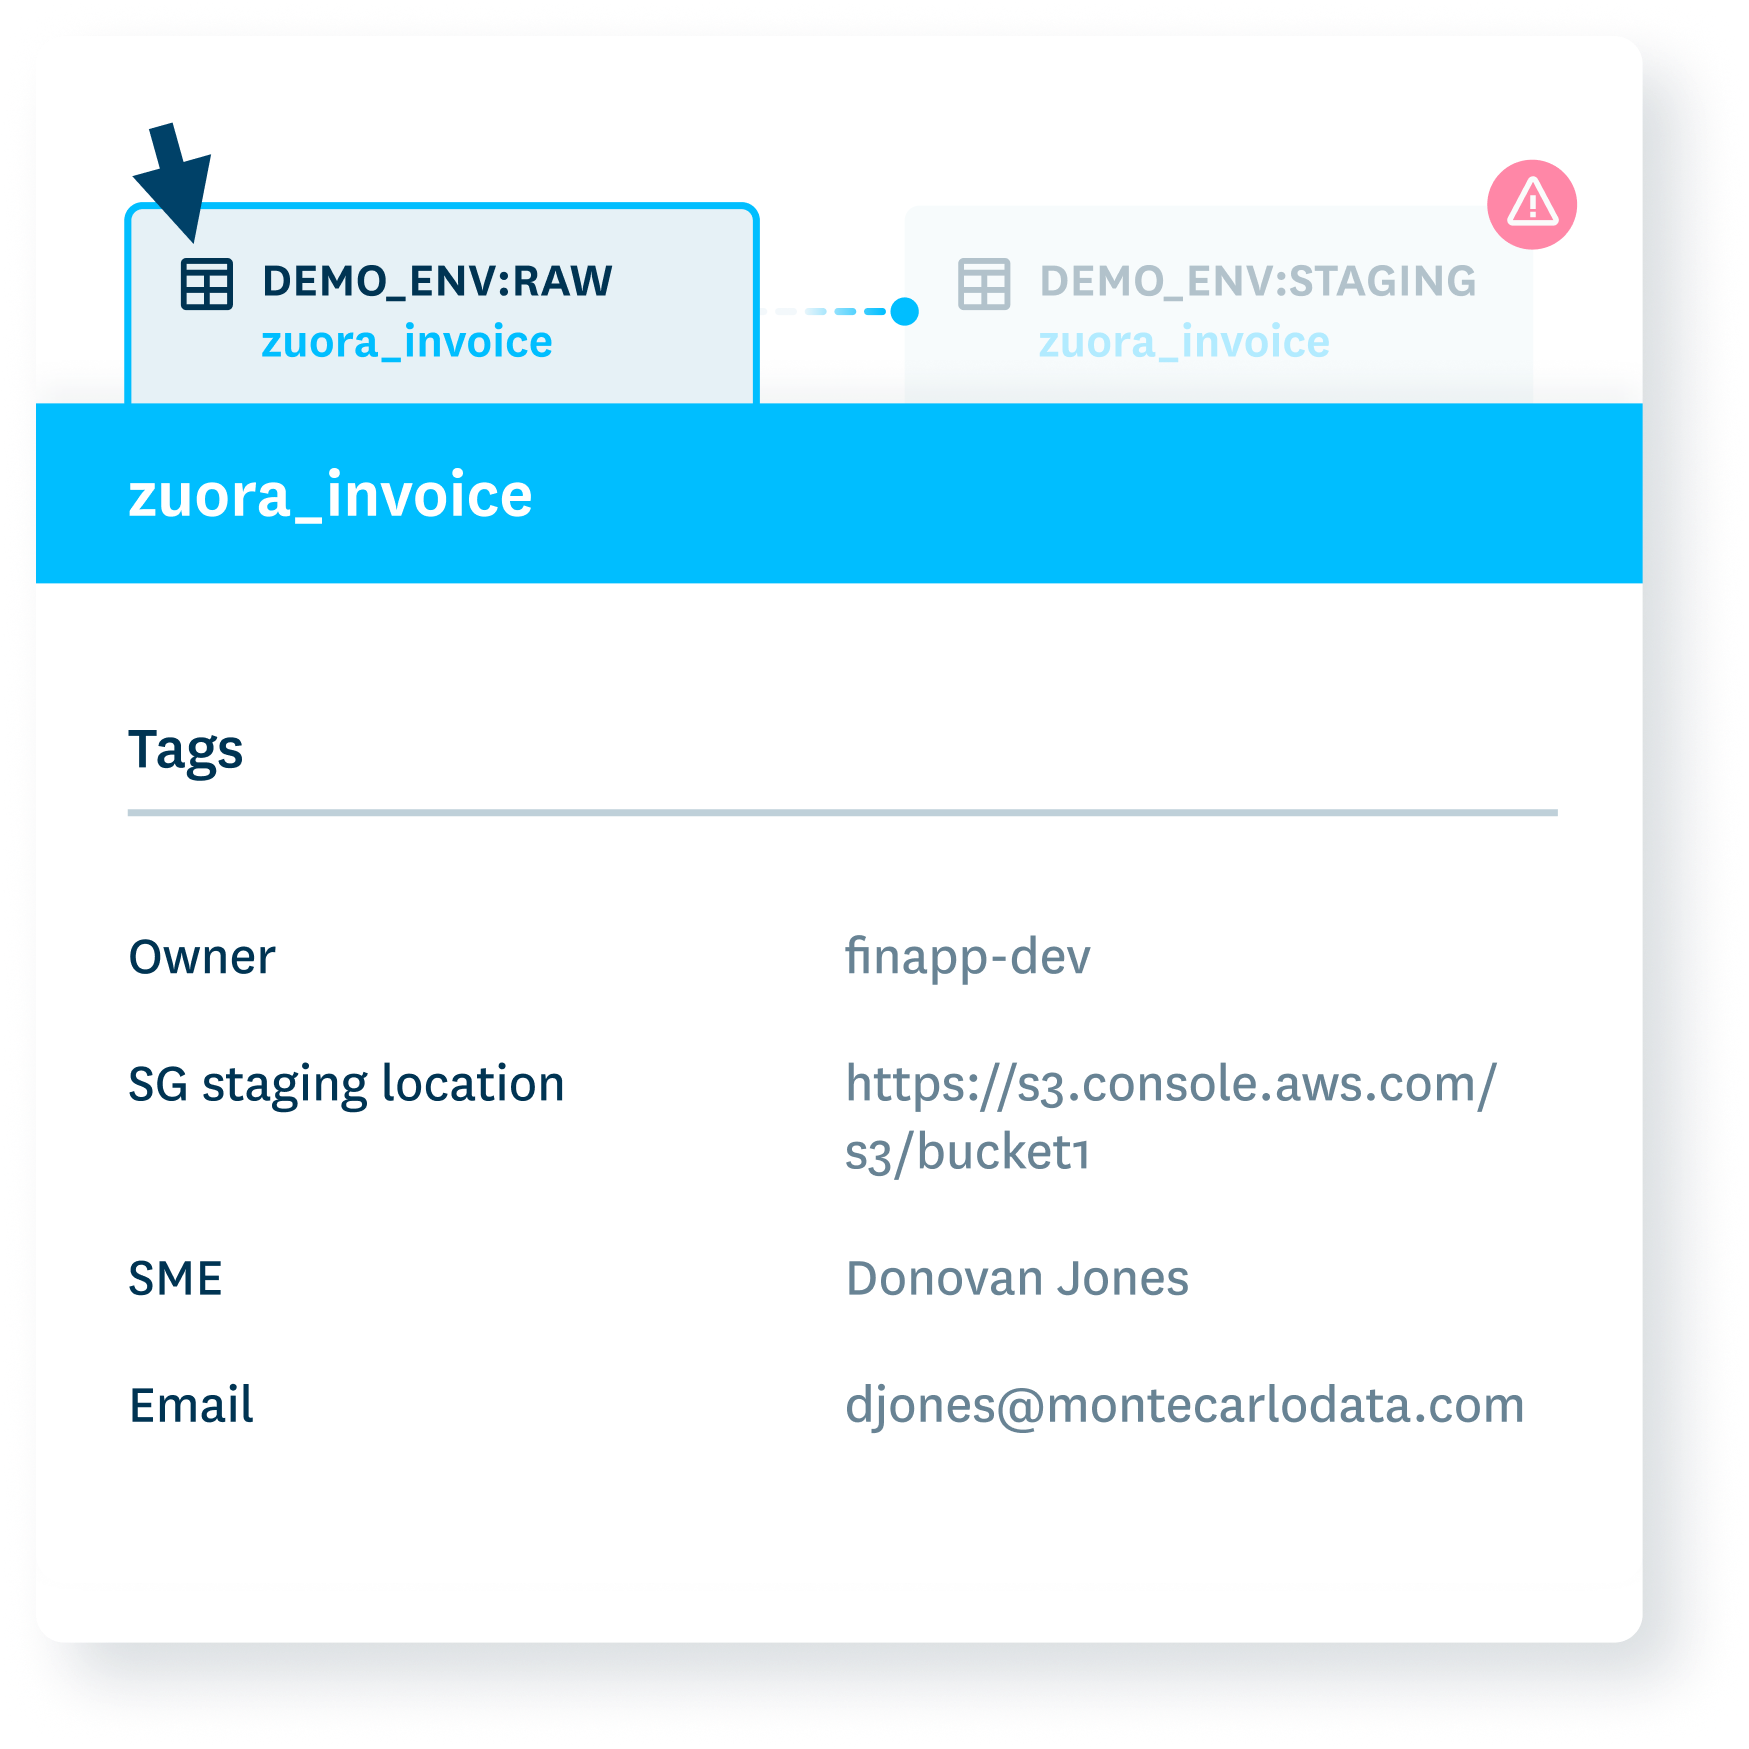
Understand root cause
Know if data was bad from the start and what source generated it.
- Zero in on which data segments are incorrect with automated correlation analysis.
- Peruse sample records starting with the most anomalous.
- Get automated recommendations for investigative queries.
- Explore datasets interactively with no-code data profiling.
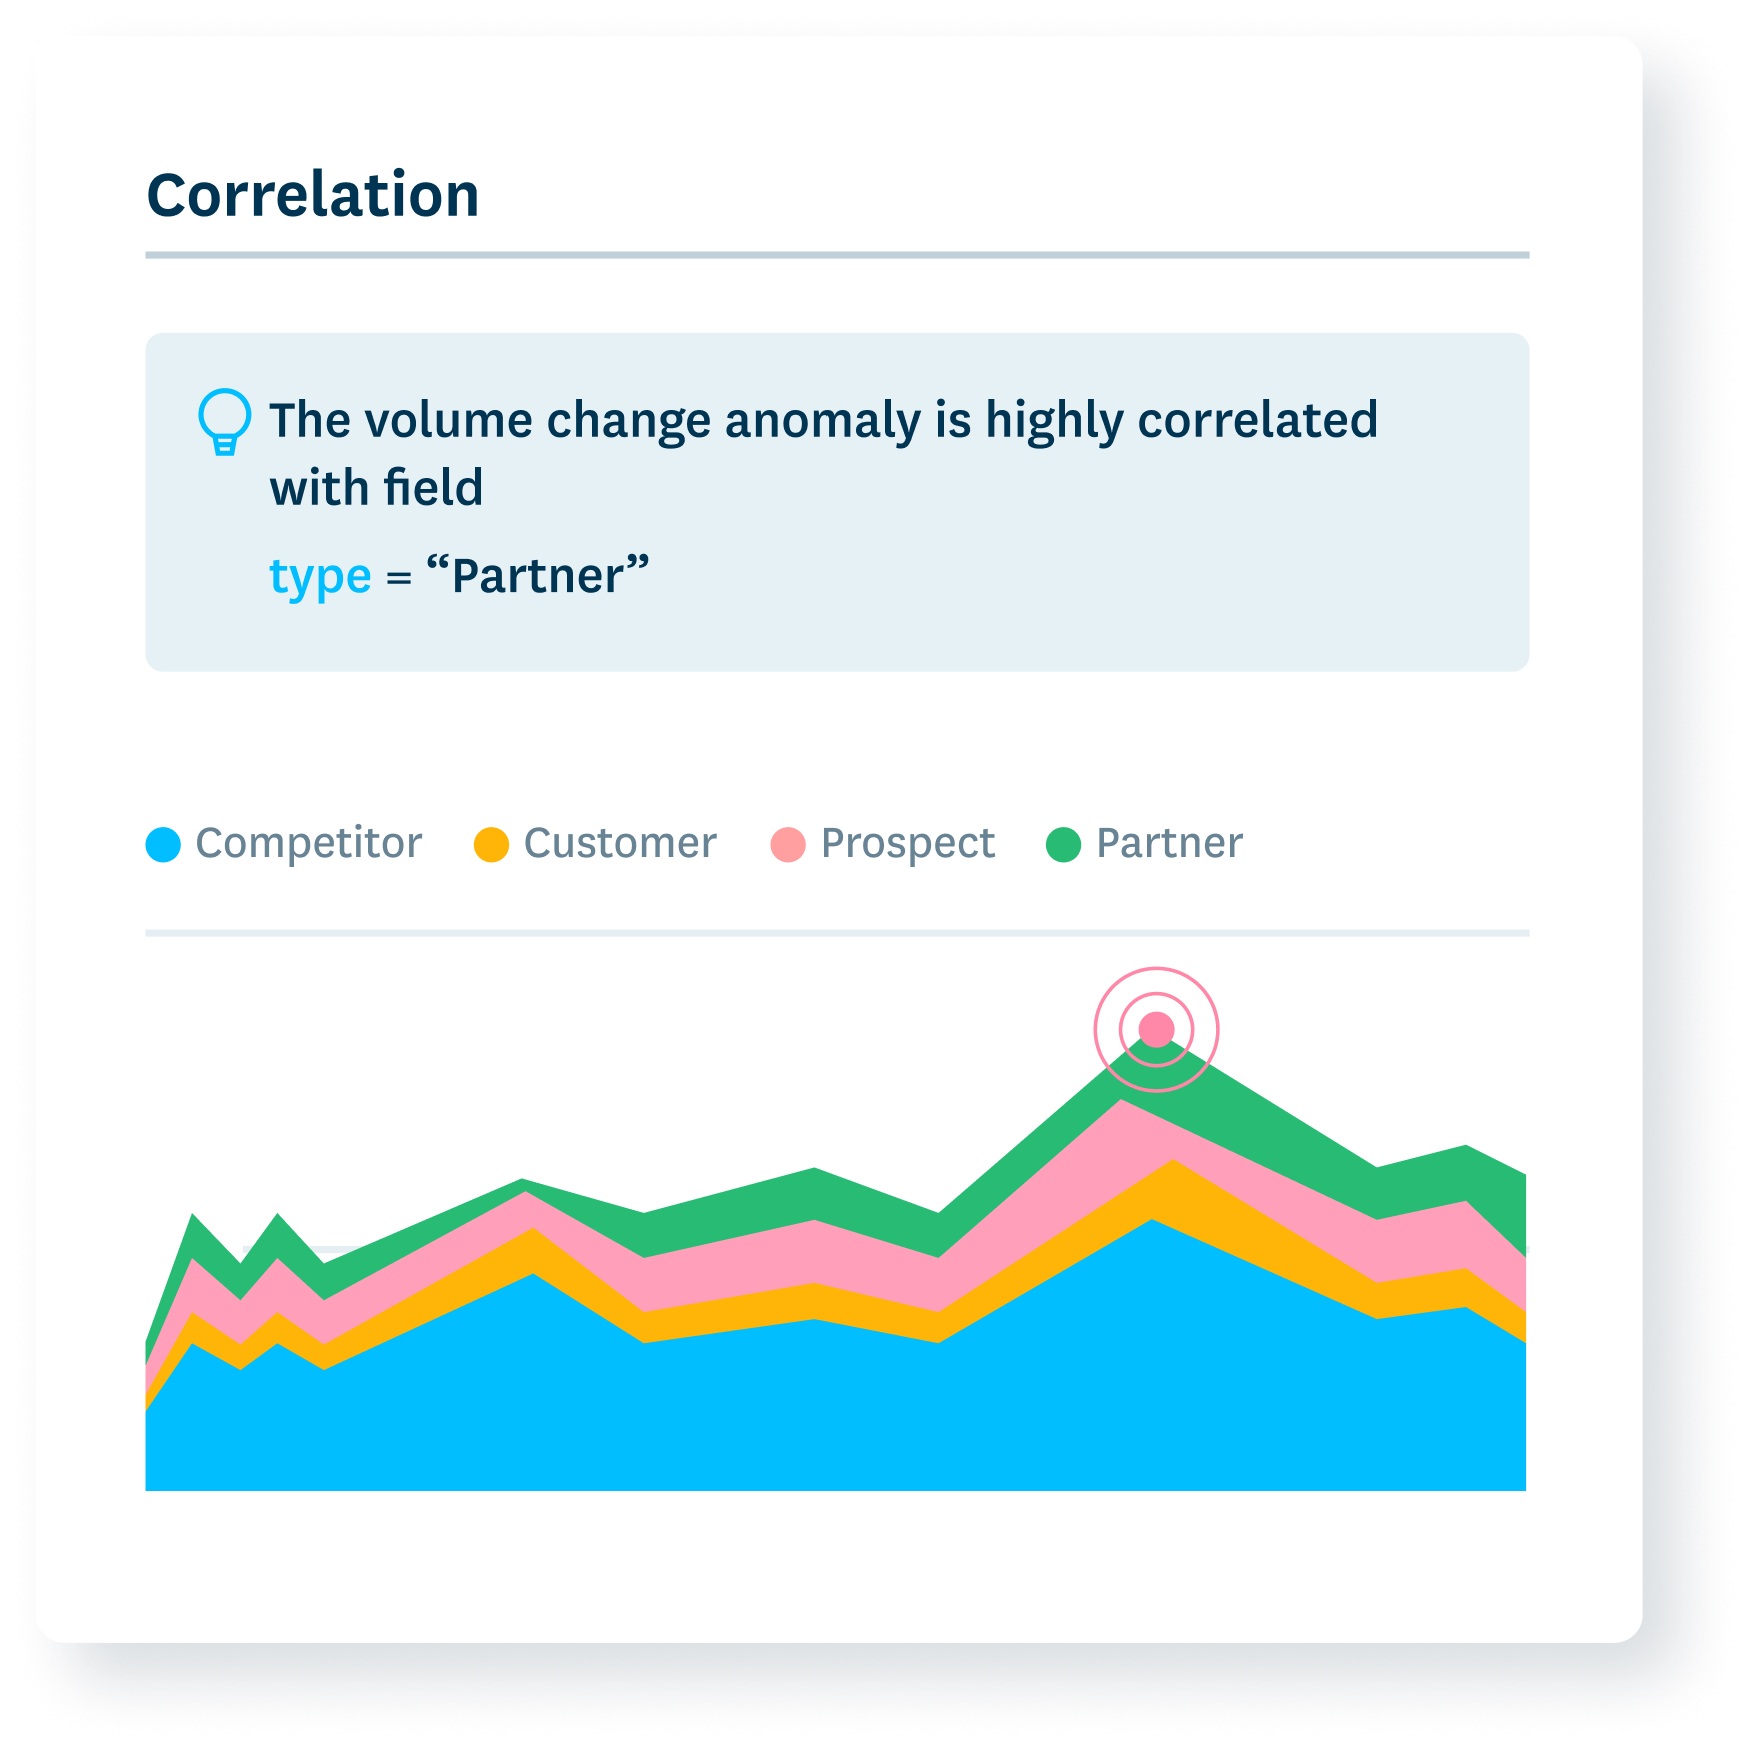
Correlate system behavior
Instantly understand how system failures and data incidents are related.
- Review performance data and key metadata from ETL tools like dbt, Airflow, Fivetran and more within a single pane of glass.
- Dive into the behavior of your data platforms with easy exploration of query logs and Delta table history.
- See which DAGs, jobs, models, or connectors are populating specific tables.
- Get alerted to issues with system integration, credential, or permissioning failures.
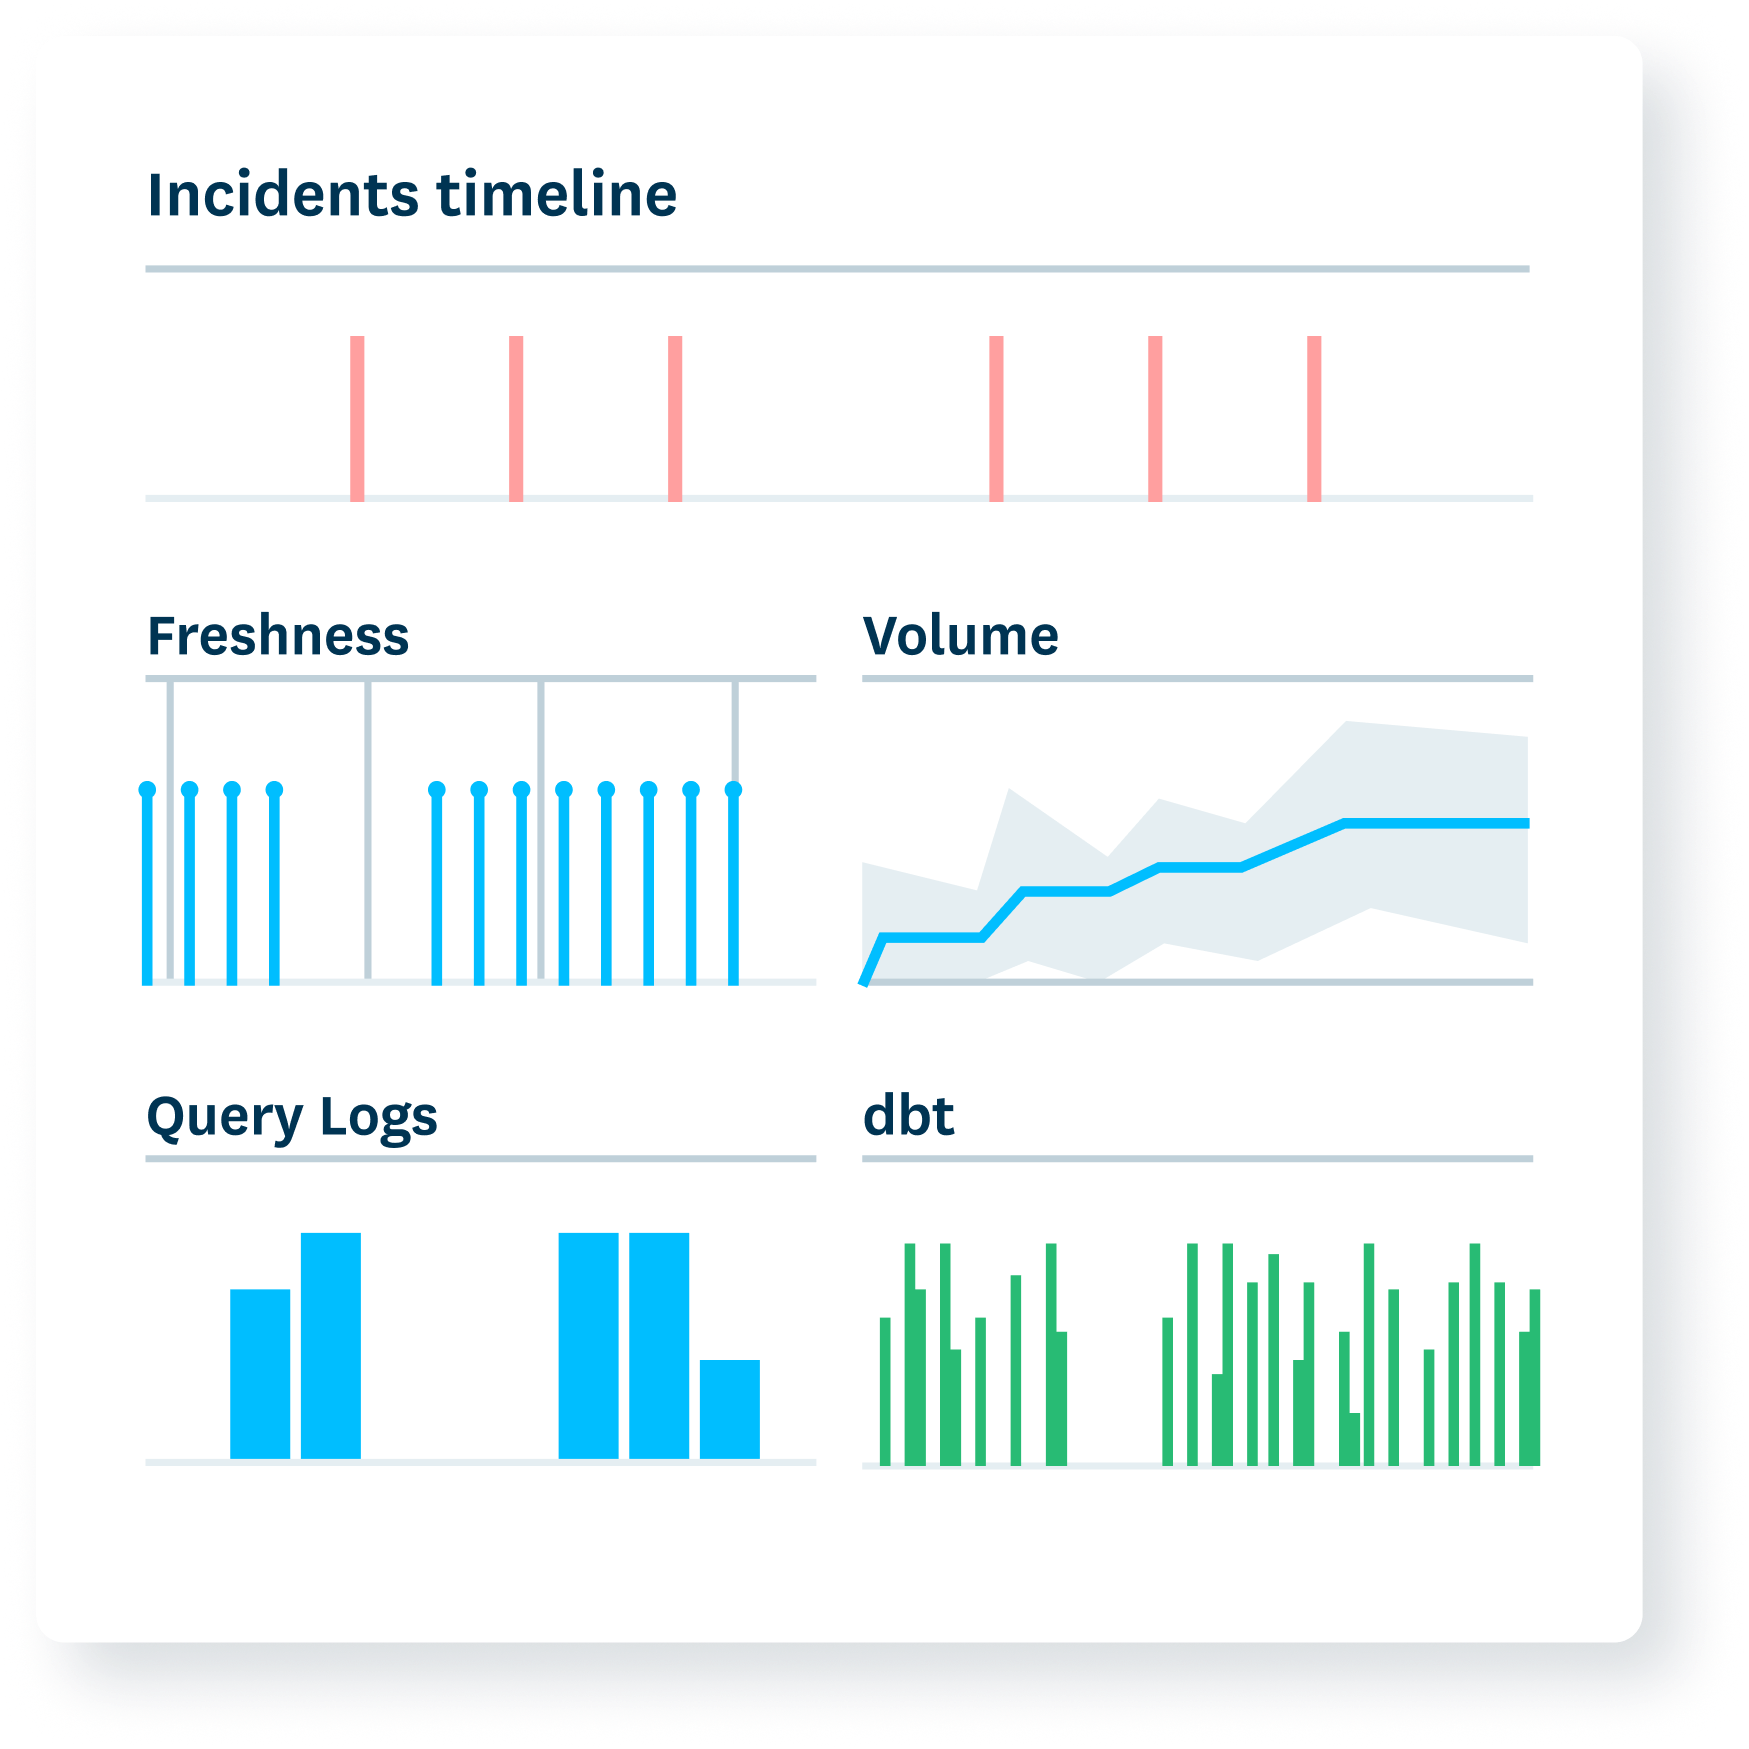
Stop combing code
Needles and haystacks are no fun. Go directly to the line of code causing your data issue.
- Compare queries to automatically see what changes have led to incidents.
- Get alerted to problematic query behavior including failures, skips, and even successful runs where the intended action doesn’t occur.
- Understand how dbt model changes and GitHub pull requests impact your data assets.
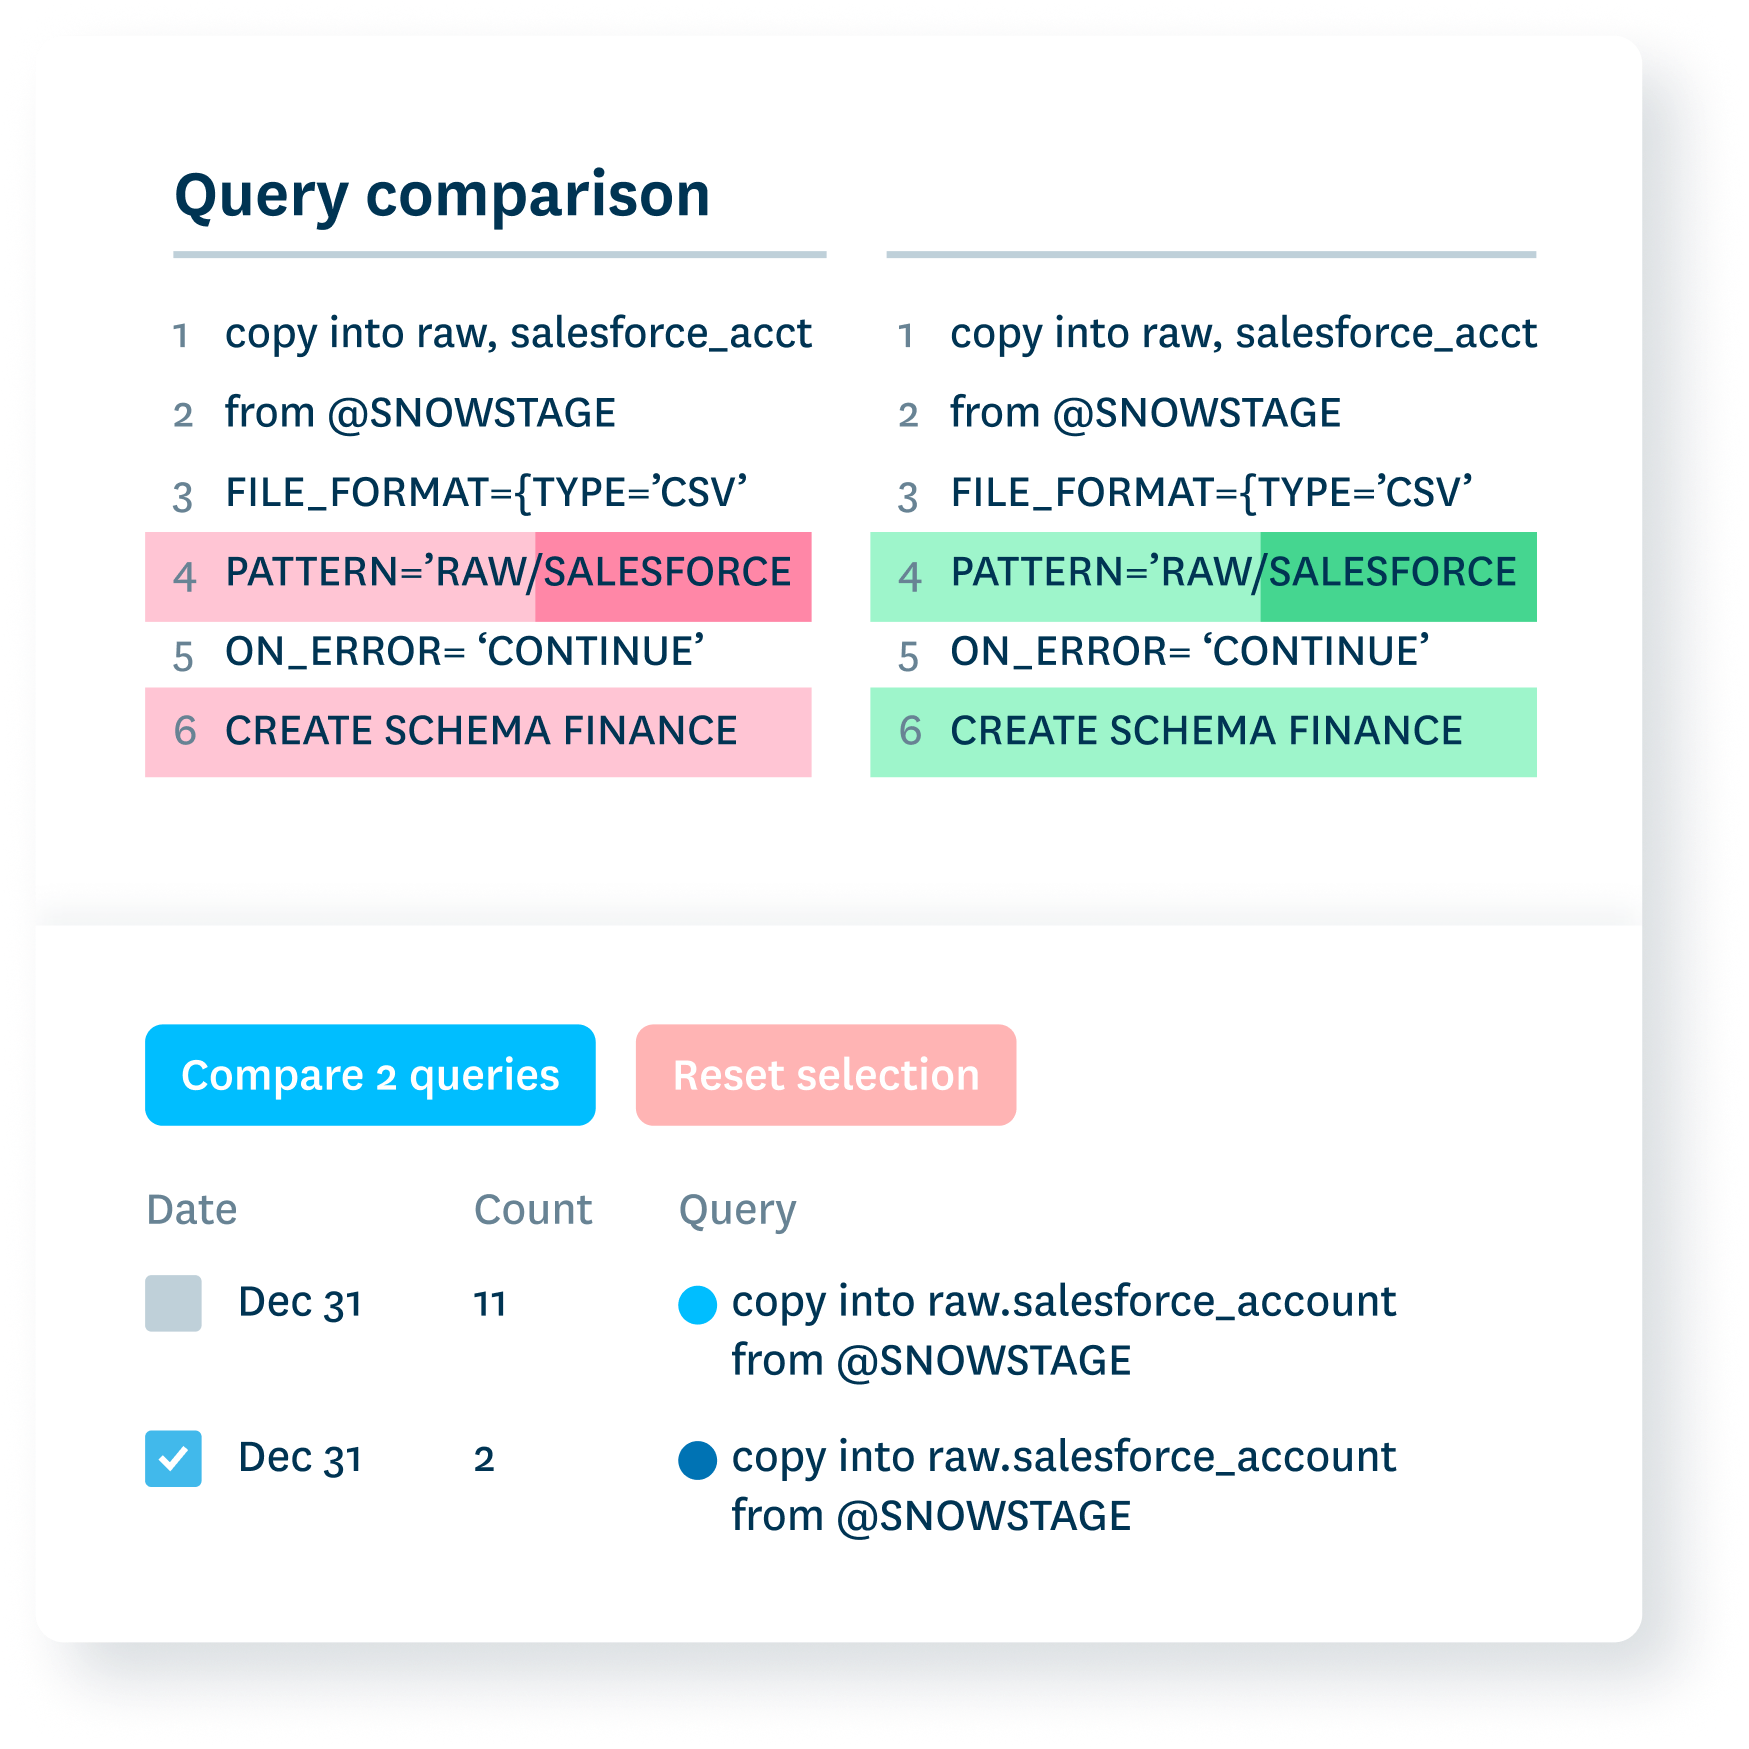
Trace to the source
Industry-leading data lineage fully integrated with data anomaly detection.
- See how data flows across your tables with an intuitive bi-directional UI.
- Get cross-system lineage across transactional databases, analytical platforms, Kafka topics, vector databases, and more.
- View the dbt models, Airflow DAGs, and Databricks workflows are populating your tables.
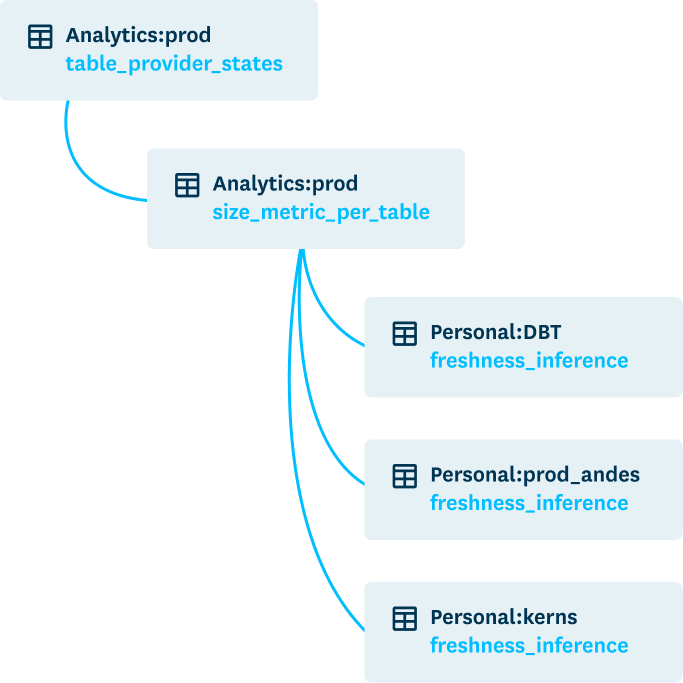
Prevent issues
Reduce data downtime by preventing issues from occurring in the first place.
- Stop bad data from landing with circuit breakers.
- Detect and remediate long-running queries with the potential to create orchestration issues.
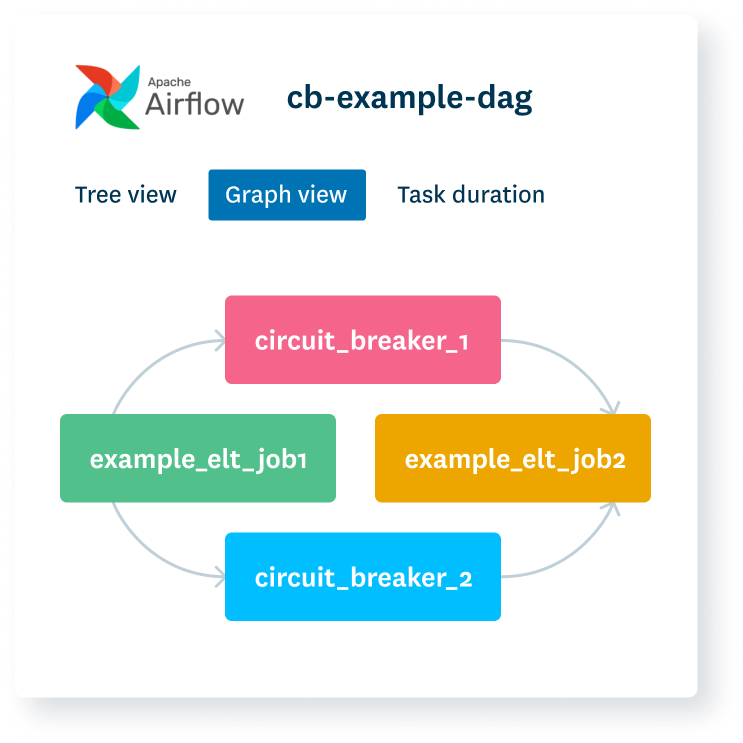
Improve over time
Data observability that improves with use.
- Learn from the past with rich incident history and documentation.
- Generate suggested queries for troubleshooting based on past investigations.
- Monitors adjust based on feedback and status updates.

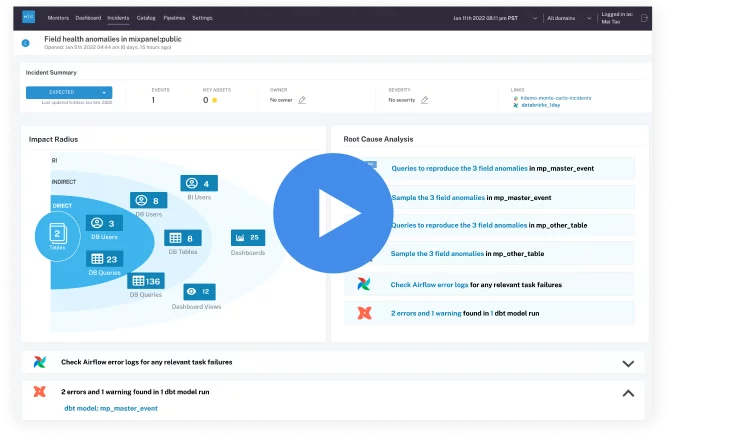 Product demo.
 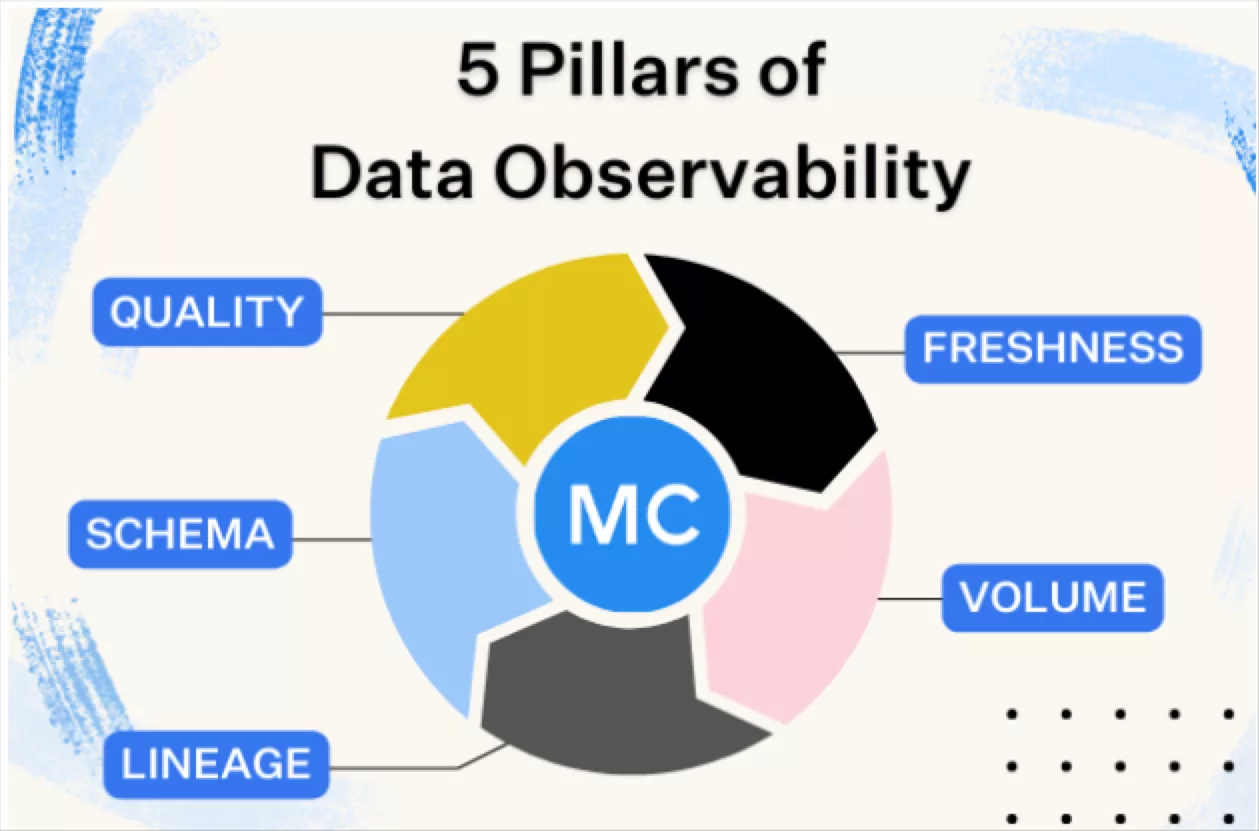 What is data observability?
 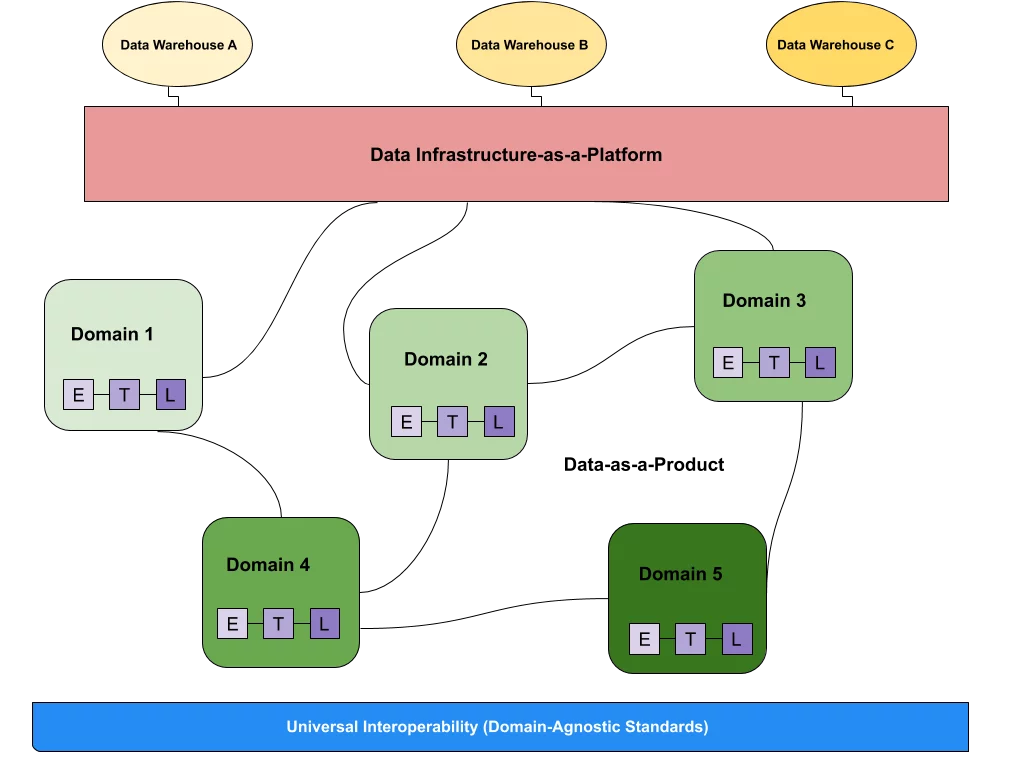 What is a data mesh--and how not to mesh it up
 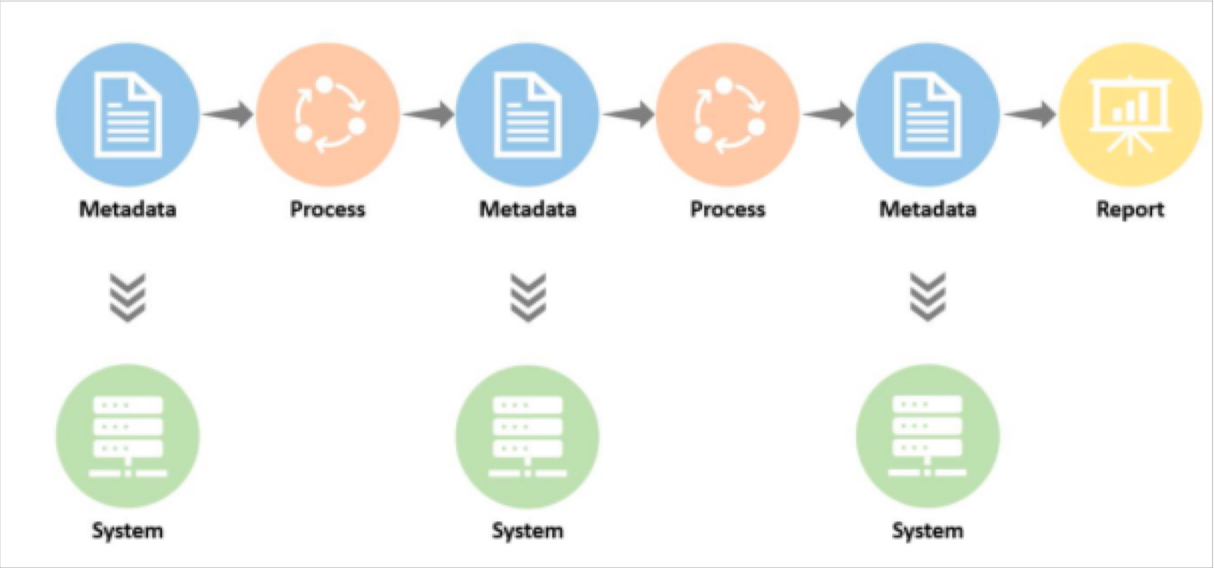 The ULTIMATE Guide To Data Lineage


