Product demo.
  What is data observability?
  What is a data mesh--and how not to mesh it up
  The ULTIMATE Guide To Data Lineage
 Understanding the Data Quality Maturity Curve: What Does Your Data Quality Really Need?

Noel Gomez
Noel is the co-founder of DataCoves, an enterprise platform for dbt management.

Tim Osborn
Tim is a content creator at Monte Carlo who writes about data quality, technology, and snacks—occasionally in that order.
Did you ever hear about the baby that ran the marathon?
Nope, me either.
Data quality is important—no doubt about it. Bad data destroys trust in both the data products and the teams that produce them. And it seems like the industry is finally starting to take notice.
But as data quality finally takes its rightful seat at the platform table, where should new data teams start? Great Expectations? dbt tests? Data Observability?
Like any new endeavor, developing a scalable data quality strategy doesn’t happen overnight. We grow into it. Selecting the right data quality solution isn’t about developing the ultimate strategy for forever—it’s about developing the right strategy for right now.
In this piece, we examine the Data Quality Maturity Curve—a representation of how data quality works itself out at different stages of your organizational and analytical maturity—to offer some experienced perspective on where you should be at each point in your data quality journey.
Table of Contents
What is data quality?
Before we can really understand the tooling equation, it’s important to know what we’re solving for. So, what is data quality exactly?
Data quality is defined by how accurate, reliable, complete, discoverable, trustworthy and actionable a specific dataset is for a given use-case.
The fundamentals of data quality necessitate that:
- The data is current, accurate, and complete.
- The data is unique and free from duplicates.
- The model is sound and represents reality.
- And the transformed data is free from anomalies.
Data quality can be impacted by all sorts of events and errors within a pipeline or ingestion source—from distribution anomalies caused by a keying error to the natural entropy that exists within a complex data system. Some of those errors might be human in nature, while others are just the natural byproduct of dealing with complex data systems.
Errors can be human, technical, or a mix of both.
Choose a comprehensive data quality solution
When it comes to data quality, there are a lot of things you could do. The challenge for your data team is determining the things you should do to deliver a solution that provides adequate data quality coverage—when and where you need it—without boiling the ocean or spending far more than you need.
Ultimately, investing in data quality is about finding the right level of sophistication to realize the maximum value given your resources.
As you can probably guess, the less data quality coverage you need, the easier that’s going to be. But the more your pipelines, your platform, your team, and your organizational data quality maturity grow, the more your quality needs will grow right along with them. The more complex your data ecosystem becomes, the more challenging it will be to maintain data quality thresholds without dramatically impacting your team’s engineering resources.
A couple of things to note:
- Data quality processes don’t deliver new value to your stakeholders—they ensure the value of data products that already exist.
- Data quality isn’t a set it and forget it activity, so for a data quality solution to be a value-add, it needs to be easily maintained with existing resources.
So, what makes a “comprehensive data quality solution”? A comprehensive data quality monitoring solution will cover each of the following needs:
Detection – Tests that will check for null values, schema issues, freshness, volume and more to stop bad data early on.
Alerting – When tests fail, an Alert Protocol will notify the appropriate people to address the issue.
Lineage – This will allow you to visualize the flow of data dependencies and simplify root cause analysis and remediation.
Now that we understand what we’re looking for, let’s review the data quality maturity curve.
The Data Quality Maturity Curve
As stakeholders clamor for more and more data, it’s easy to secure investments for new pipelines, better discovery tools, and new ways of manipulating and visualizing the data. But all that investment will be for naught if we don’t equally invest in the right data quality coverage to deliver the projected ROI.
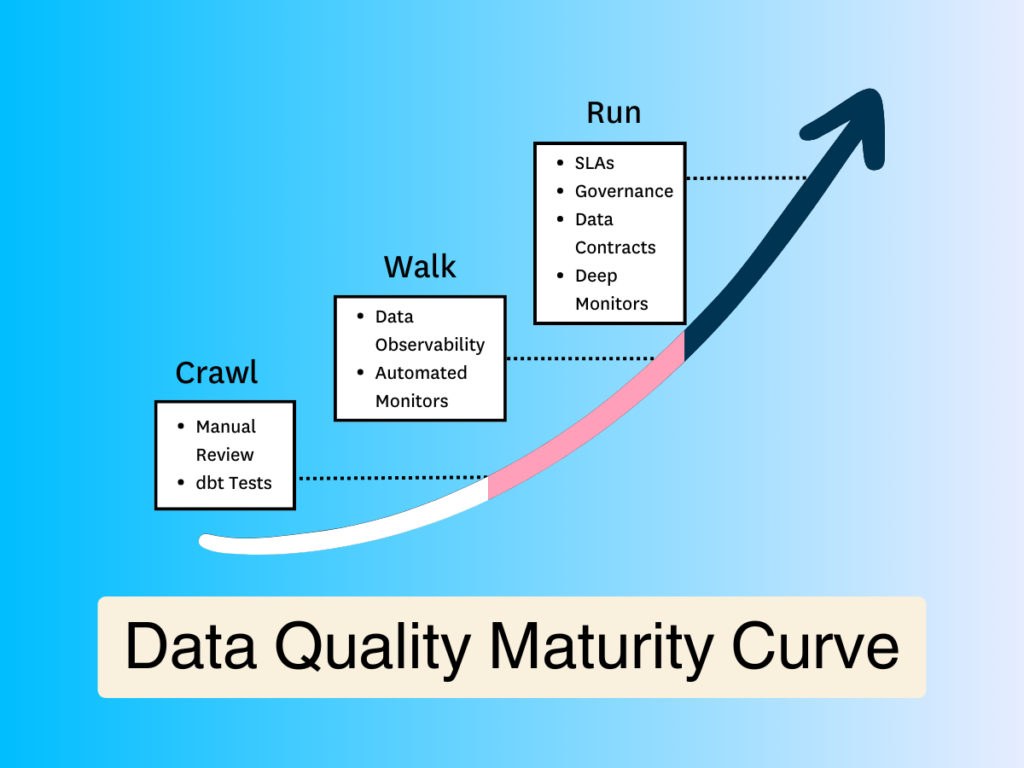
You can think of the data quality maturity curve in terms of the “crawl, walk, run” mentality. You can’t run before you crawl. It’s natural that you won’t have the resources to do everything at once—and you don’t need to. Over time, you’ll become more sophisticated. Your data will grow. Your platform will expand. Your team will mature. And as you avail yourself of new resources and use cases to meet your growing data needs, your data quality system will need to grow alongside that added complexity.
This framework will help you understand where you’re at—and where you should be—in your data quality journey relative to the growth stage of both your organizational maturity and your platform.
Important disclaimers:
- The below numbers are just guidelines and might vary based on the organization’s specific context, industry, and data maturity.
- Even with a smaller number of tables or columns, if the complexity or criticality of the data is high, an organization might opt to implement advanced practices earlier.
- The quality of data is not just about volume; it’s about how critical that data is to the organization’s operations, decisions, and strategy. Hence, always consider the business context alongside these numbers.
- Maturity Stages aren’t necessarily aligned to the size of a data team. Small teams can benefit from data observability. Often even more than larger teams. This is because small teams have limited time resources to spend and having automation and observability will expedite the tedious process for them.
So what does it mean to crawl, walk, and run when we talk about data quality maturity?
Let’s jump into it.
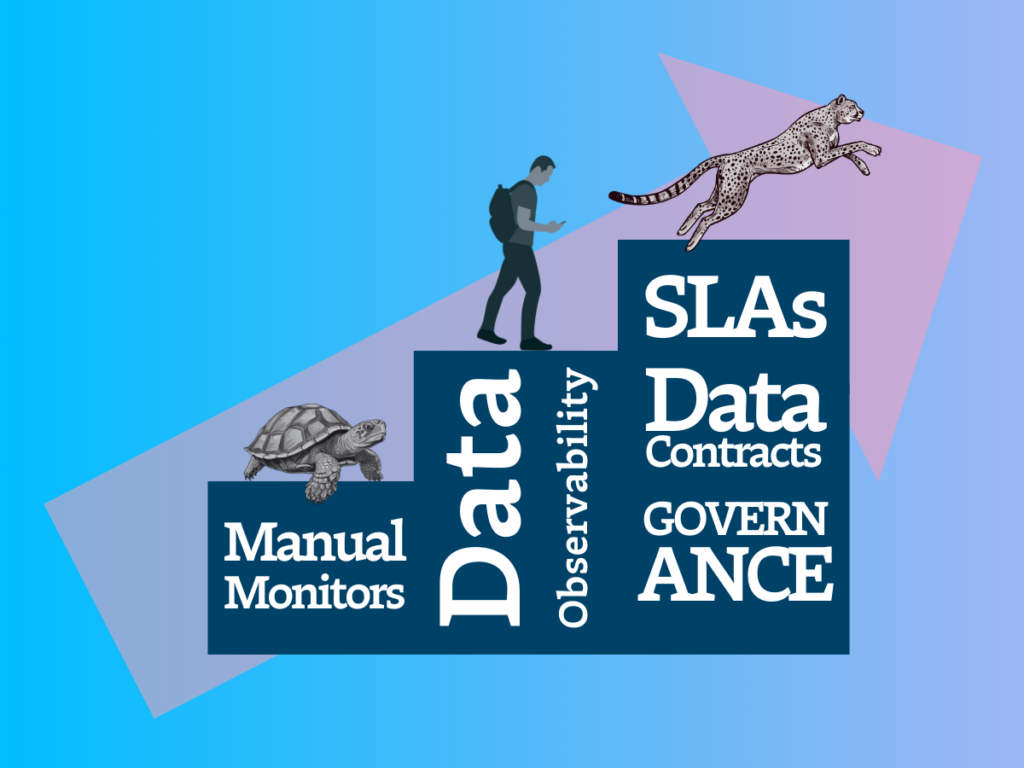
Crawling with data quality—manual monitors and dbt tests
Imagine you want to get into hiking, but up to this point, you’ve never even walked around the block. What do you do? Spend $10,000 at REI, and book a flight to Mt. Everest?
Probably not.
More practically, you drive down to your local park and try to walk a mile without passing out.
The same is true for your data quality practice.
When you’re just getting started on your data quality maturity journey, it’s unlikely you’re going to need an ultra-sophisticated data quality solution. If your data volumes and variety are relatively small, and data use-cases are limited, you can likely survive by just manually inspecting the data or adding a few dbt tests.
Below is a breakdown of what that might look like.
Manual Inspection:
- Tables: 1-10
- Columns per Table: 1-30
- Rows: Up to several thousand rows per table.
With a limited dataset, data teams can manually inspect tables and columns by simply scanning the data to identify inconsistencies, missing values, and a variety of other data quality issues. Unfortunately, this strategy will quickly become unmanageable as your data ecosystem grows and you continue to rely on human efficiency to effectively monitor what’s likely to become thousands of rows pretty quickly. For this reason, you’ll want to start doing some form of simple testing as soon as you can.
Another issue when not leveraging tools like dbt as soon as possible is the lack of table-level data lineage. This can make it difficult to pinpoint the root cause of data quality issues.
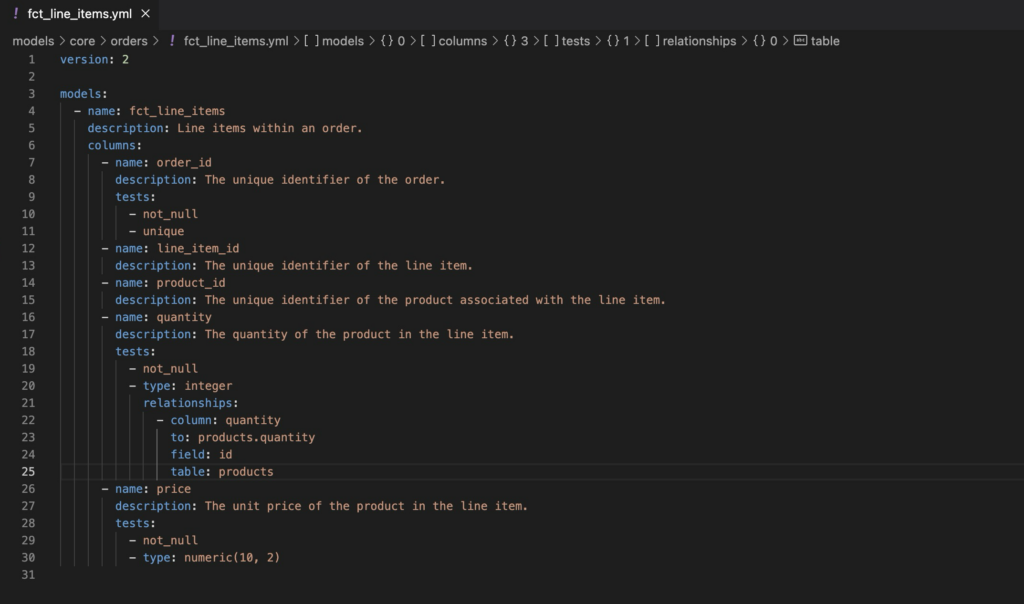
Transition to dbt:
- Tables: 10-50
- Columns per Table: 30-50
- Rows: Hundreds of thousands to a few million rows in total across all tables.
As your datasets start to grow beyond what can be manually inspected, there’s a transition to using dbt for more structured data testing. Column-level tests are manually added to validate data integrity and ensure specific data quality standards. With dbt you will also have table level lineage and you can start to capture documentation—which is a good habit to get into regardless of where you’re at on your data quality maturity journey.
The obvious limitation here is scalability.
As your data grows in size and complexity, you’ll quickly find yourself facing new data quality issues—and needing new capabilities to solve them.
This can manifest itself in:
- An increase in the number of data quality incidents
- Data sources exceeding hundreds of tables
- Reaching hundreds of data transformations
The resources required to perform comprehensive data quality testing when you have five dbt models and a couple hundred columns is a lot different that what you’ll need when you have a few hundred dbt models and thousands of columns. When you combine that with the additional run-time required, the costs of crawling will quickly outweigh the benefits.
A key capability that’s lacking at this stage is column-level lineage. As complexity grows, having visibility into which fields (or columns) are being used in a given table allows you to focus your data quality efforts in the right places and expedite your incident resolution when a quality issue is inevitably detected.
Another aspect of this setup is long term maintenance. As your data platform grows, you’ll need to manually maintain your existing checks at the same time you’re adding new ones. At some point—probably much sooner than later—you’ll start to feel the weight of all that maintenance. This is because manual data quality monitoring is unscalable by design. It fills the gaps until you’re ready for a managed solution, but eventually you’ll have to go back to the watering hole.
When you’re at this level, it’s time to start walking.
Walking with data quality—data observability
Crawling is your first venture into data quality, but walking is where you start building for the future.
In the same way that walking is the foundation of running, the second stage of your data quality journey is all about scalability. And this is where automation comes into play in a big way.
As the number of tables and columns grows, and the volume of data increases, manual methods become less efficient. And as the diversity of data and its sources evolves, you’ll need better tooling to keep up.
Here’s what that might look like:
- Tables: 50-200
- Columns per Table: 50-200
- Rows: Several million to a billion rows in total.
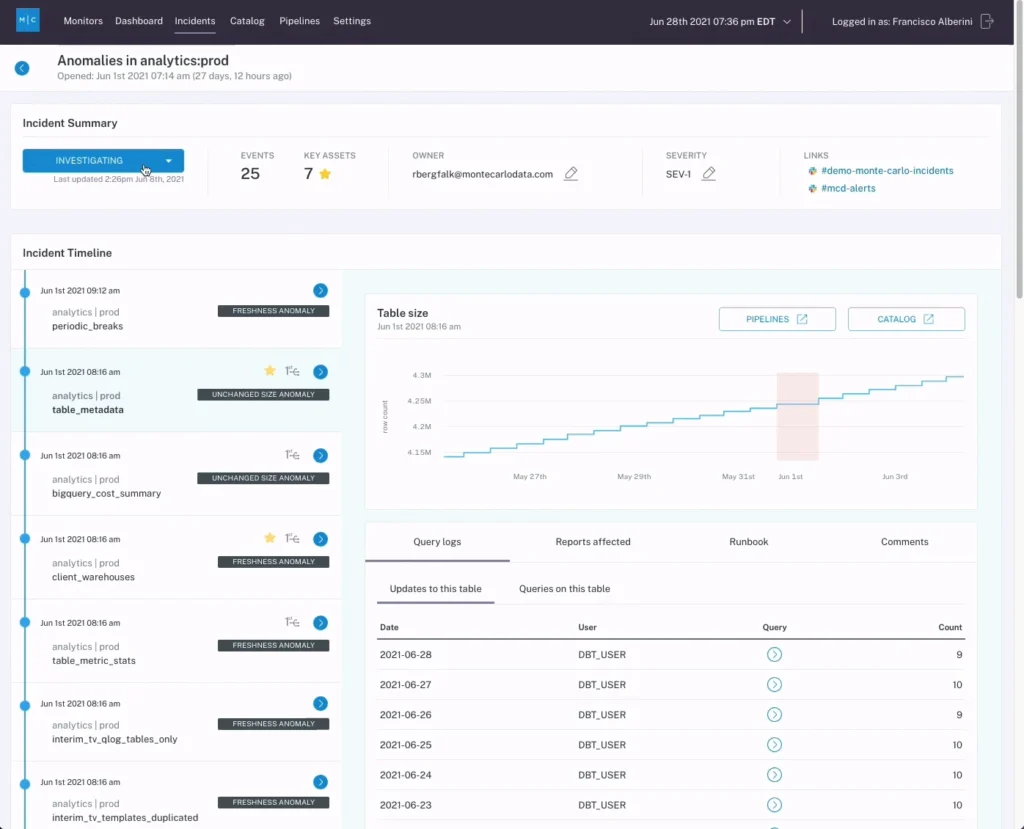
At this point, scale and operational efficiency is the priority for your data quality. In order to ensure you continue to feed fresh, reliable, and accurate data into your pipelines, you’ll need an automated end-to-end solution to scale your data quality across your growing data environment. And this is where data observability solutions like Monte Carlo come into play.
Let’s look at some of the key benefits of data observability and how it helps teams take their data quality from crawling to walking with confidence.
Automation
Automation is truly the secret sauce for scaling data quality. Unlike the varying degrees of manual monitoring we looked at in the previous section, data observability solution Monte Carlo provides automated detection and alerting for data anomalies right out of the box, including automatic thresholding based on metadata and the ability to quickly create deep monitors for known issues and critical SLAs. This means that as your data engineers can programmatically scale data quality in tandem with the scale of their pipelines.
It also means that as your platforms become increasingly complex, your data quality will expand to meet the needs of your evolving platform layers.
A good data observability solution will also include automation for another critical element that was lacking in the crawl phase: column-level lineage.
Column-level lineage
One of the most critical components to efficient root cause analysis and incident resolution is column-level lineage. Column-level lineage (sometimes called “field-level lineage”) maps the dependencies between data sets and tables across data products to understand visually how data moves through your pipelines.
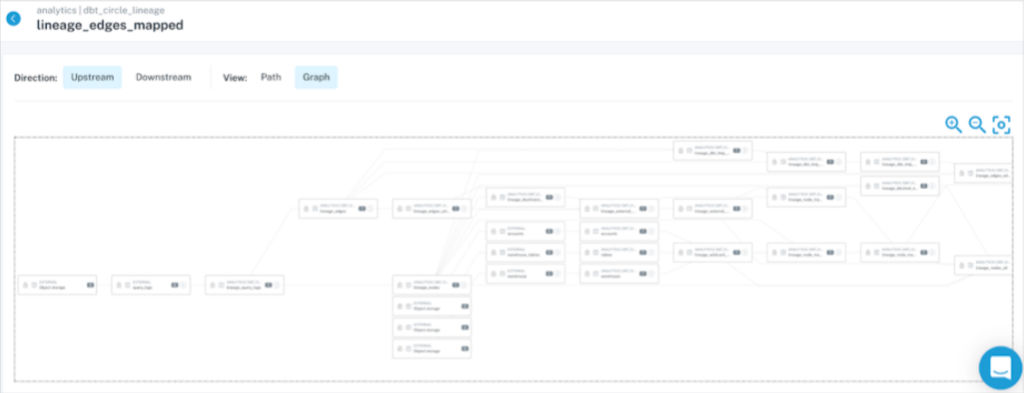
While this is important for understanding your data products at a structural level, it also enables data teams to trace incidents and anomalies back to a source much more efficiently. Without column-level lineage, data teams will spend hours or even days root causing a data quality issue before they have the chance to remediate and resolve it. Over the course of a year, that can add up to hundreds of thousands or even millions of dollars in lost productivity.
A good data observability solution will provide this level of dependency mapping right out of the box.
End-to-end integrations across your data platform
The other key benefit of a data observability solution is extensibility. Because data observability is a tool designed specifically to monitor and maintain data quality, it’s often highly flexible in its application.
Good data observability solutions like Monte Carlo offer integrations across critical platform layers like dbt, storage and compute platforms, and even CI/CD solutions like Github that make it easy to quickly add comprehensive data quality coverage across your entire end-to-end environment.
Planning for the future with Data Observability
While data observability is a relatively recent addition to the data stack, it’s quickly becoming one of the most indispensable tools for high performing data teams to maintain the integrity and reliability of their data.
Data will only continue to grow as organizations realize—and capitalize—on the value of their data for business use cases. As you develop your data environment—and by extension your data quality motion—you need to establish a system that provides both fast time-to-value at current scale and enables faster and more reliable scale in the future.
Because data observability solutions like Monte Carlo provide automated monitoring and lineage out of the box, you have guaranteed quality coverage as soon as new data pipelines come online.
Of course, manual testing doesn’t completely disappear. Those skills you built in stage one will continue to be useful, but in a more efficient and scalable process. As your data continues to grow and you approach the “Run” stage of the Data Maturity Curve, you will be happy to see that you are already set up for a smooth transition.
Running with data quality—contracts, governance, SLAs and more
So you’ve mastered manual testing. You’ve implemented automation through observability to efficiently scale your data quality coverage. Now it’s time to turn your attention outward.
As your data platform grows, your stakeholders and domain partners undoubtedly will too. This creates new challenges in and of itself. So, once you’ve optimized your team’s own data quality practice, the next step is to optimize how your team coordinates cross functionally with stakeholders and partners outside your team.
While increased scale could initiate the run phase of your data quality maturity journey, that’s not always the case. In fact, many of the practices in the run phase of your journey are actually fantastic ways to supercharge your data reliability and its usability once you have scalable quality coverage in place. The important thing is nailing data quality coverage and incident resolution first.
So, how do you run?
Running with your data quality motion involves improving both discoverability and accountability—in addition to the explicit quality of your data. And that’s accomplished in several important ways.
Developing SLAs
Once you know how to monitor your data—and you have an understanding of what to monitor—you can improve institutional trust in your data products by setting standardized SLAs.
Service-level agreements (SLAs) are a method many companies use to define and measure the level of service a given vendor, product, or internal team will deliver—and the solutions if they fail.
In a data reliability context, this gives your data team benchmarks to grade against and tells your expanding stakeholders and downstream data consumers what to reasonably expect from their critical data products.
The more your stakeholders and data products grow—and the more integral those products become to business success—the more essential defining SLAs will become.
Deep Monitoring
At scale, you need a baseline level of data quality coverage across your entire platform. However, as you begin to work more closely with your stakeholders and identify which tables and data products are the most critical for downstream consumers, you’re likely to identify some tables that require an extra level of attention.
The more important a table is, and the more clearly defined its expectations, the more defined your deep monitoring strategy will become. One example here would be a user-defined monitor that triggers an alert when data fails a specific logic like percent of null values or acceptable string patterns.
Data Governance
As organizations seek to democratize access to data assets, keeping data safe and standardized becomes a new mountain for data teams to climb. And with access also comes the need for external teams to understand and effectively discover those data assets.
Proper data governance including metadata management and data cataloging becomes essential to maintaining and activating the vast amounts of data you’re likely to have as your environment grows. In an ideal world, you’ll be doing some of this already through dbt documentation, but developing a formalized process and educating your data team and domain leaders will become essential to maintaining governance standards for the long haul.
Data Contracts
At this advanced stage, data sprawls across various systems, platforms, and sources—and this can result in all kinds of headaches for the data team not managed correctly.
Let’s say for example, production data from a transactional database lands in the data warehouse and becomes part of a different downstream process. The software engineers in charge of that system aren’t aware of any data dependencies outside their system, so when they make an update to their service that results in a schema change, the tightly coupled data systems crash.
Ensuring that teams are aligned in terms of how they use and extract data becomes critical to maintaining the integrity of your data platform and its products. Data contracts are a system of process and tooling that help data producers and data consumers stay on the same page as your platform evolves.
Data contracts might cover:
- What data is being extracted
- Ingestion type and frequency
- Details of data ownership/ingestion, whether individual or team
- Levels of data access required
- Information relating to security and governance (e.g. anonymization)
- How it impacts any system(s) that ingestion might impact
Final Thoughts
Now that you’ve got the map to data quality, it’s time to take the first step. However…like most things in the data industry, navigating the Data Quality Maturity Curve isn’t always a straight path.
From team size and data complexity to good old fashioned business needs, all kinds of external factors can influence the way you approach your organization’s Data Quality Maturity Curve—and how quickly you want or need to progress. While your own journey might take some different twists and turns, we hope this article can serve as a useful guide along the way.
The important thing is to make sure that you have the appropriate quality coverage for your pipelines—when, where, and how you need it.
Whether you’re in the ‘crawl’ stage with manual dbt tests or ‘running’ with full-fledged data governance, each step will become important in due time. It’s not about sprinting to the finish line but strategically advancing from one stage to the next.
So, as we ensure data quality, remember: it’s a marathon, not a sprint—and every stage has its own finish line worth reaching.
Our promise: we will show you the product.
Read more posts.