 Product demo.
  What is data observability?
  What is a data mesh--and how not to mesh it up
  The ULTIMATE Guide To Data Lineage
 8 Data Quality Issues and How to Solve Them

Tim Osborn
Tim is a content creator at Monte Carlo who writes about data quality, technology, and snacks—occasionally in that order.
Your data will never be perfect. But it could be a whole heck of a lot better.
From the hundreds of hours we’ve spent talking to customers, it’s clear that data quality issues are some of the most pernicious challenges facing modern data teams. In fact, according to Gartner, data quality issues cost organizations an average of $12.9 million per year.
From business intelligence to machine learning, reliable data is the lifeblood of your data products. (That goes double for generative AI.) Bad data in—bad data products out.
And that puts data quality at the top of every CTO’s priority list.
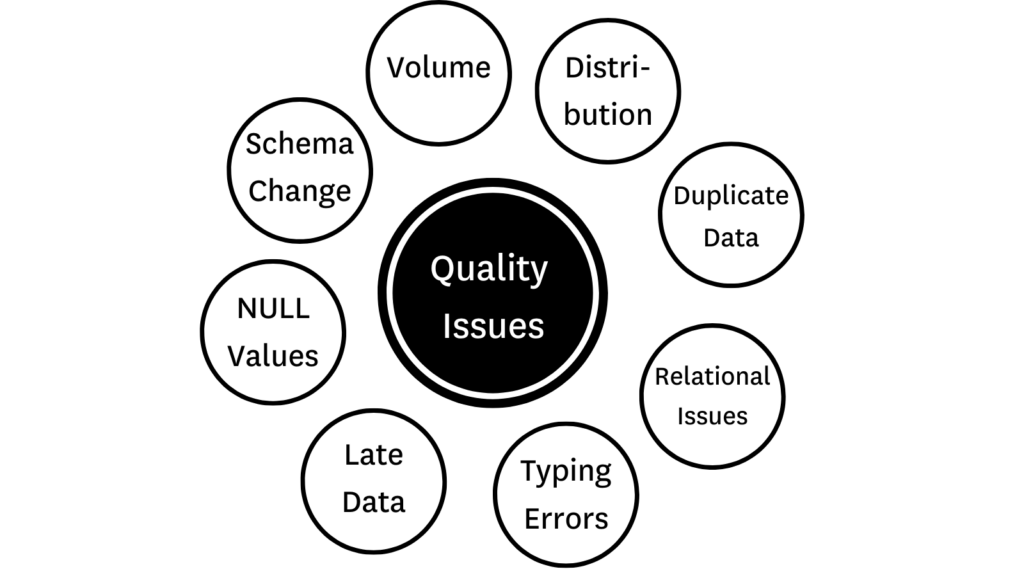
In this post, we’ll look at 8 of the most common data quality issues affecting data pipelines, how they happen, and what you can do to find and resolve them. We’ll look at:
- NULL values
- Schema change
- Volume issues
- Distribution errors
- Duplicate data
- Relational issues
- Typing errors
- Late data
- How to prioritize data quality issues
Ready? Let’s dive in!
So, what are data quality issues?
Whether by human error or entropy (or the implacable forces of nature), data quality issues happen. Like all software and data applications, ETL/ELT systems are prone to failure from time-to-time.
As your data moves through your production pipelines, it meets near-countless opportunities for the quality of that data to be compromised. Data quality issues arise any time data is missing, broken, or otherwise erroneous based on the normal function of a given pipeline; and these data quality issues can arise at ingestion, in the warehouse, at transformation, and everywhere in between.
Or the transformed data is impacted by anomalies at any point during production.Among other factors, data is considered low quality if:
- The data is stale, inaccurate, duplicative, or incomplete.
- The model fails to reflect reality.
- Or the transformed data is impacted by anomalies at any point during production.
As we alluded to previously, there’s no one single culprit of data quality issues. Data quality can be impacted by everything from software changes at the source all the way down to how an SDR inputs a country code. And just as important as discovering what the issue might be is discovering where it started. (Check out this article on data lineage to understand how relational maps can help you root cause and remediate data issues faster.)
So, with the basics out of the way, let’s look at some of those data quality issues in a bit more detail.
NULL values
One of the most common data quality issues will arise from missing data, also known as NULL values. (Oh, those pesky NULL values).
NULL values occur when a field is left blank either intentionally or through a pipeline error owing to something like an API outage.
Let’s say you were querying the impact of a marketing program on sales lift by region, but the ‘region’ field was left blank on multiple records. Any rows where ‘region’ was missing would necessarily be excluded from your report, leading to inefficient future spend on regional marketing programs. Not cool.
The best way to solve for NULL values is with a NULL value test like dbt’s not_null test to validate whether values within a specified column of a model are missing after the model runs.
tests/test_not_null.sql

—----------------------

{% test not_null(model, column_name) %}

    select *

    from {{ model }}

    where {{ column_name }} is null

{% endtest %}
This generic test takes a model and column name, and fails whenever values from that column are NULL after the model runs. Source: dbt documentation.
Schema Changes
Probably the second most common data quality issue after NULL values is a broken pipeline caused by an upstream schema change.
Look, schema changes happen all the time. New features are developed. Software is updated. Data structures get re-evaluated. Sometimes a schema change is no big deal. The data team will know about the change ahead of time, and they’ll be ready to monitor it and adjust course if necessary.
However, sometimes the data team won’t know about it. And sometimes those schema changes are actually a very big deal.
Imagine your finance team is working on a revenue report for your board of directors. A couple days before they pull their report, one of your engineers pushes a code change to production that deletes a critical revenue column from a key table. That change might cause finance to under-report on revenue, impacting budgets, hiring, and everything in between.
It’s times like these that a schema change can wreak all kinds of havoc on your pipelines.
Detecting data quality issues caused by schema changes isn’t quite as cut and dry as a NULL value test. And resolution and prevention is another story entirely. The right mix of data quality checks, lineage mapping, and internal process is the key to detecting, resolving, and preventing the downstream impact of bad schema changes.
Check out this piece on overcoming schema changes to learn more.
Volume issues
How much data is entering your pipelines? Is it more than expected? Less? When these numbers fall outside your expected range, it’s considered a volume issue. And incorrect data volumes can do all kinds of funky things to your data products.
Let’s look at some of the ways your volume can be incorrect.
Too little data
When data goes missing from your pipelines, it can quickly skew—or even break—a data model. Let’s say your data platform processes data from temperature sensors, and one of those sensors fails. What happens? You may get a bunch of crazy temperature values—or you may get nothing at all.
Too much data
Too much data might not sound like a problem (it is called big data afterall), but when rows populate out of proportion, it can slow model performance and increase compute costs. Monitoring data volume increases can help reduce costs and maintain the integrity of models by leveraging only clean high quality data that will drive impact for downstream users.
Volume tests
It’s important to identify data volume changes as quickly as possible. Volume tests identify when data volumes have changed due to either too much or too little data to uncover compromised models and validate the accuracy of your data.
In basic terms, volume tests validate the number of rows contained in critical tables. To get the most out of your volume tests, it’s important to tie your tests to a volume SLA (service-level agreement).
SLIs (service-level indicators) are the metrics we use to measure performance against a given SLA. Volume tests can be used to measure SLIs by monitoring either table size or table growth relative to previous measurements.
For example, if you were measuring absolute table size, you could trigger an event when:
- The current total size (bytes or rows) decreases to a specific volume
- The current total size remains the same for a specific amount of time
Distribution errors
The distribution of our data tells us whether our data reflects reality. So, whenever data skews outside an acceptable range, it’s considered to be a distribution error.
For example, if you’re a credit company who’s collecting and processing credit scores between 0 and 850 and you get a score that’s 2000, you know you have a distribution error. And a pretty serious one at that.
A data quality issue like this could simply be a sign of a few anomalous data points or it could indicate a more serious underlying issue at the data source.
Here’s a couple distribution errors to look out for:
Inaccurate data
When data is incorrectly represented, inaccurate data is injected into production pipelines. Inaccurate data could be as simple as an SDR adding an extra zero to a revenue number or a doctor incorrectly typing a patient’s weight.
Industries with strict regulatory needs, like healthcare and finance, should pay particular attention to these data quality issues.
Data variety
Just because a data point falls outside a normal distribution doesn’t necessarily mean it’s anomalous. It could be that it’s an early indicator of a new trend that hasn’t fully manifested in the data.
However, it’s more likely that it’s an anomalous data point that will spell bigger issues down the road. When it comes to data variety, it’s a data quality issue that we’ll want to keep an eye on.
Distribution tests
Writing a distribution test in SQL that defines minimums and maximums for a given column will help you determine if a given table is representative of a normally distributed population.
dbt’s accepted_values test is an out-of-the-box test that allows the creator to define a range of acceptable distribution values for a given column.
Great Expectations’ “unit tests” can also be adapted to monitor minimums and maximums like the zip_code test in the example below.
expect_column_values_to_be_between(

    column="zip_code",

    min_value=1,

    max_value=99999

)
Duplicate data
Another common data quality issue haunting your data pipelines is the specter of duplicate data. Duplicate data is any data record that’s been copied and shared into another data record in your database.
From spamming leads to needlessly driving up database costs, duplicate data has the power to damage everything from your reputation to your bottom line.
Duplication errors occur most often during data transfers from ingestion to storage, and can occur for a variety of reasons—from loose data aggregation processes to human typing errors.
The best way to monitor and discover duplicate data is with a uniqueness test. Uniqueness tests enable data teams to programmatically identify duplicate records during the normalization process before the data enters your production pipelines.
If you’re leveraging dbt, you can take advantage of their unique test to identify duplicates, but uniqueness tests are also widely available for a variety of tools out-of-the-box depending on what you’ve integrated.
Relational issues
No, not that kind of relational issues. Relational or referential integrity refers to the relationship between tables in a database. A parent-child relationship, also known as a primary and foreign key, connotes the root data that’s joined across tables to create a given model.
So, what happens if that parent data gets changed or deleted? Well, now you’ve got yourself a relational data quality issue.
Orphaned data models can’t produce functional data products. In the same way that removing the foundations of a building would necessarily cause that building to collapse, your data models will fall apart without access to the correct data from its primary key.
Maybe your marketing team is pulling a list of customer IDs together for a new nurture campaign. If those customer IDs don’t map back to the names and email addresses in your database, that nurture campaign is going to be over pretty quickly.
Referential integrity tests (also known as the relationships test in dbt) are a great way to monitor for altered or deleted parent data. Referential integrity ensures that any data reflected in a child table also has a corresponding parent table, and that no changes can be made to a parent or primary key without sharing those same changes across dependent tables.
Typing errors
The most human of data quality issues—typing errors. In a distributed professional landscape, the opportunity for little typing errors to make their way into your pipelines is virtually unlimited.
Maybe a prospect forgot a character in their email address or an analyst changed a row without realizing it. Maybe someone dropped a cheeseburger on their keyboard and added a few extra digits to a social security number. Who knows!
These little inconsistencies may be fairly common, but that makes them all the more important to monitor. It’s important that those records are reconciled early and often to ensure you’re delivering the best possible data to your stakeholders.
A string-searching algorithm like RegEx can be used to validate a variety of common patterns like UUIDs, phone numbers, emails, numbers, escape characters, dates, etc., to ensure each string in a column matches a corresponding pattern—from phone numbers to blood types.
Late data
Whether you’re utilizing batch data or streaming, late data is a problem.
Fresh data paints an accurate real-time picture of its data source. But, when that data stops refreshing on time, it ceases to be useful for downstream users.
And in the great wide world of data quality issues, you can always count on downstream users to notice when their data is late.
In the same way you would write a SQL rule to verify volume SLIs, you can create a SQL rule to verify the freshness of your data based on a normal cadence. In this case, the SLI would be something like “hours since dataset refreshed.”
Monitoring how frequently your data is updated against predefined latency rules is critical for any production pipeline. In addition to manually writing your SQL rules, SQL tests are also available natively within certain ETL tools like the dbt source freshness command.
How to prioritize data quality issues
When it rains data quality issues, it pours. And when the day inevitably comes that you have more data quality issues than time to fire-fight, prioritization becomes the name of the game.
So, how do you prioritize data quality issues? As in all things, it depends. Prioritizing data quality issues requires a deep understanding of the value of your data pipelines and how your data is actually being used across your platform. Some of the factors that can inform your triage practices include:
- What tables were impacted
- How many downstream users were impacted
- How critical the pipeline or table in question is to a given stakeholder
- And when the impacted tables will be needed next
One of the elements required to prioritize data quality issues well is an understanding of the lineage of your data. Knowing where the data came from and where it’s going is critical to understanding not just the potential damage of a data quality issue, but how to root-cause and solve it.
Which brings us neatly to our final point: the value of data observability for detecting, resolving, and preventing data quality issues at scale.
How data observability powers data quality at scale
Now that you’ve got a handle on some of the most common data quality issues, you might be saying to yourself, “that’s a lot of issues to monitor.” And you’d be right.
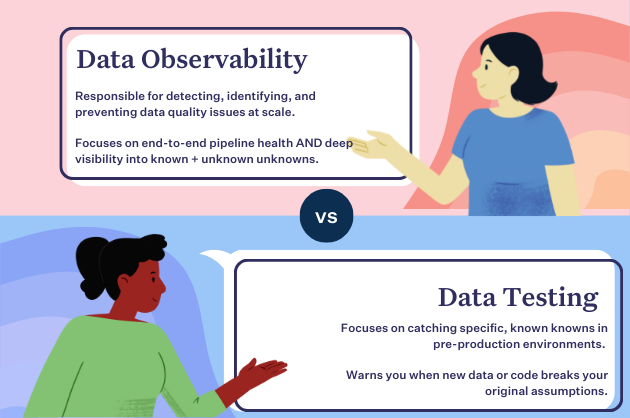
Data reliability is a journey—and data testing is a much shorter leg of that journey than you might think.
Monitoring data quality by hand is easy enough when you’re only writing tests for an organization of 30 with a handful of tables. But imagine how many typing errors, volume issues, and bad schema changes you’ll have when you’re a team of 300 and several hundred tables.
A whole lot more.
Remember, detecting data quality issues is only half the battle. Once you find them, you still need to root-cause and resolve them. In fact, Monte Carlo’s own research found that data engineers spend as much as 40% of their workday firefighting bad data.
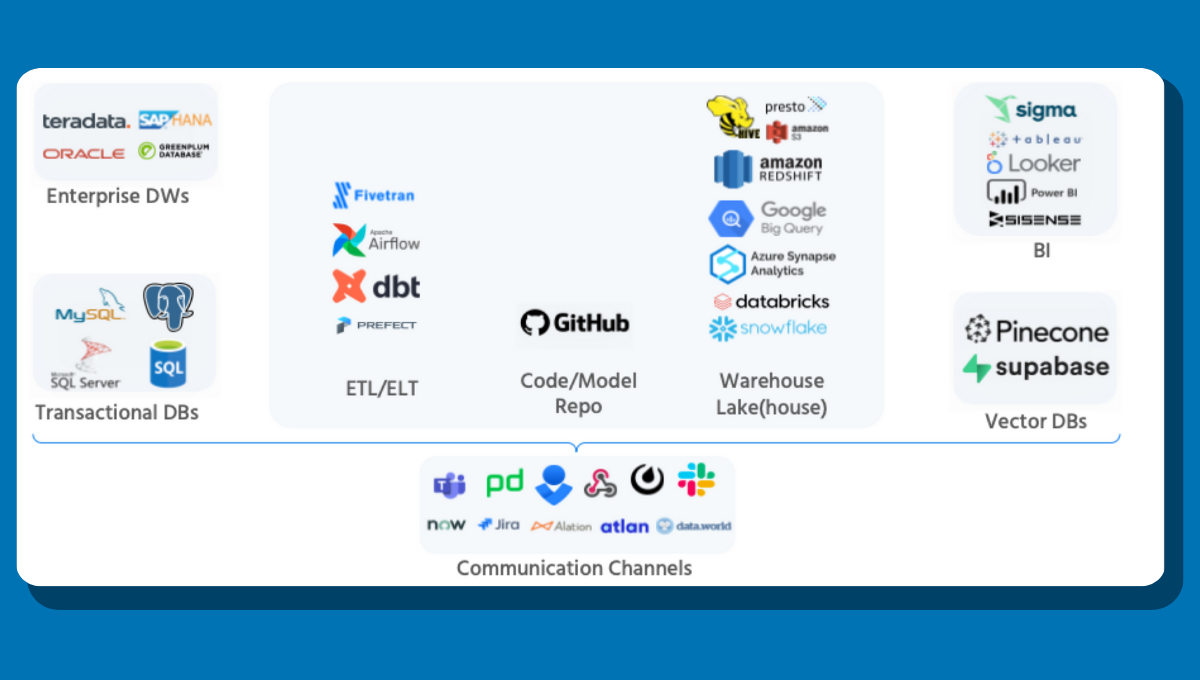
As your data grows, your manual testing program will struggle to keep up. That’s where data observability comes in. Unlike manual query tests, data observability gives data teams comprehensive end-to-end coverage across their entire pipeline—from ingestion right down to their BI tooling.
What’s more, Monte Calro offers automated ML quality checks for some of the most common data quality issues—like freshness, volume, and schema changes—right out of the box.
Delivering high quality data is about more than making sure tables are updated or that your distributions fall into an acceptable range. It’s about building data trust by delivering the most accurate and accessible data possible—whenever and however your stakeholders need it.
Interested in learning more about how Monte Carlo provides end-to-end coverage for the most common data quality issues? Let’s talk!
Read more posts.
![[VIDEO] Introducing Data Downtime: From Firefighting to Winning](https://www.montecarlodata.com/wp-content/uploads/2020/08/My-Post-10.png)