Product demo.
  What is data observability?
  What is a data mesh--and how not to mesh it up
  The ULTIMATE Guide To Data Lineage
 Data Engineers: We Need To Talk About Alert Fatigue

Michael Segner
Michael writes about data engineering, data quality, and data teams.
5 factors that lead to alert fatigue and how to prevent them with incident management best practices
Last Friday afternoon, Pedram Navid, head of data at Dagster and overall data influencer, went to X to ask an important question. He asked:
In terms of whether data engineers love their data quality tools, I’ll let the people speak for themselves, However, there’s a bigger and more prescient question raised here that I do want to address, and that’s this:
“How helpful is anomaly detection without resolution?”
And I couldn’t agree more with Pedram’s implied “not very.”
The idea of alerts becoming overwhelming to the point of creating a numbing paralysis in the receiver is a concept called alert fatigue. The line separating responsive from fatigued is very real and something often seen in the parallel application process monitoring/software engineering space.
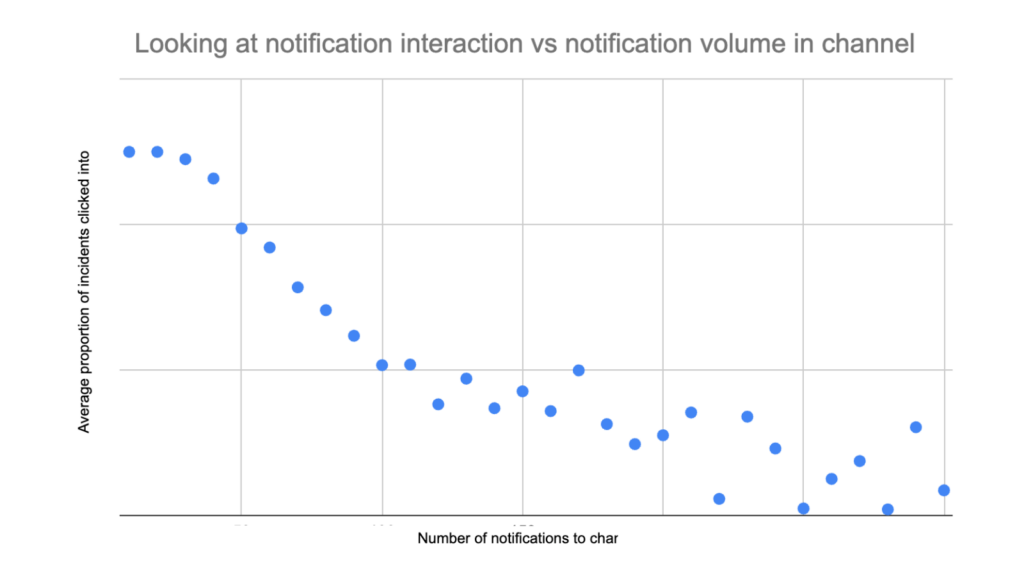
Our own data that we’ve collected across millions of tables and the actions of hundreds of data teams within the Monte Carlo platform shows that line is about 30 to 50 alerts per week, per notification channel (let’s assume that each channel has a mostly different audience).
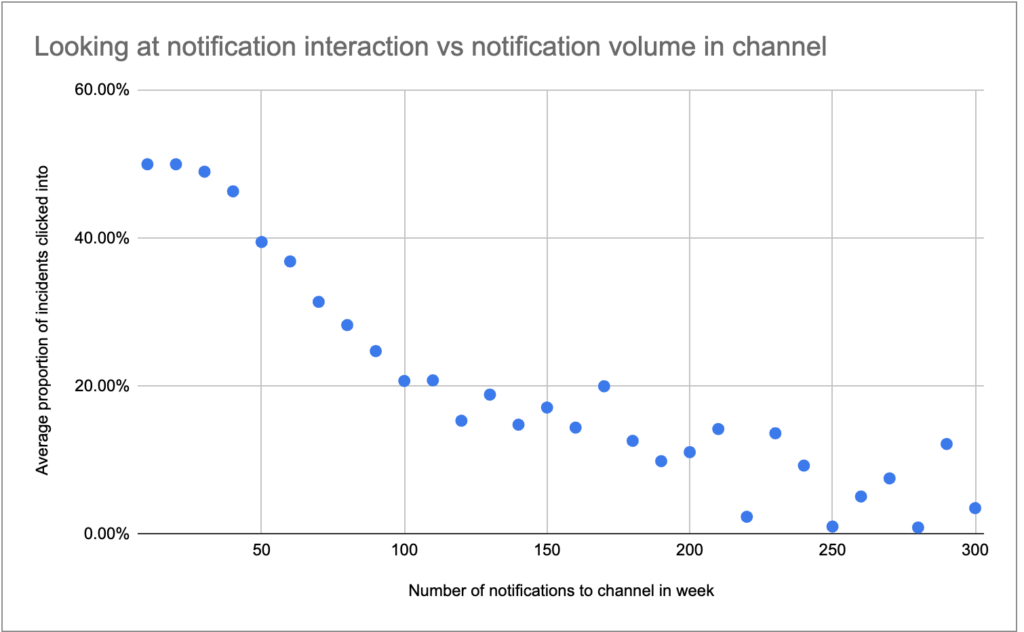
And while alerts seem annoying when they take you out of your workflow, what’s actually annoying is getting pinged by data consumers or put on the hot-seat by the CEO wondering why they can never trust the data. The problem isn’t alerts, it’s getting overwhelmed by them.
In that spirit I’ll share the five factors for alert fatigue as well as best practices for incident management and response so data teams can have their cake and eat it too.. In other words, how they can be the first to know when bad data strikes without drowning in alerts.
Table of Contents
5 Alert Fatigue Factors
The roots of alert fatigue are grounded both in technology as well as operational approaches. Data testing, data quality monitoring, and data observability all handle alerting slightly differently, but none of that matters without some level of thought put into incident management processes.
Static versus dynamic alert thresholds
Absolute alert thresholds are easy enough. For example, a field containing the number of invoices issued can never be negative. But ranges are a little more tough to gauge.
For a column that typically has 30% NULLS, should you set an alert for 35%? 55%? Human beings are not great at setting range thresholds within the goldilocks zone. The result? Static alerts are noisy.
Data quality monitoring and data observability solutions solve this problem with dynamic thresholds and machine learning monitors that understand and set appropriate thresholds given the volatility of specific fields and metrics.
Recall versus precision
Now that being said, there is no such thing as a perfect machine learning model from a mathematical standpoint. If predictions were 100% accurate then we would have taken them to Vegas rather than working at a data observability company.
At the core, mathematically, you have to make a choice in how you build your algorithm. That choice is whether you are designing for precision or for recall. Machine learning monitors designed for precision will be focused around how many of your alerts are accurate while recall will be focused around how many true positives you can catch.
For the longer, way more technical description I encourage you to check out “Data Monitoring At Scale with SQL and Machine Learning” from Ryan Kearns, my colleague and accomplished data scientist. The GIF below is the simple version:

The blue circle represents a ML model designed for precision while the orange represents one design for recall.
Different data quality monitoring or data observability solution providers configure their monitors slightly differently along this precision-recall spectrum. We don’t usually get into this level of detail–we’d rather just tell you that our monitors are the most accurate.
I’m no different, I also believe our monitors are the most accurate, but I also know that they are designed with a bias for precision. When we send an alert we are confident it is anomalous, and very likely to be interesting. Alert fatigue is one of the biggest reasons why we made this decision.
Excessive coverage scope
You miss a lot of important data quality issues with a data testing only strategy. It just doesn’t scale. Data quality monitoring will cover a bit more surface area and data observability even more still.
This is largely a good thing. You want to catch those data quality issues you are missing. But If you are deploying your coverage without a strategy or regard to the architecture of your data platform then you risk noisy alerts.
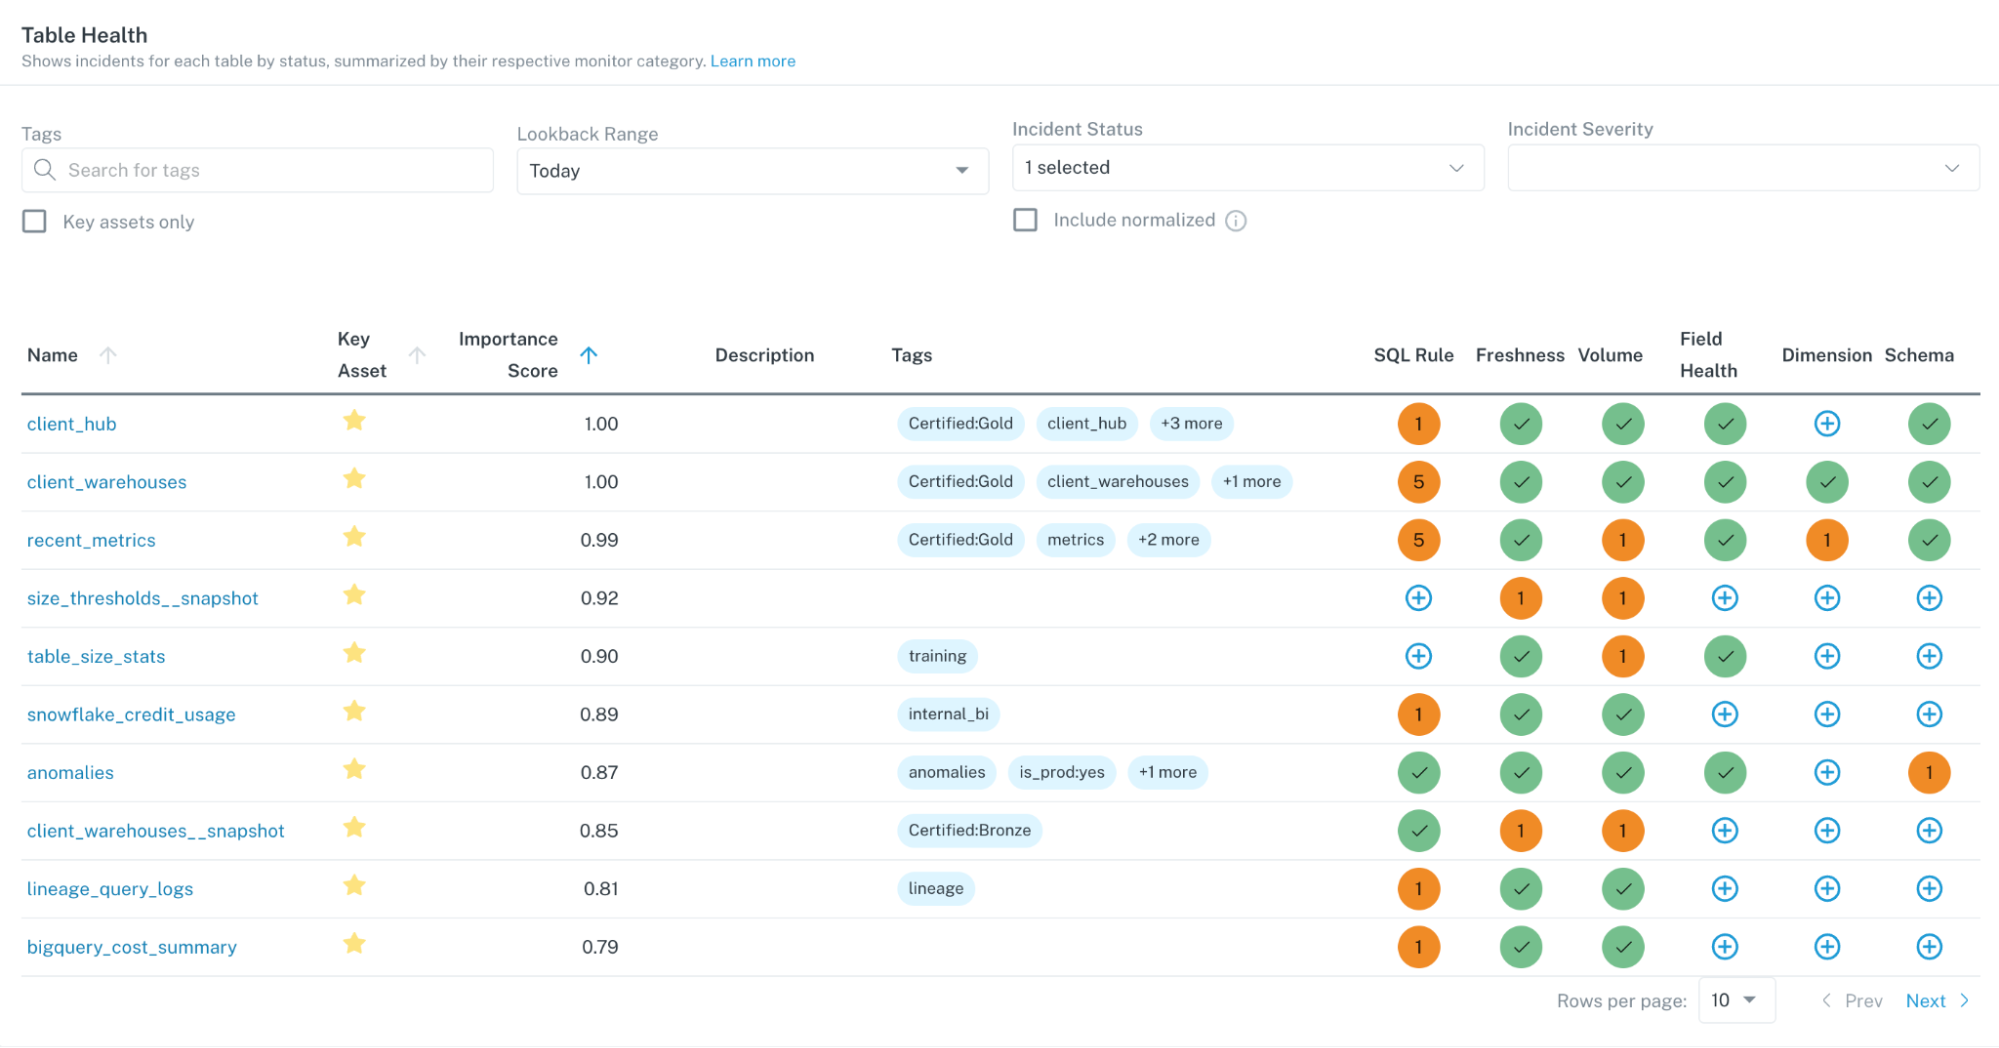
The best practice here is not to cover a random assortment of tables, or even your most important gold tables. While there are some legitimate exceptions, most data teams are successful when they start with their most important data products and cover them end-to-end.
Dead-end alerts
Average time to resolution is one of the most important data quality metrics data teams can track. Not only is it one of the primary data downtime variables, it is a canary in the coalmine when it comes to alert fatigue.
As Pedram implices in his tweet, if the alert isn’t actionable then it’s not useful. Either someone mutes the alert, unsubscribes from the Slack channel, or becomes immune to pings.
This is a learned behavior that gets formed not just from the overall number of alerts, but even when the same alert keeps firing day after day unaddressed.
This problem is part technology, part process. I recently wrote about one case horror story I read about a data team boasting about hyperscaling their testing strategy with millions of tasks running across thousands of DAGs to monitor hundreds of pipeline.
Of course, because there was no context for teams to prioritize or resolve incidents the same 15% of tests failed every day (which was tens of thousands) and adoption was slow.
Data quality monitoring honestly is essentially the same hyperscaled testing story, but at least typically packaged with some segmentation analysis for resolution. I don’t think too many engineers on these teams would have responded to Pedram’s tweet positively.
Ideally you have a data observability solution that can accelerate root cause analysis and resolution across data, system and code levels. Otherwise your ship is taking on water faster than your team can bail.
On the process side, the data teams that are more diligent in tracking and updating the statuses of their incidents improve their data quality levels better than the teams that are less so. It requires some clear processes, ownership, and leadership involvement, but the result is higher levels of transparency and accountability.
Updating or ignoring alerts has a multiplier effect, for better and for worse. The good news is when your team starts to resolve and close alerts regularly, it builds quickly.
Diffused responsibility and poor routing
Sean McAfee, senior ops engineer at Seasoned says, “We see asking questions on every alert as an integral part of our data team’s culture. For every incident, we are going to fix the problem or fix the alert.”
Part of what he means by this is partially what we’ve already covered (review scope and thresholds), but he is also talking about incident ownership and alert routing. If you have every alert go to a single channel with every engineer described, they will get overwhelmed and responsibility will be diffused.
Alerts need to get to the right person at the right time. Most data quality monitoring and data observability solutions will have the capability to send alerts to specific Slack/Teams/whatever channel, but you do need to create and deploy a coherent notification strategy.
For Sean and Seasoned, that strategy involves having data analysts serve as the first responders for incidents within their specific domain (thanks data lineage!). Part of that decision is related to the unique aspects of Seasoned’s data stack, but it’s also because Sean believes analysts are best equipped to answer the first key question, “is this expected?”

They also are directly visible and responsible for errors in the reporting process.
Analysts are entrusted and equipped to handle the data triage and resolution process, but are also able to escalate to data engineering for particularly challenging incidents. This has an ancillary benefit of, “letting them stretch their legs” and build skills that can help in a transition to an engineering career.
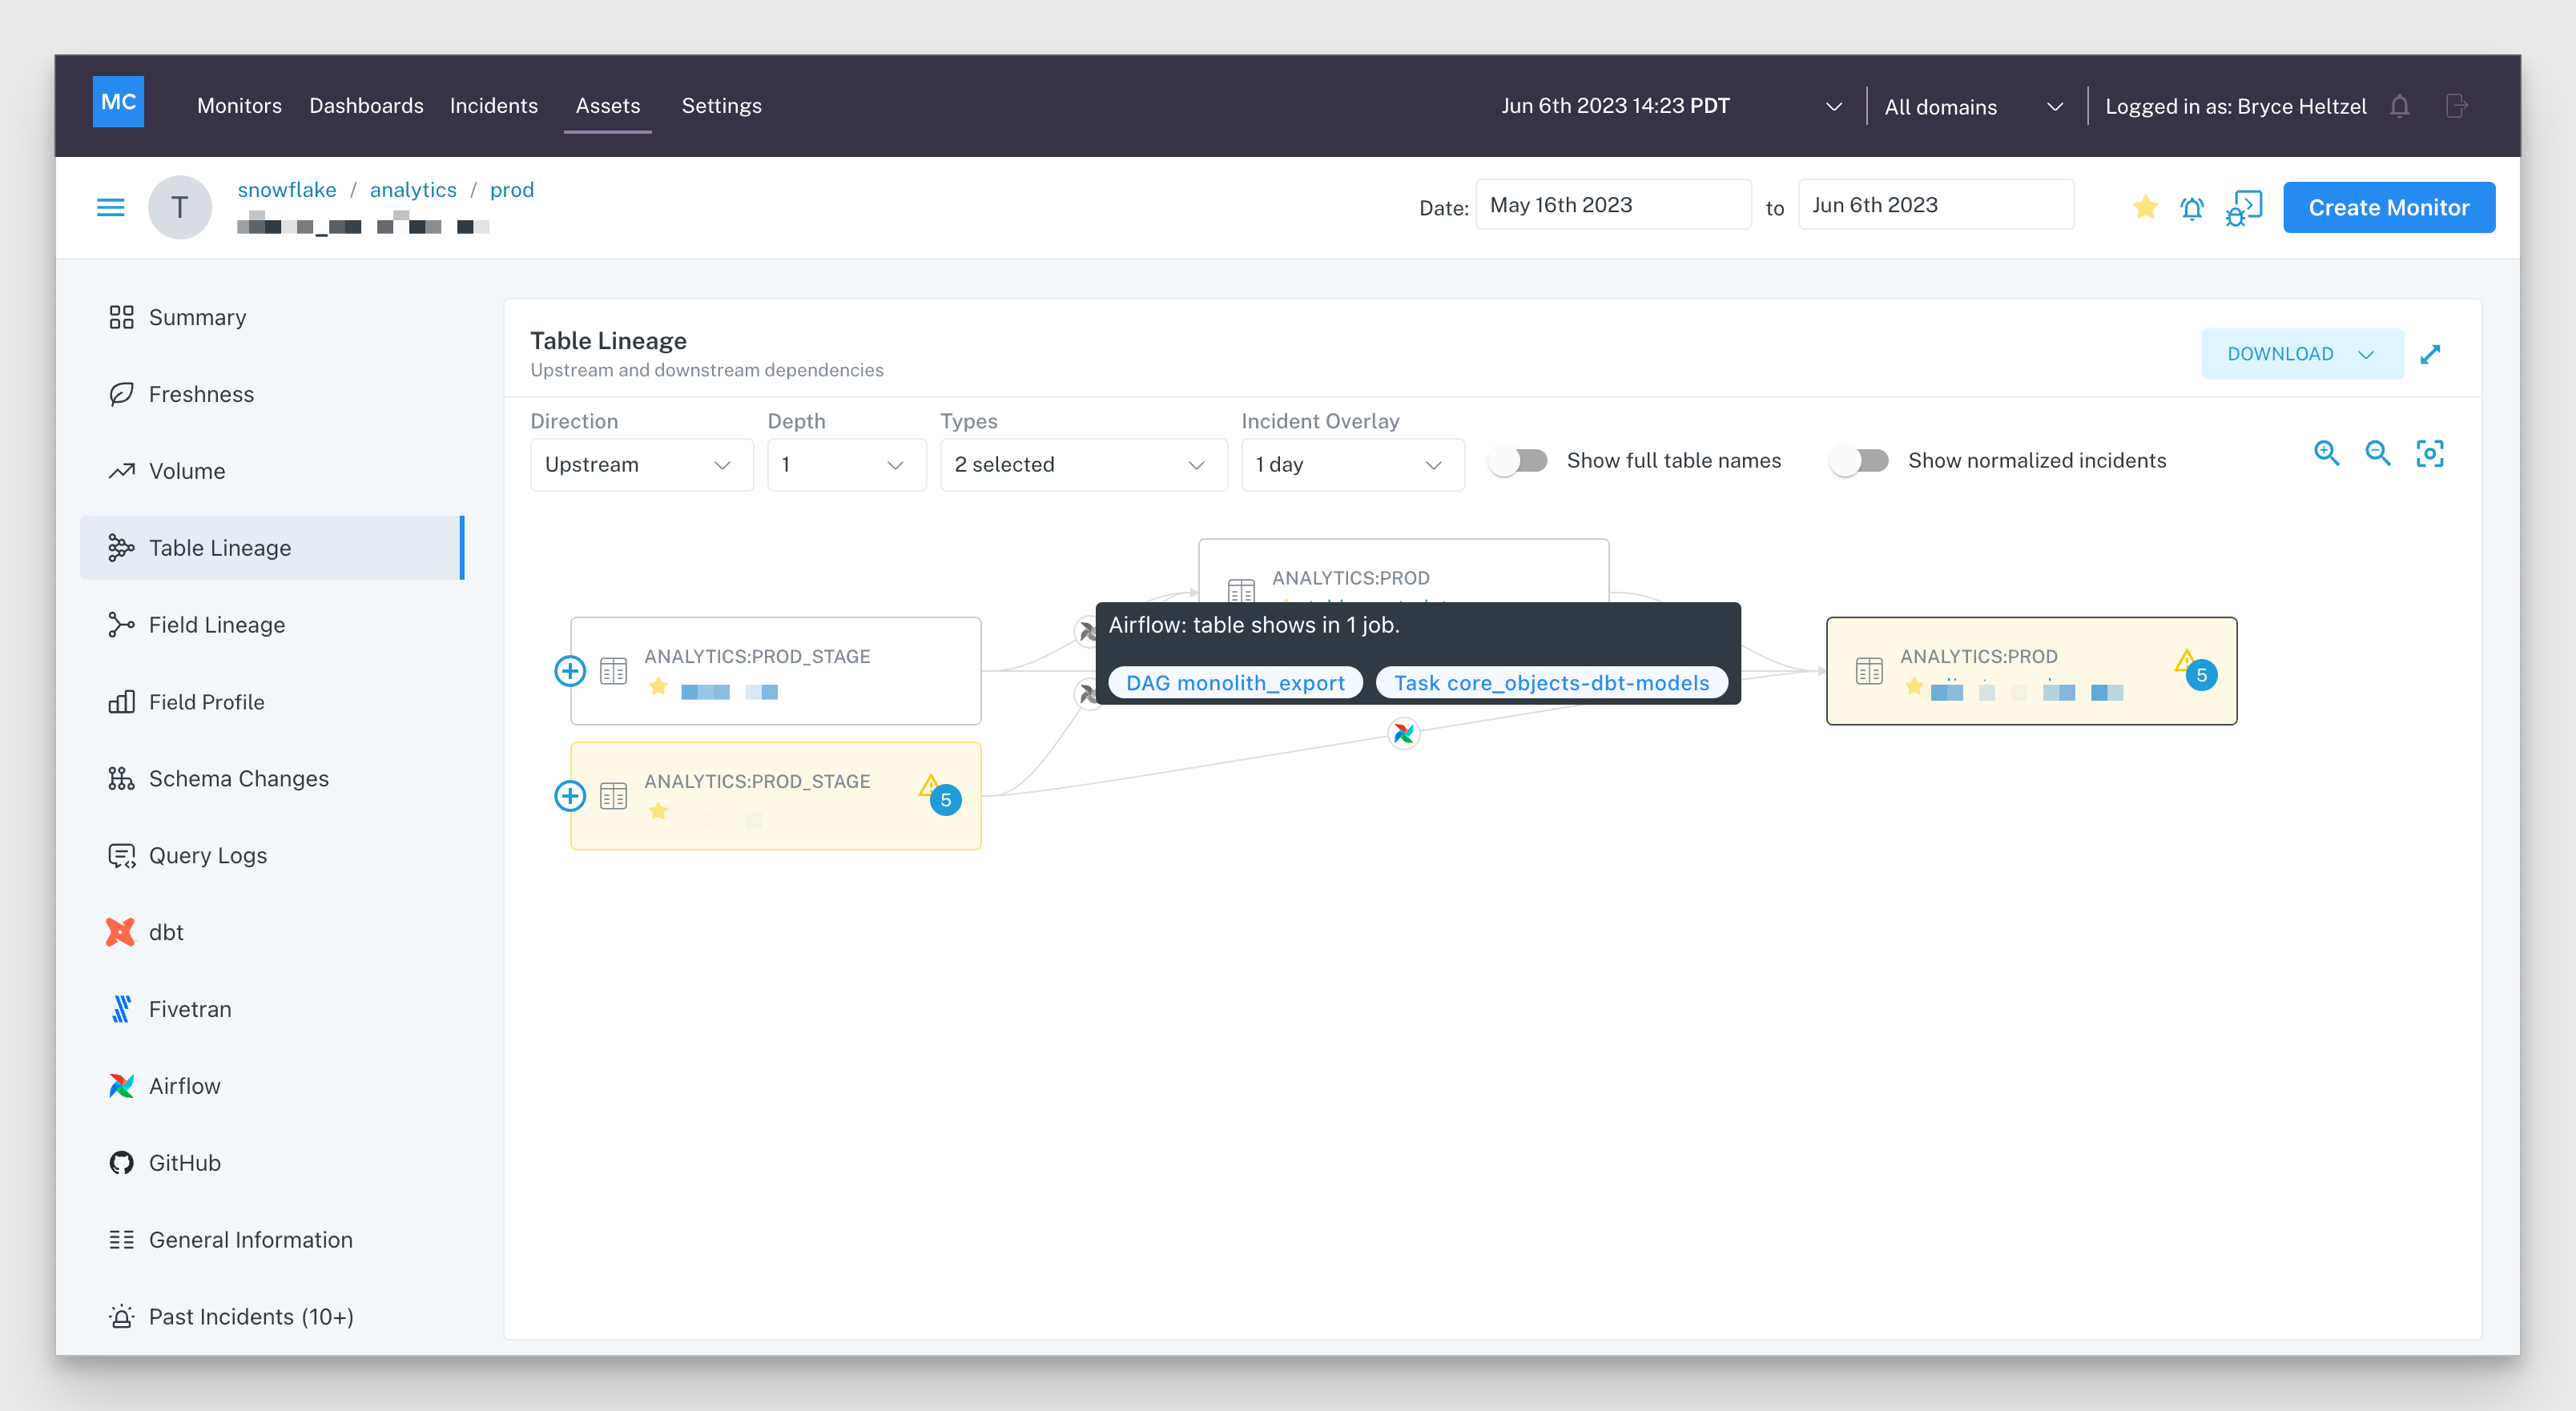
Data lineage is not just helpful for assigning ownership, it is also helpful for grouping alerts. Many incidents are multi-table incidents. For example, when there is a data freshness issue upstream that creates a cascade of issues across multiple tables and reports. What looks like 12 separate alerts is actually one incident with a multifaceted impact.
Monte Carlo’s alerts are grouped by lineage which reduces the amount of alerts we send each day by about 10%. But even more importantly, the recipient sees a coherent story rather than a mishmash of alerts that may or may not be related.
Avoid Alert Fatigue But Don’t Bury Your Head In The Sand Either
Alerts may not seem like fun, but it’s far better than the alternative. Bad data is inevitable, and if you aren’t receiving some form of proactive alert then you are reactively scrambling to a data consumer complaint–or worse.
But too many alerts is bad too, especially if they are filled with false positives, aren’t impacting key data products, or aren’t actionable.
In a strange way I’m thrilled we are having this conversation. Four years ago, we were the only people thinking about alert fatigue. To see the data reliability and observability space grow and mature so quickly is an amazing thing.
Now it’s time for me to go check the Slack notifications I’ve snoozed while writing this blog article. Until next time.
Our promise: we will show you the product.
Read more posts.