Data Testing vs. Data Quality Monitoring vs. Data Observability: What’s Right for Your Team?
Struggling with data quality? You’re not alone. But how should you get started? We walk through the three most common approaches and their tradeoffs.
When it comes to making your data more reliable at scale, there are a few routes you can take: (1) test your most critical pipelines and hope for the best, (2) automated data quality monitoring, (3) end-to-end data observability.
The right solution for your needs largely depends on:
- The volume of data (or tables) you’re managing;
- Your company’s data maturity; and
- Whether or not data is a mission-critical piece of your broader business strategy.
For more indicators read: 7 Signs It’s Time to Invest in Data Quality.
Data teams are evaluating data observability and data quality monitoring solutions as they start to question if they are getting enough coverage “return” for each hour of data engineering time “invested” in data testing. In this economy, teams can’t afford to spend 30% or more of their workweek firefighting data quality issues. Their time and energy is better spent identifying new avenues of growth and revenue.
So, without further ado, let’s walk through the major differences between these three common approaches to data quality management and how some of the best teams are achieving data trust at scale.
Table of Contents
- What is data testing?
- What is data quality monitoring?
- What is data observability?
- The future of data reliability
What is data testing?
One of the most common ways to discover data quality issues before they enter your production data pipeline is by testing your data. With open source data testing tools like Great Expectations and dbt, data engineers can validate their organization’s assumptions about the data and write logic to prevent the issue from working its way downstream.
Advantages of data testing
Data testing is a must-have as part of a layered data quality strategy. It can help catch specific, known problems that surface in your data pipelines and will warn you when new data or code breaks your original assumptions.
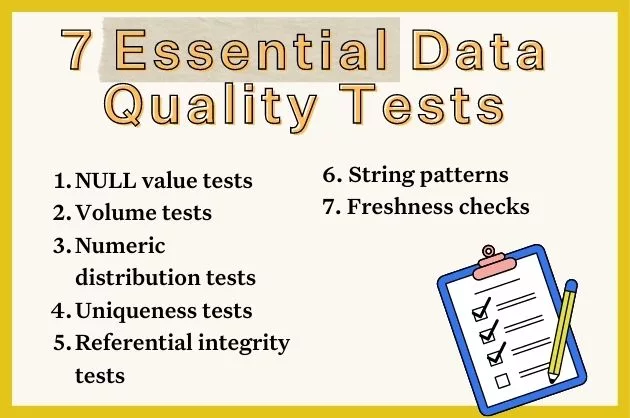
Some common data quality tests include:
- Null Values – Are any values unknown (NULL) where there shouldn’t be?
- Schema (data type) – Did a column change from an integer to a float?
- Volume – Did your data arrive? And if so, did you receive too much or too little?
- Distribution – Are numeric values within an expected/ required range?
- Uniqueness – Are any duplicate values in your unique ID fields?
- Known invariants – Is profit always the difference between revenue and cost?
One of the best use cases for data testing is to stop bad data from reaching internal or external facing consumers. In other words, when no data is better than bad data. Data contracts, for example, are a type of data test that prevent schema changes from causing havoc downstream. Data teams have also found success using the Airflow shortcircuitoperator to prevent bad data from landing in the data warehouse.
The other obvious advantage of data testing, especially for smaller data teams, is that it’s free. There is no cost to writing code and open source testing solutions are plentiful. The less obvious point however, is data testing is still almost always the worst economic choice due to the incredible inefficiencies and engineering time wasted (more on this in the next section).
Disadvantages of data testing
Is data testing sufficient to create a level of data quality that imbues data trust with your consumers? Almost certainly not.
Data testing requires data engineers to have enough specialized domain knowledge to understand the common characteristics, constraints, and thresholds of the data set. It also requires foresight, or painful experience, of the most likely ways that data could break bad.
If a test isn’t written ahead of time to cover that specific incident, an alert isn’t set. Which is why there needs to be a way to be alerted of issues that you might not expect to happen (unknown unknowns).
“We had a lot of dbt tests. We had a decent number of other checks that we would run, whether they were manual or automated, but there was always this lingering feeling in the back of my mind that some data pipelines were probably broken somewhere in some way, but I just didn’t have a test written for it,” said Nick Johnson, Dr. Squatch VP of Data, IT, & Security.
In addition to providing an overall poor level of coverage, data testing is not feasible at scale. Applying the most common, basic tests using programmatic solutions can still be radically inefficient, even if your data team was diligent about adding them immediately to each data set the minute they are created…which most teams are not.
Even if you could clone yourself – doubling your capacity to write tests – would this be a good use of your company’s time, resources, and budget? It wasn’t for the then one-person data team at Clearcover. In fact, it created a bottleneck resulting in many data consumers finding workarounds by simply querying the source data directly.
Another reason data testing is incredibly inefficient is because the table where the incident is detected rarely contains the context of its own data downtime. In other words, a test might alert you to the fact the data isn’t there, but it can’t tell you why. A long and tedious root cause analysis process is still required.
Data is fundamental to the success of your business. Therefore, it needs to be reliable and performant at all times. In the same way that Site Reliability Engineers (SREs) manage application downtime, data engineers need to focus on reducing data downtime, in other words, periods of time when data is missing, inaccurate, or otherwise erroneous.
Much in the same way that unit and integration testing is insufficient for ensuring software reliability (and thus the rise of companies like Data Dog and New Relic), data testing alone cannot solve for data reliability.
The bottom line: testing is a great place to get started, but can only scale so far, so quickly. When data debt, model bloat, and other side effects of growth become a reality, it’s time to invest in automation. Enter, data observability and data quality monitoring.
What is data quality monitoring?

Data quality monitoring is the process of automatically monitoring data quality by querying the data directly and identifying anomalies via machine learning algorithms. Learn how to build your own data quality monitoring algorithms using SQL.
Advantages of data quality monitoring
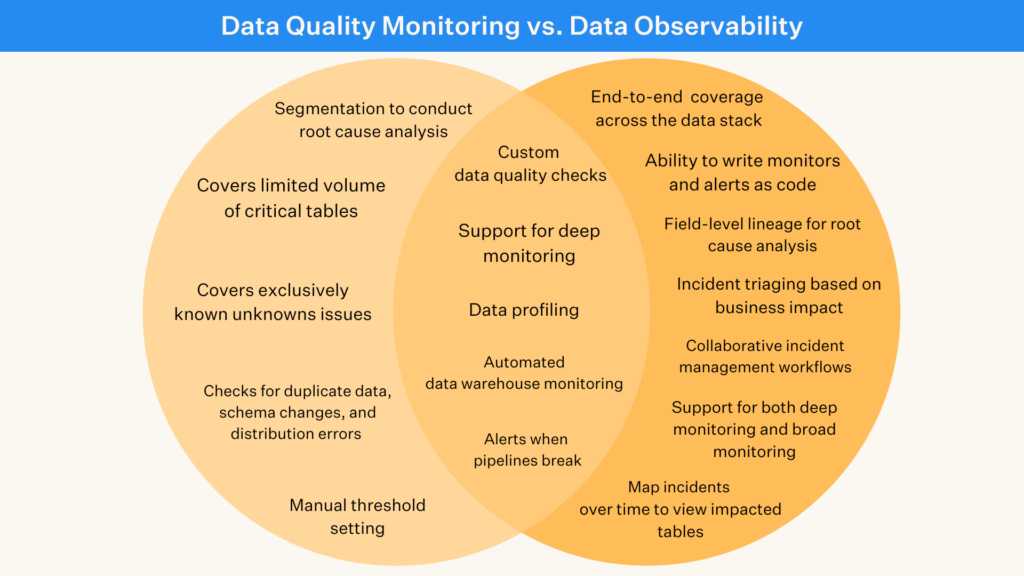
Data quality monitoring solves a few of the gaps created by data testing. For one, it provides better coverage, especially against unknown unknowns.
That’s because machine learning algorithms typically do a better job than humans in setting thresholds for what is anomalous. It’s easy to write a no NULL data test, but what if a certain percentage of NULL values are acceptable? And what if that range will gradually shift over time?
Data quality monitoring also frees data engineers from having to write or clone hundreds of data tests for each data set.
The disadvantages of data quality monitoring
Data quality monitoring can be an effective point solution when you know exactly what tables need to be covered. However, when we talk with data teams interested in applying data quality monitoring narrowly across only a specific set of key tables, we typically advise against it.
The thought process makes sense, out of the hundreds or thousands of tables in their environment, most business value will typically derive from 20% or less if we follow the Pareto principle.
However, identifying your important tables is easier said than done as teams, platforms, and consumption patterns are constantly shifting. Also, remember when we said tables rarely contain the context of their own data downtime? That still applies.
As data environments grow increasingly complex and interconnected, the need to cover more bases, faster, becomes critical to achieving true data reliability. To do this, you need a solution that drills “deep” into the data using both machine learning and user-defined rules, as well as metadata monitors to scale “broadly” across every production table in your environment and to be fully integrated across your stack.
Additionally, like testing, data quality monitoring is limited when it comes to fixing the problem. Teams still need to delegate time and resources to conducting root cause analysis, impact analysis, and incident mitigating in a manual and time-intensive way. With data quality monitoring, teams are often blind to the impact of an incident to downstream consumers making triaging based on severity essentially impossible.
So, if testing and data quality monitoring aren’t sufficient for creating data trust, what comes next? Two words: data observability.
What is data observability?
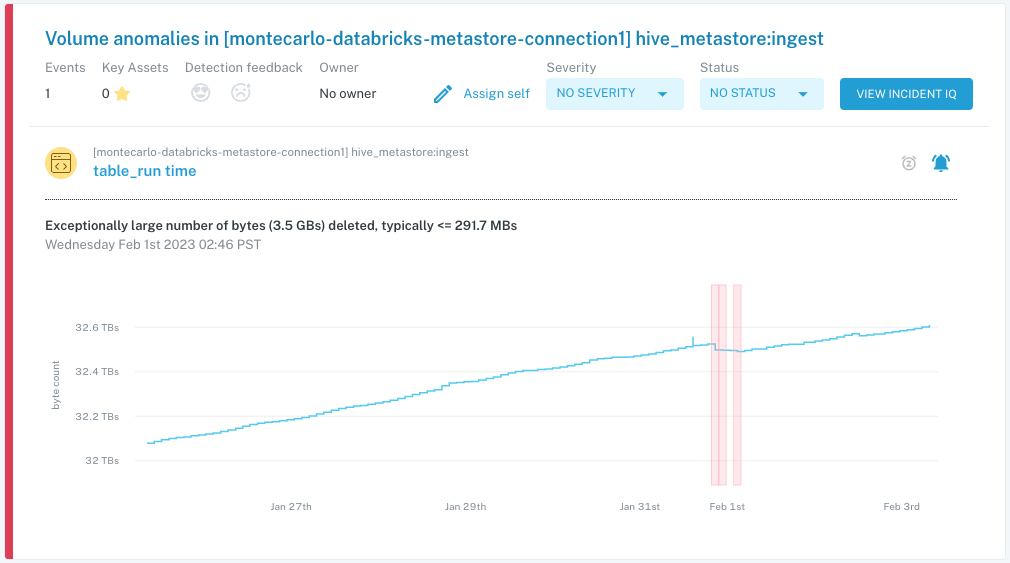
Data observability is an organization’s ability to fully understand the health of the data in their systems. Data observability eliminates data downtime by applying best practices learned from DevOps to data pipeline observability.
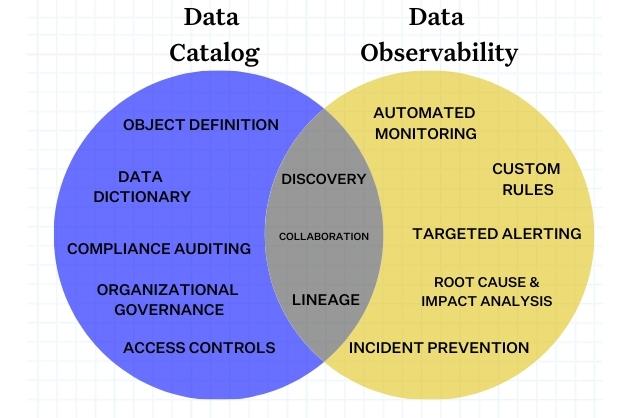
Data observability tools use automated testing and monitoring, automated root cause analysis, data lineage and data health insights to detect, resolve, and prevent data anomalies.
The five pillars of data observability are:
- Freshness: Freshness seeks to understand how up-to-date your data tables are, as well as the cadence at which your tables are updated. Freshness is particularly important when it comes to decision making; after all, stale data is basically synonymous with wasted time and money.
- Quality: Your data pipelines might be in working order but the data flowing through them could be garbage. The quality pillar looks at the data itself and aspects such as percent NULLS, percent uniques and if your data is within an accepted range. Quality gives you insight into whether or not your tables can be trusted based on what can be expected from your data.
- Volume: Volume refers to the completeness of your data tables and offers insights on the health of your data sources. If 200 million rows suddenly turns into 5 million, you should know.
- Schema: Changes in the organization of your data, in other words, schema, often indicates broken data. Monitoring who makes changes to these tables and when is foundational to understanding the health of your data ecosystem.
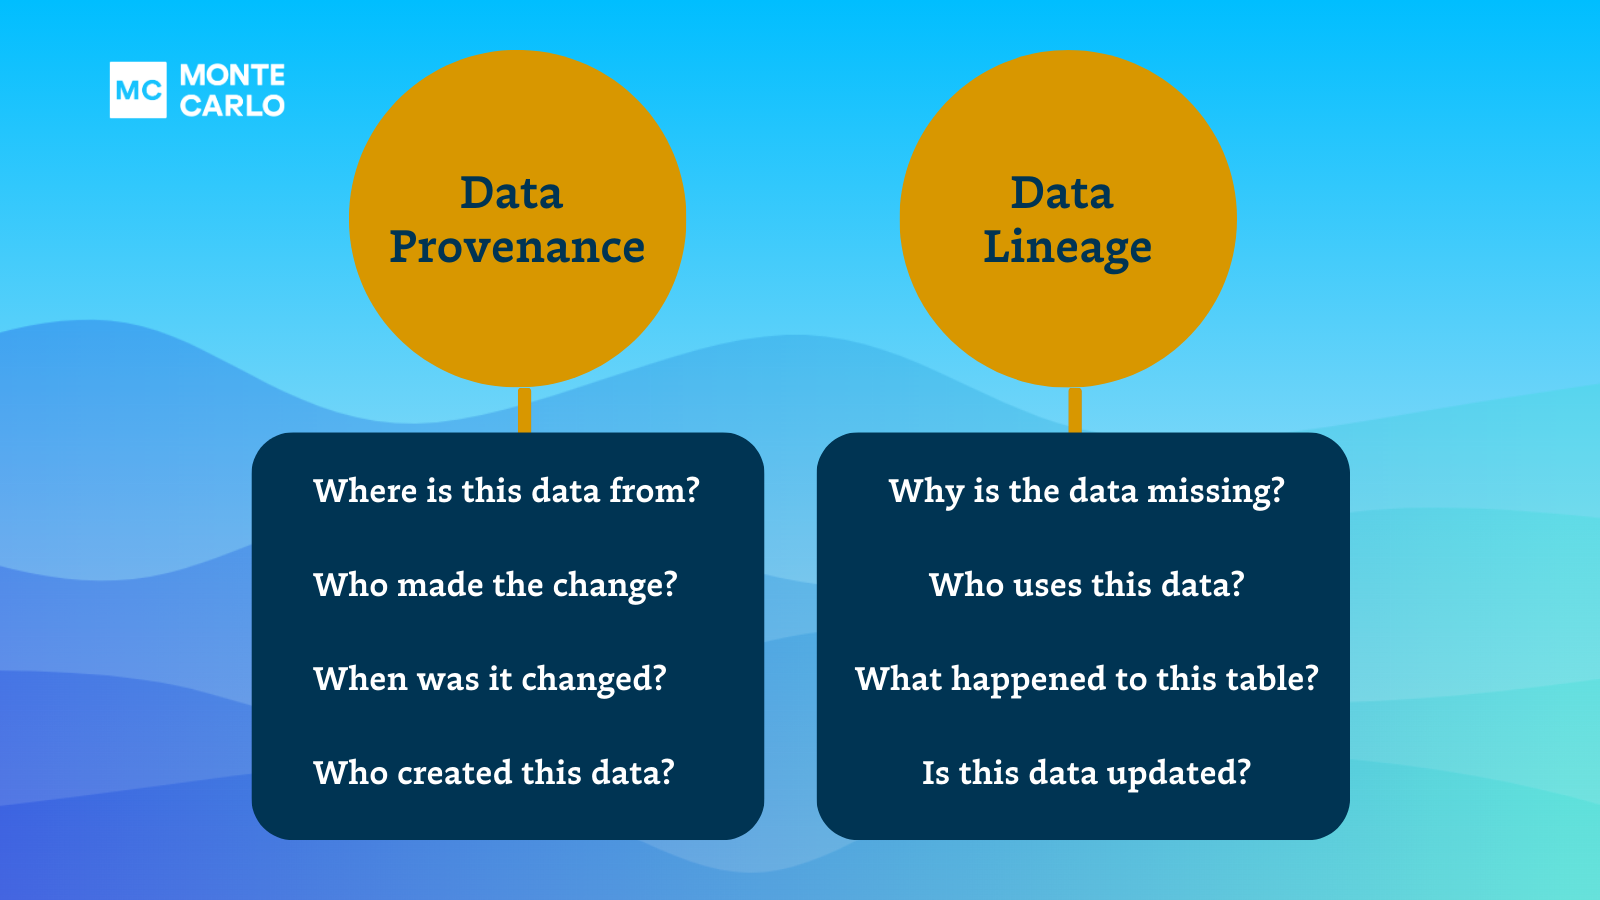
- Lineage: When data breaks, the first question is always “where?” Data lineage provides the answer by telling you which upstream sources and downstream ingestors were impacted, as well as which teams are generating the data and who is accessing it. Good lineage also collects information about the data (also referred to as metadata) that speaks to governance, business, and technical guidelines associated with specific data tables, serving as a single source of truth for all consumers.
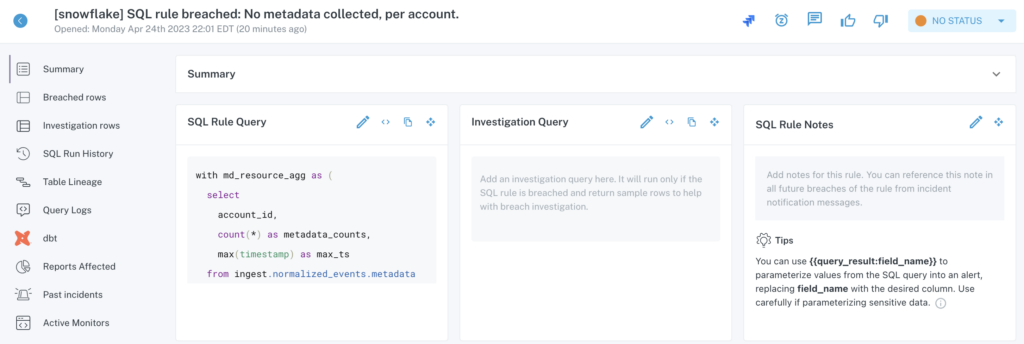
Data observability solutions free up company time, revenue, and resources by providing out-of-the-box coverage for freshness, volume, and schema changes across all of your critical data sets, as well as the ability to set custom rules for “deeper” quality checks, like distribution anomalies or field health. More advanced data observability tools also offer programmatic functionality to rule-setting, with the ability to write monitors and incident notifications as code.
Here are four critical ways observability differs from testing and monitoring your data:
1) End-to-end coverage
Modern data environments are highly complex, and for most data teams, creating and maintaining a high coverage robust testing suite or manually configuring every data quality monitor is not possible or desirable.
Due to the sheer complexity of data, it is improbable that data engineers can anticipate all eventualities during development. Where testing falls short, observability fills the gap, providing an additional layer of visibility into your entire data stack.
2) Scalability
Writing, maintaining, and deleting tests to adapt to the needs of the business can be challenging, particularly as data teams grow and companies distribute data across multiple domains. A common theme we hear from data engineers is the complexity of scaling data tests across their data ecosystem.
If you are constantly going back to your data pipelines and adding testing coverage for existing pipelines, it’s likely a massive investment for the members of your data team.
And, when crucial knowledge regarding data pipelines lies with a few members of your data team, retroactively addressing testing debt will become a nuisance—and result in diverting resources and energy that could have otherwise been spent on projects that move the needle.
Observability can help mitigate some of the challenges that come with scaling data reliability across your pipelines. By using an ML-based approach to learn from past data and monitor new incoming data, data teams can gain visibility into existing data pipelines with little to no investment. With the ability to set custom monitors, your team can also ensure that unique business cases and crucial assets are covered, too.
3) Root cause & impact analysis
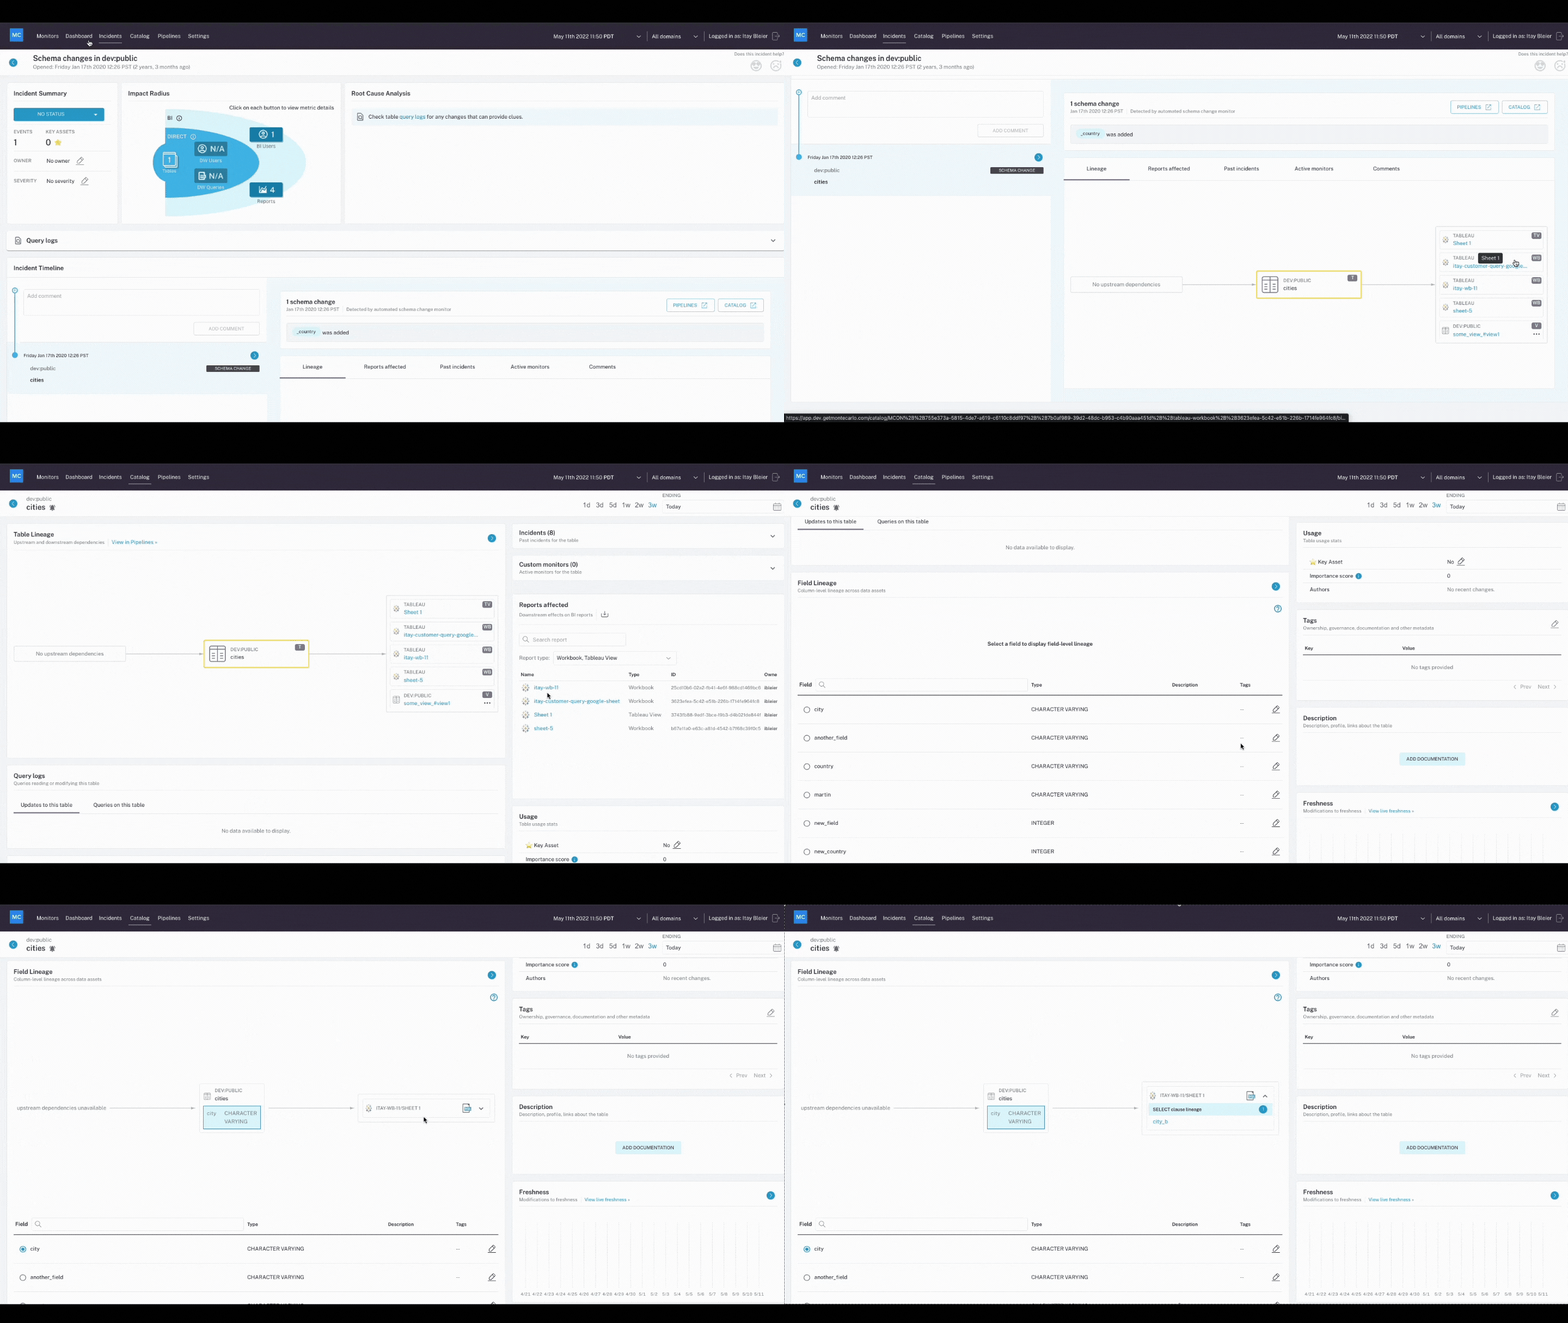
Testing can help catch issues before data enters production. But even the most robust tests can’t catch every possible problem that may arise—data downtime will still occur. And when it does, observability makes it faster and easier for teams to solve problems that happen at every stage of the data lifecycle.
Since data observability includes end-to-end data lineage, when data breaks, data engineers can quickly identify upstream and downstream dependencies. This makes root cause analysis much faster, and helps team members proactively notify impacted business users and keep them in the loop while they work to troubleshoot the problem.
4) Saving time and resources
One of the most prominent challenges data engineers face is speed – and they often sacrifice quality to achieve it. Your data team is already limited in time and resources, and pulling data for that critical report your Chief Marketing Officer has been bugging you about for weeks can’t wait any longer. Sure, there are any number of tests or monitors you should set before you transform the data, but there simply isn’t enough time.
Data observability acts as your insurance policy against bad data and accelerates the pace your team can deploy new pipelines. Not only does it cover those unknown unknowns but also helps you catch known issues that scale with your data.
Teams who invest in data observability save an average of 100 hours per quarter, reducing data downtime by 90 percent. Data observability can also track when critical revenue channels are affected by poor data quality, whether by an outdated ML model or external factors that impact user behavior.
If you’re looking for a data quality solution that scales with your company’s growth and brings immediate value, data observability is a good place to start.
The future of data reliability
Ultimately, the path you choose to scale data trust is up to you, but if time to value is a factor, the decision is an easy one.
Data observability is at the heart of the modern data stack, whether it’s enabling more self-service analytics and data team collaboration, adoption, or ensuring critical data is usable by stakeholders. And in this day and age of tight budgets, lean teams, and short timelines, the sooner we can deliver trusted data, the better.
Whether you chose to crawl, walk or run towards more reliable data, here’s wishing you no data downtime!
Ready to get serious about data trust? Reach out to Molly and the rest of the Monte Carlo team to learn more.
Our promise: we will show you the product.
 Product demo.
  What is data observability?
  What is a data mesh--and how not to mesh it up
  The ULTIMATE Guide To Data Lineage
