Product demo.
  What is data observability?
  What is a data mesh--and how not to mesh it up
  The ULTIMATE Guide To Data Lineage
 Data Observability Architecture And Optimizing Your Coverage

Ethan Post
Ethan is a Sales Engineer at Monte Carlo.

Michael Segner
Michael writes about data engineering, data quality, and data teams.
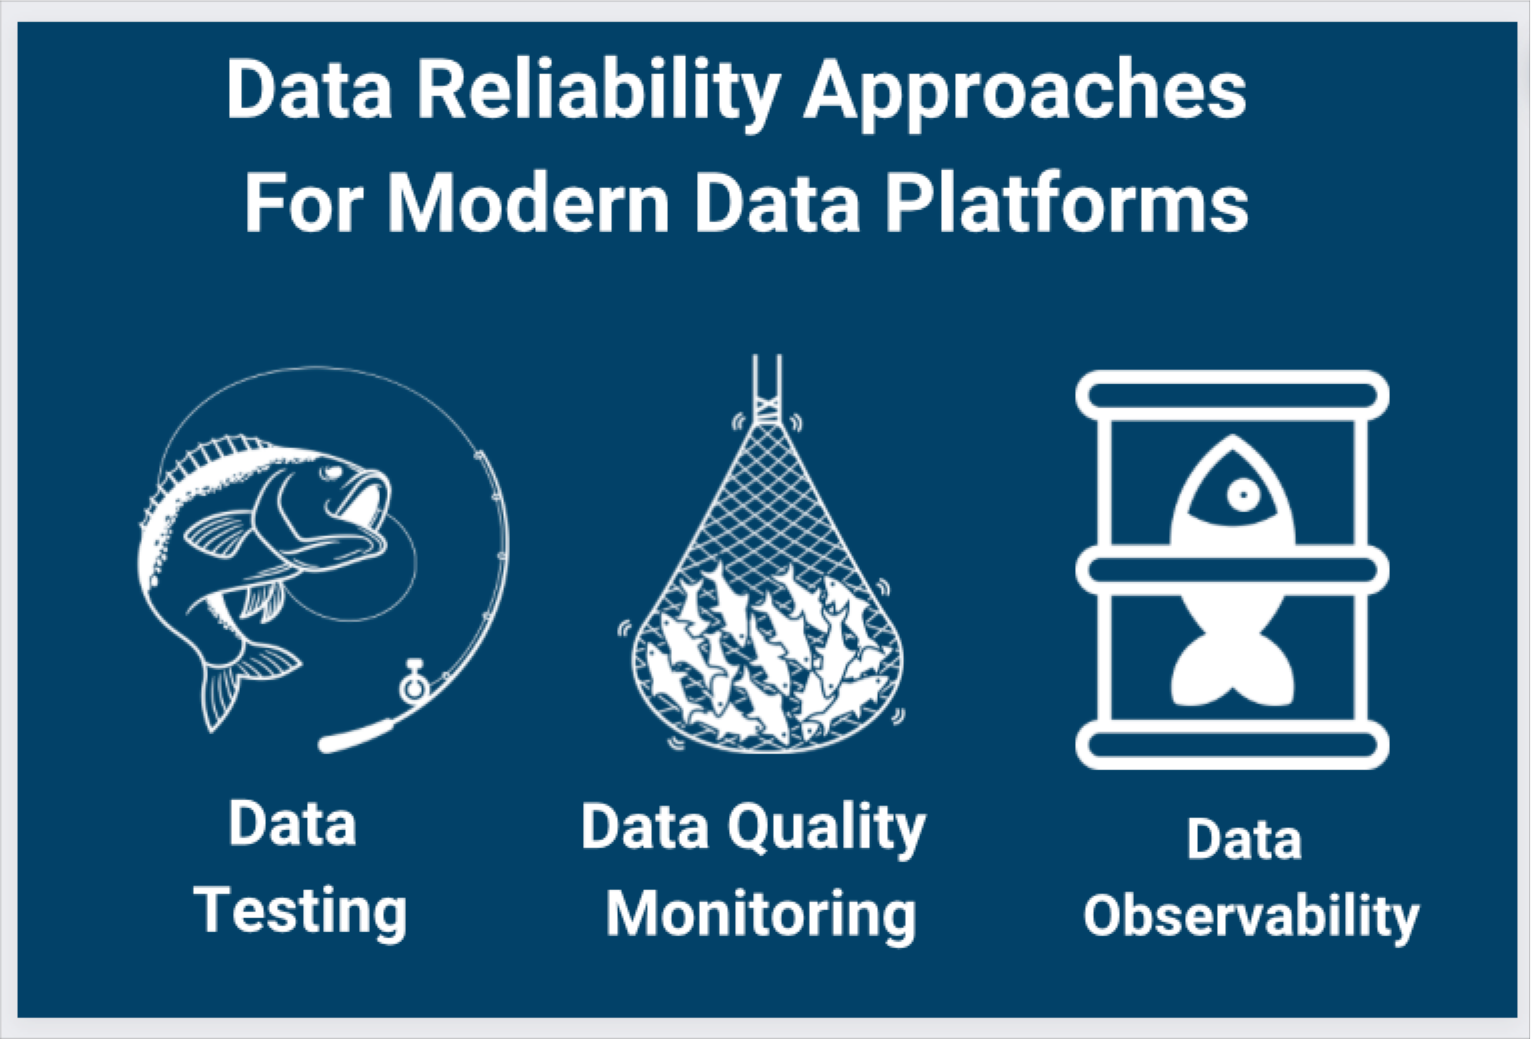
Monitoring for bad data is like fishing. If you aren’t looking in the right spot, you aren’t going to catch anything. And, even in the cloud, you can’t be everywhere.
So what is the optimal data observability architecture or data quality coverage strategy?
Each company organizes their data and business slightly differently so the answer will vary, but there are some guiding principles to follow. The two most significant of which are:
- Use the “right tool” for the right job; and
- Deploy coverage “end-to-end” on your “key data products”
There is a lot of nuance to unpack from those written air quotes, so let’s dive in a bit deeper.
Table of Contents
The right tool for the right job
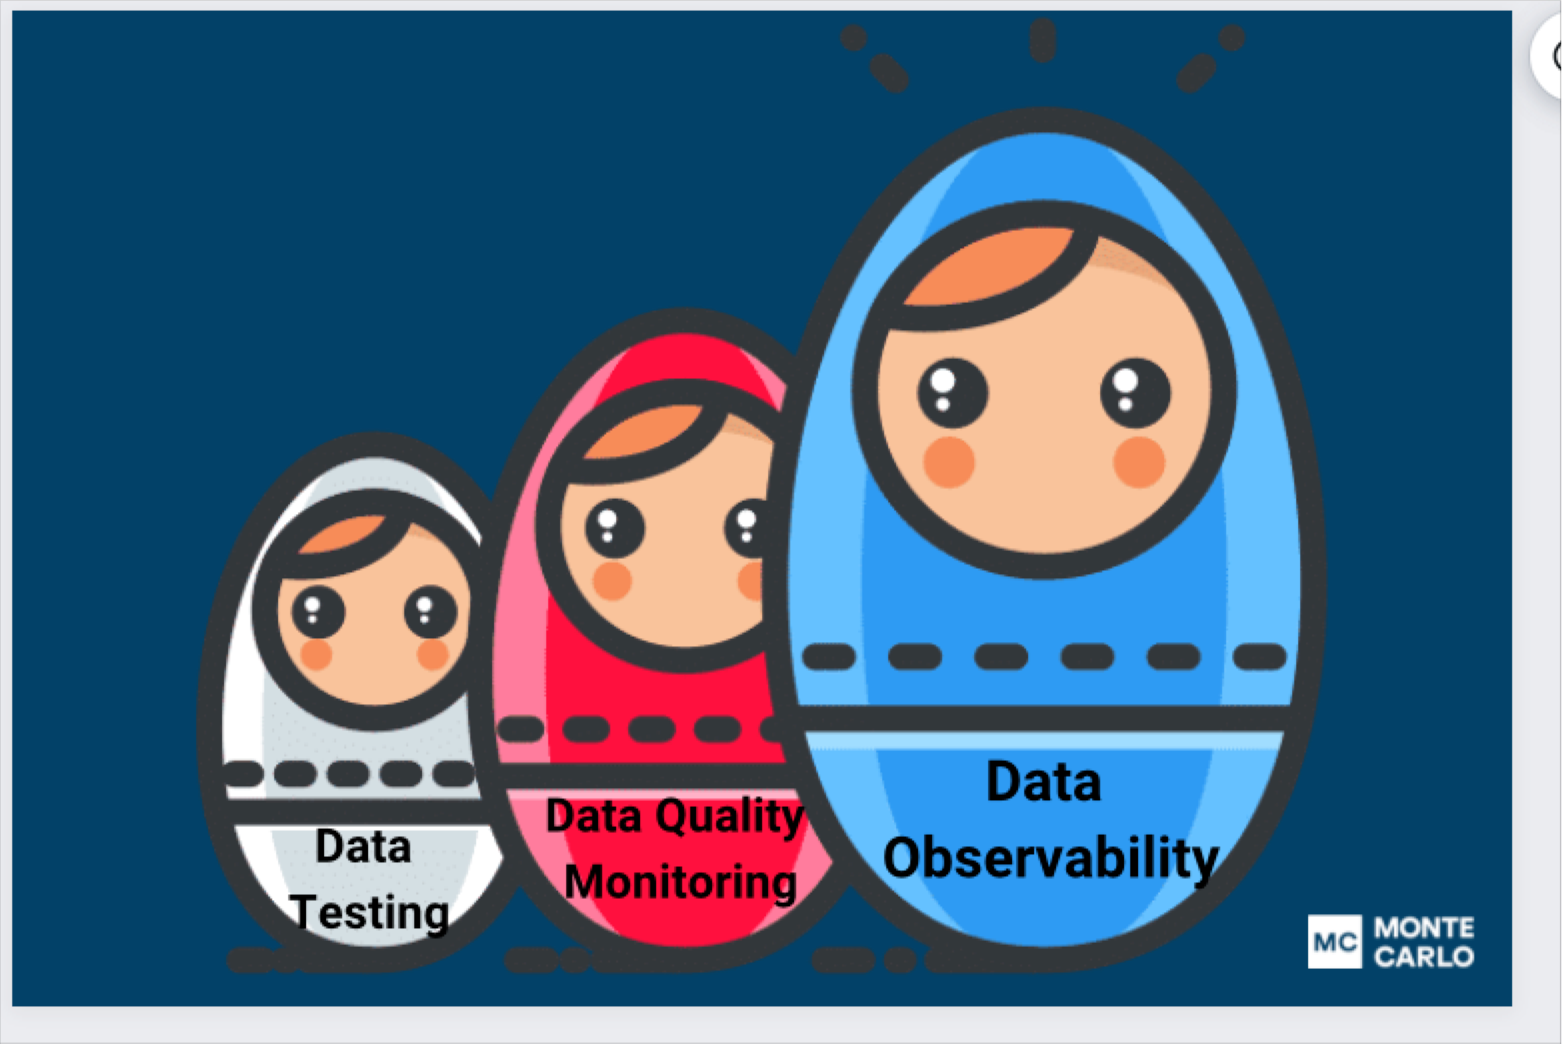
There are three common data quality approaches in a modern data stack architecture: data testing, data quality monitoring, and data observability. You can think of these approaches like Russian dolls. Data testing capabilities are typically nested within data quality monitoring tools and both are nested within data observability solutions.
Data testing is helpful for setting alerts for data that doesn’t meet very specific, well defined conditions. For example, there should never be a negative value in a column used to store currency rates. To return to our fishing analogy, this would be like casting an individual line. You can catch the fish if you know exactly where they are, but the casting is very manual, tedious work.
Data quality monitoring leverages machine learning to take a more automated approach. An alert is triggered when there is a data anomaly across a set of data quality metrics. For example, if an application was duplicating data, the ML monitor would detect a drop in the percentage of unique values within a column and that the value distribution was outside of historical norms.
Now, you’re fishing with a net. You don’t need to know exactly where the fish are, but you are still combing back and forth across the sea—it’s not always the most efficient use of resources.
Data observability adds the ability to monitor metadata and logs from the data systems across your stack for full visibility into anomalous behavior. It’s very efficient at scale. Going back to our duplicating data example, a data observability solution would also detect a spike in the number of rows being added to the table and display the data lineage showing the origin and root cause of the issue.
You’re no longer fishing, you are shooting fish in a (transparent) barrel. In other words, the scale is now in your favor and you have ecosystem visibility.
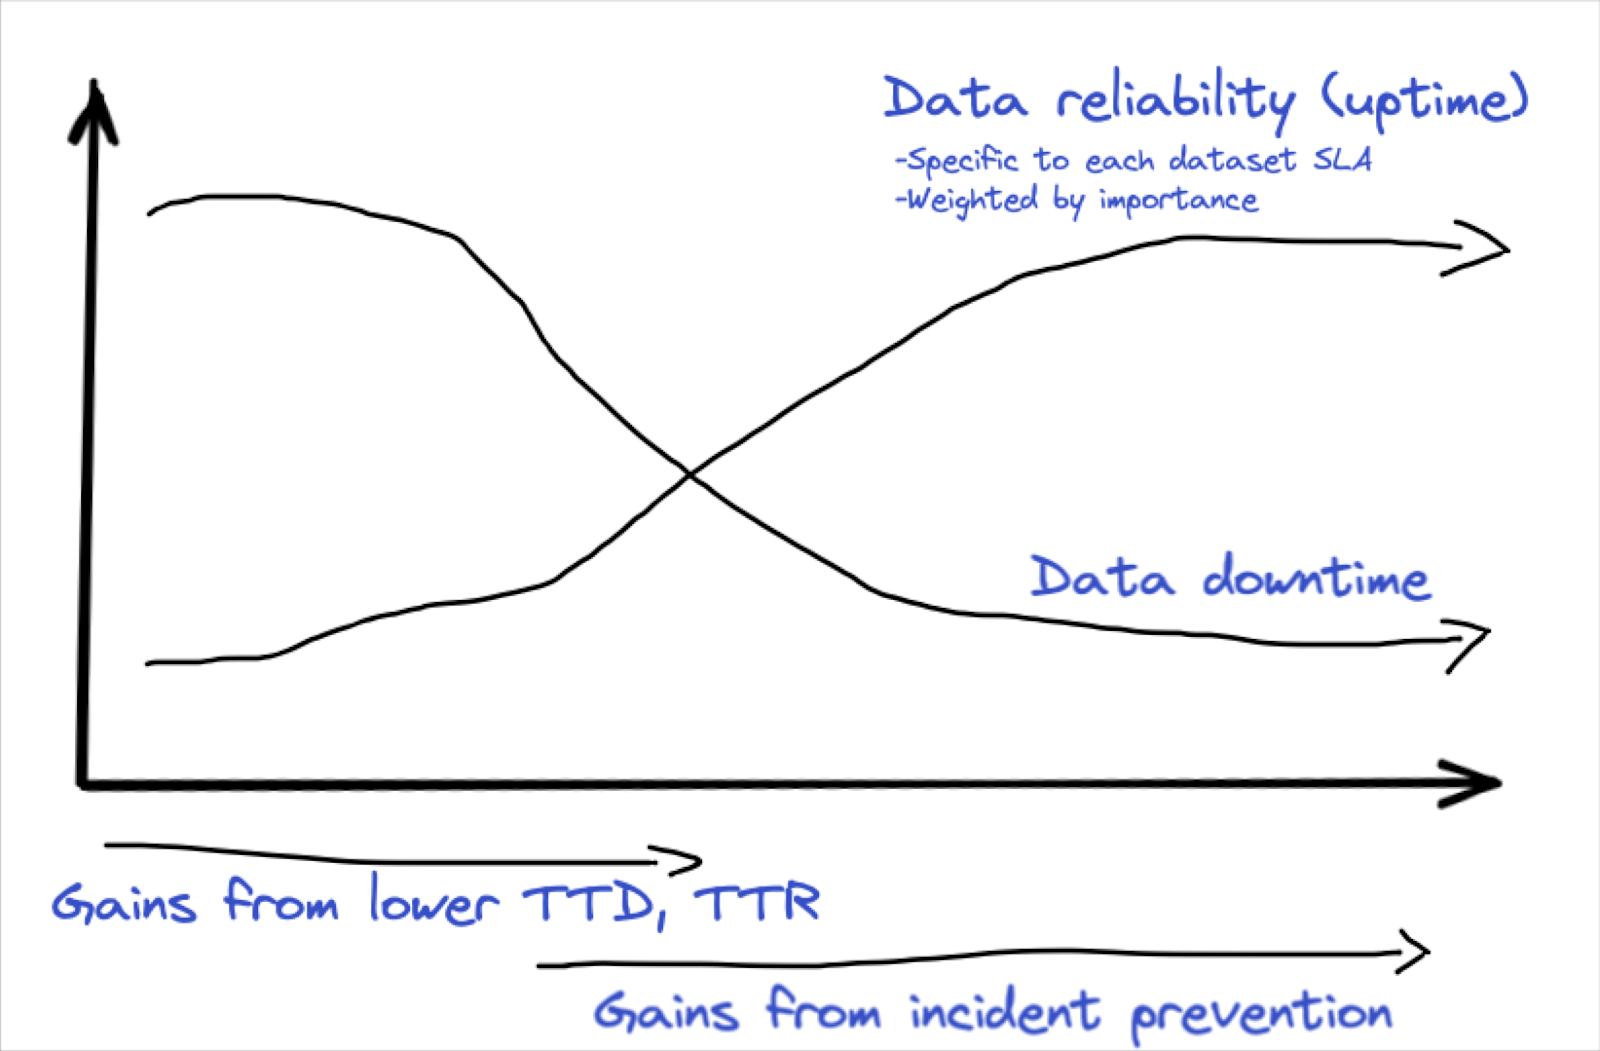
When the scope of the data being used to drive critical decision-making exceeds 50-100 objects, data observability becomes the right tool for the job and the most efficient way to scale coverage.
This is the, admittedly hazy line, where data testing becomes unwieldy and data lineage/full system visibility becomes particularly powerful. Once your environment has reached this scale, testing and data quality monitoring approaches become a resource drain on your team to maintain coverage across a constantly shifting landscape while also responding to alerts without context.
Covering on your key data products
In an ideal world, the answer to our opening question becomes simple. Deploy data observability across all of your production pipelines, excluding the ad-hoc and experimental.
This works for many organizations, but for others budgetary and operational realities can create challenges for a large, monolithic deployment. The good news is data observability doesn’t have to be an all or nothing proposition.
A good place to start is to consider your data products. While these come in different shapes (more on this later), the most common definition is a pipeline supporting a specific use case like a marketing dashboard or a ML personalization algorithm.
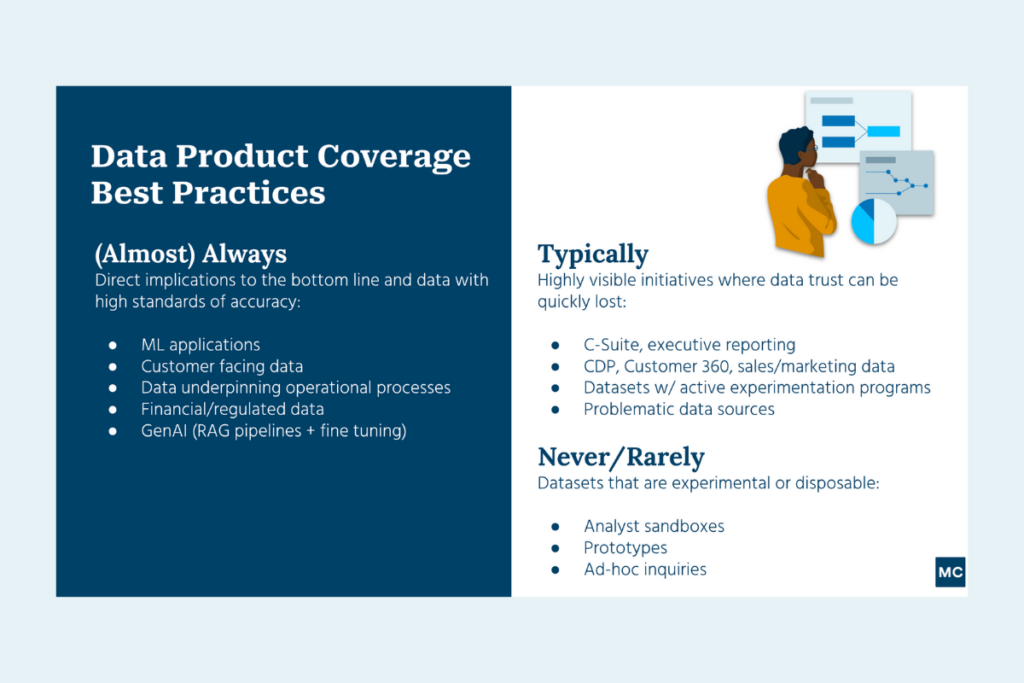
You always want to have coverage for data products where data downtime will have a direct impact on your bottom line. This typically includes:
- Machine learning applications
- Customer or external facing data
- Data that is crucial to the performance of a business process (for example, if a plane can’t take off because of a corrupt database file)
- Financial or regulated data sources
- GenAI initiatives (RAG/fine tuning pipelines)
You will also want to cover data products that are highly visible where data downtime will impact the level of data trust and adoption within the organization. You probably have a good sense of these based on the issues surfaced by your data consumers. This typically includes:
- Dashboards used to make strategic business decisions by C-Suite and other senior executives
- Customer 360 datasets that aggregate customer data
- Marketing and sales data
- Datasets frequently leveraged by active experimentation initiatives
- Problematic data sources
The importance of end-to-end coverage
The key is to take an end-to-end pipeline coverage approach. In other words, you should cover the tables upstream of the final “gold” tables that directly feed your data products. Why?
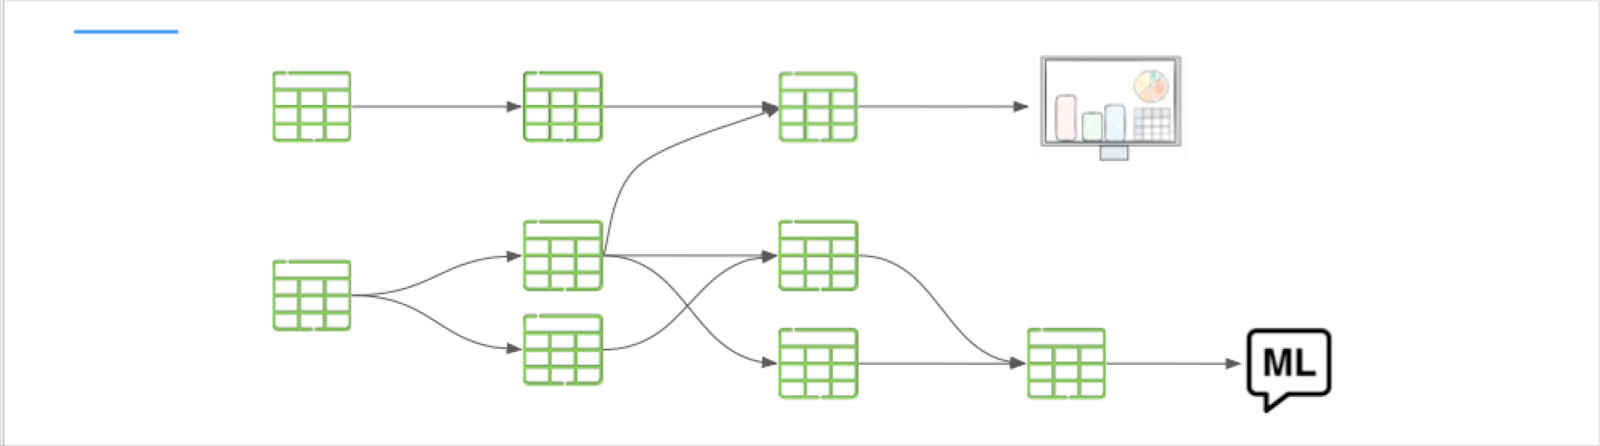
One reason is for better incident troubleshooting and root cause analysis. You can’t tell if the issue arose from garbage data landing in your raw layer (or not arriving at all) or a bad transformation in your aggregate/silver layers if you aren’t monitoring end-to-end.
The other reason is to dial in the right level of sensitivity. You detect more granular incidents faster the further upstream you monitor. You can’t truly have “deep” coverage unless you also have “broad” coverage. The CEO of the digital advertising platform Choozle explains this quite well:
“Without a tool like this, we might have monitoring coverage on final resulting tables, but that can hide a lot of issues,” said Adam Woods. “You might not see something pertaining to a small fraction of the tens of thousands campaigns in that table, but the advertiser running that campaign is going to see it. With Monte Carlo we are at a level where we don’t have to compromise.”
So now you have better insight and more time to fix the issue before it trickles down to your gold tables and becomes a larger problem.
It can also be helpful to monitor your data sources, especially custom rules to ensure data is landing properly from your transactional or legacy databases to your modern data platform. Just keep in mind there is a reason why you are consolidating within a data platform to begin with—data not only becomes more valuable but easier to manage.
If you extend your coverage too deep and thin across the perimeter you risk alert fatigue. A trap here can be having what we call a more “deterministic” rather than “probabilistic” mindset.
An example of a deterministic mindset would be, “If everything that sits in Postgres ends up in Snowflake, then my job is done.” A probabilistic mindset would be, “Everything in Postgres ended up in Snowflake, but we usually get 10 thousand records every hour and this time we got 2 thousand, something might be amiss.”
Other data product shapes
Data products come in many shapes and sizes. You can be expansive with the definition of what a data product is, but be exacting in the standards they must uphold.
Not every data team will have long, mostly discrete pipelines powering an important subset of ML, analytical, or AI use cases.
For example, some data teams organize their data by customer and boast dozens or hundreds of these data products that are mostly pulling from the same tables, but with a customer specific data mart at the end.
Or a centralized data platform team may consider their data product to be the “self-service layer” that is used by other data teams for a variety of decentralized use cases.
The best data observability architecture is a deployed one
Just like oftentimes the best decision is a decision that actually gets made, the best data observability architecture is often the one that lets you get started quickly.
The data space moves too quickly for year-long initiatives and marches to value (which if you’ll allow us a quick aside, is why you should proceed with caution with your data governance project).
The most successful data teams don’t overthink it. They pick their most valuable data product and focus on “building operational muscle” around these new workflows.
They also proactively set metrics for success and communicate to the business the steps being taken to ensure that data is on time, complete and correct. Some set data SLAs on this road to building data trust.
With proven value and happy data consumers in hand, you can then expand to each area of the business where data drives value. This directly aligns your efforts and investment to the value of each use case so you can easily demonstrate the ROI, and that is a win for everyone.
Our promise: we will show you the product.
##
Read more posts.