Product demo.
  What is data observability?
  What is a data mesh--and how not to mesh it up
  The ULTIMATE Guide To Data Lineage
 The Annual State of Data Quality Survey


Michael Segner
Michael writes about data engineering, data quality, and data teams.

Peter Milligan
Peter leads public relations and analyst relations at Monte Carlo.

Lior Gavish
CTO and Co-founder, Monte Carlo. Programming wizard and lover of cats.
It’s that time of year where we announce the results of our annual The State of Data Quality survey. The headline for this year was, without a doubt, the fact that data downtime nearly doubled year over year, driven by a 166% increase in time to resolution for data quality issues. ?
The Wakefield Research data quality survey, which was commissioned by Monte Carlo and polled 200 data professionals in March 2023, found three critical factors contributed to this increase in data downtime. These factors included:
- A rise in monthly data incidents, from 59 in 2022 to 67 in 2023;
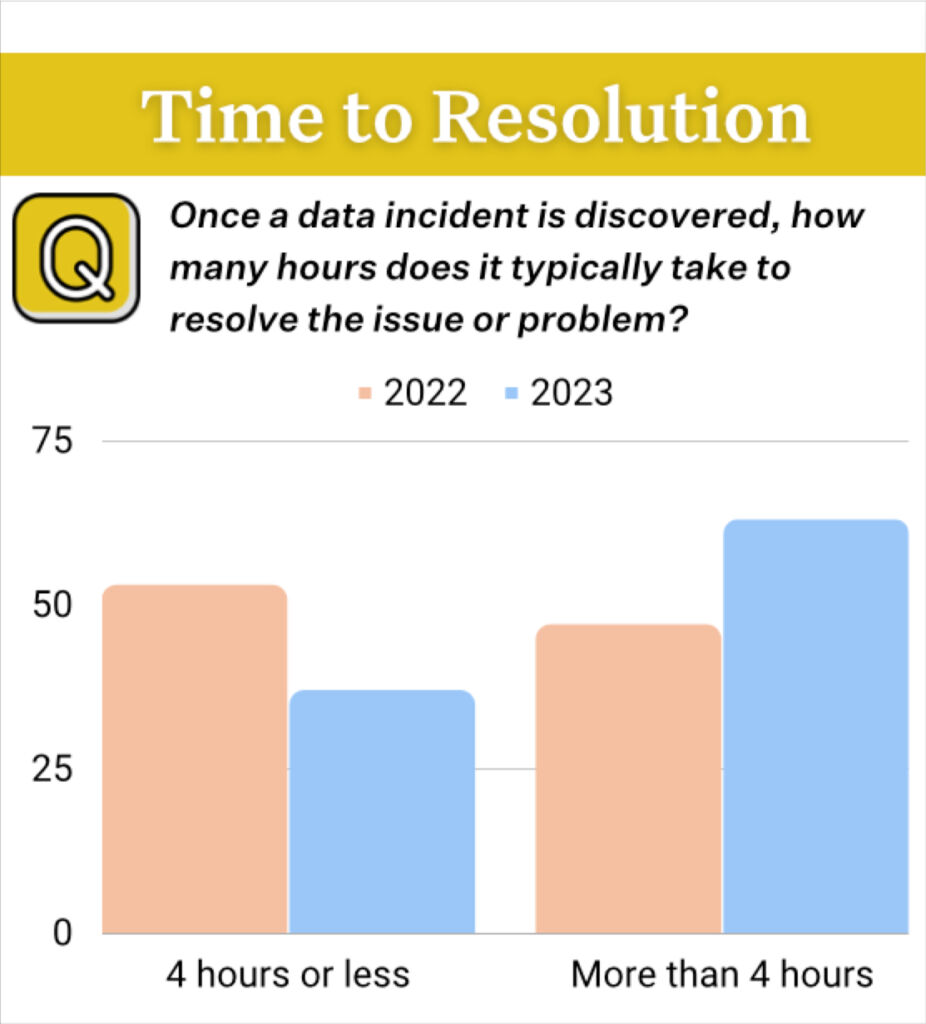
- 68% of respondents reported an average time of detection for data incidents of four hours or more, up from 62% of respondents in 2022; and
- A 166% increase in average time to resolution, rising to an average of 15 hours per incident across respondents.
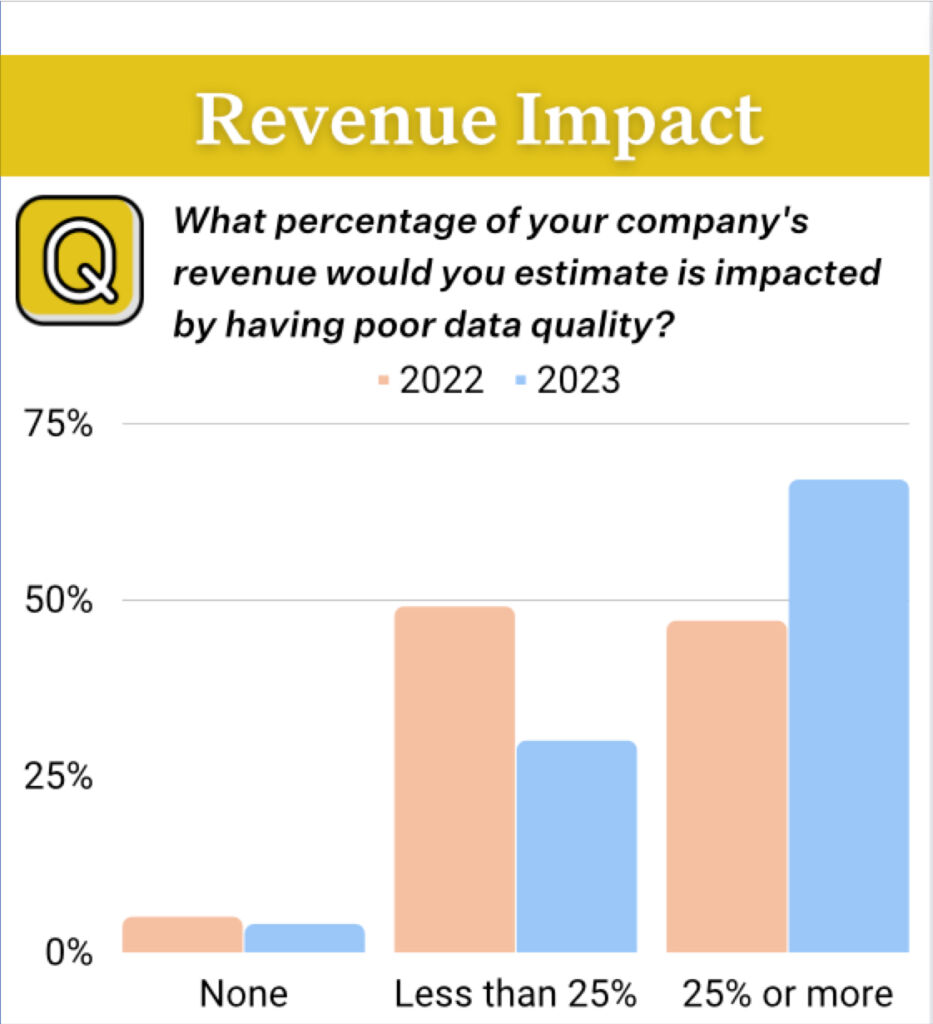
More than half of respondents reported 25% or more of revenue was subjected to data quality issues. The average percentage of impacted revenue jumped to 31%, up from 26% in 2022.
Additionally, an astounding 74% reported business stakeholders identify issues first, “all or most of the time,” up from 47% in 2022.
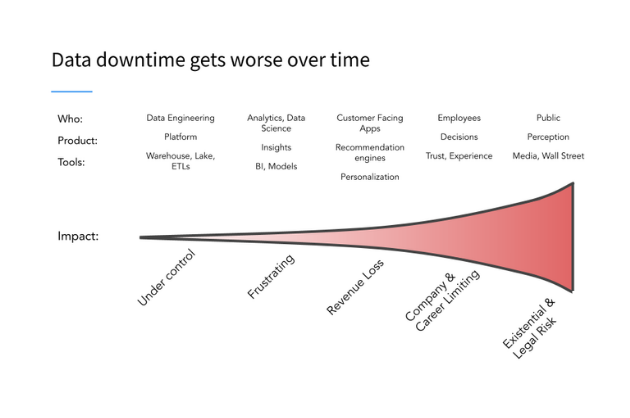
These findings suggest data quality remains among the biggest problems facing data teams, with bad data having more severe repercussions on an organization’s revenue and data trust than in years prior.
Data Quality Tradeoffs
The survey also suggests data teams are making a tradeoff between data downtime and the amount of time spent on data quality as their datasets grow.
For instance, organizations with fewer tables reported spending less time on data quality than their peers with more tables, but their average time to detection and average time to resolution was comparatively higher. Conversely, organizations with more tables reported lower average time to detection and average time to resolution, but spent a greater percentage of their team’s time to do so.
- Respondents that spent more than 50% of their time on data quality had more tables (average 2,571) compared to respondents that spent less than 50% of their time on data quality (average 208).
- Respondents that took less than 4 hours to detect an issue had more tables (average 1,269) than those who took longer than 4 hours to detect an issue (average 346).
- Respondents that took less than 4 hours to resolve an issue had more tables (average 1,172) than those who took longer than 4 hours to resolve an issue (average 330).
“These results show teams having to make a lose-lose choice between spending too much time solving for data quality or suffering adverse consequences to their bottom line,” said Barr Moses, CEO and co-founder of Monte Carlo. “In this economic climate, it’s more urgent than ever for data leaders to turn this lose-lose into a win-win by leveraging data quality solutions that will lower BOTH the amount of time teams spend tackling data downtime and mitigating its consequences. As an industry, we need to prioritize data trust to optimize the potential of our data investments.”
Data Quality Survey: Other Findings Of Note
The survey revealed additional insights on the state of data quality management, including:
- 50% of respondents reported data engineering is primarily responsible for data quality, compared to:
- 22% for data analysts,
- 9% for software engineering,
- 7% for data reliability engineering,
- 6% for analytics engineering,
- 5% for the data governance team, and
- 3% for non-technical business stakeholders.
- Respondents averaged 642 tables across their data lake, lakehouse, or warehouse environments.
- Respondents reported having an average of 24 dbt models, and 41% reported having 25 or more dbt models.
- Respondents averaged 290 manually-written tests across their data pipelines.
- The number one reason for launching a data quality initiative was that the data organization identified data quality as a need (28%), followed by a migration or modernization of the data platform or systems (23%).
“Data testing remains data engineers’ number one defense against data quality issues – and that’s clearly not cutting it,” said Lior Gavish, Monte Carlo CTO and co-founder. “Incidents fall through the cracks, stakeholders are the first to identify problems, and teams fall further behind. Leaning into more robust incident management processes and automated, ML-driven approaches like data observability is the future of data engineering at scale.”
Check out the full report, including commentary and reactions from nearly a dozen industry-leading data executives.
To learn more about how to both save time on data quality AND mitigate the negative consequences of bad data, fill out the form below to talk to us and set up a demo of our data observability platform.
Our promise: we will show you the product.
Read more posts.