Product demo.
  What is data observability?
  What is a data mesh--and how not to mesh it up
  The ULTIMATE Guide To Data Lineage
 Freshly’s Journey to Building Their 5-Layer Data Platform Architecture

Vitaly Lilich
Vitaly is the Senior Director of Data at Freshly.
Editor’s Note: Nestle acquired Freshly in October 2020.
For Freshly, food isn’t the only thing that needs to be delivered fresh and fast; our data also needs to be reliable, timely, and most importantly, accurate. To achieve this, we invested in a cloud-based data platform architecture (often referred to as a ‘modern data platform’) that enables us to deliver insights quickly to data consumers across the company.
Our modern data platform architecture story at Freshly started almost four years ago.
Our first step was to create a base foundation and integrated set of capabilities from which our team could quickly deliver valuable data products. These products included data science models for identifying customer lifetime value (CLV) or meal recommendations; applications such as demand and supply planners; and especially marketing analytics use cases.
Those and other use cases helped guide the formation of our stack as well as our team structure. Today, we have a data team of about 20 professionals organized among three teams. The first team is responsible for building the backend data infrastructure.
The second team, data services, are more application or front-end oriented. They are building internal apps, UIs, calendars, and other interfaces to make our data as accessible as possible.
The third team, our data consultants, are embedded across the business with the actual stakeholders who use our data. They’re dashboard capable, and can generate more simple reporting, but their main role is to keep a pulse on the needs of the business, help shape requirements, and work with the other two teams to ensure smooth data product delivery.
It’s an effective center of excellence model that has enabled us to build a powerful centralized platform but also be responsive to the business.
Now that you understand our use cases and team structure let’s dive into the evolution of our modern data stack, starting with where these stories typically start: the data warehouse.
Layer 1: The data repository
The main challenge is that we had our BI tool integrated directly with where our transactional data was landing in our operational database (Postgres). We were rapidly outgrowing this basic setup, which was not ideal for quick analysis and reporting.
We evaluated several solutions before quickly deciding to leverage Snowflake. Our team was attracted to its “set and forget” administration. Really, you just need to set clustering so that you can filter on the WHERE predicates and that’s it.
Other data warehouses you still have to vacuum, you have to analyze, you have to make sure the query planner is functioning the way it should. Also, Snowflake scalability and features like data sharing were very attractive.
Like most data teams, our data warehouse, Snowflake, acts as our sun. We built the rest of our data platform around this core building block.
- Recommendation: Emphasize power and simplicity.
- Recommendation: No need to switch over “cold turkey.” Compute and storage are cheap. You can load the data in your legacy as well as your target system until you are ready to switch over (keep the lights on your legacy system on for a bit after the switch too just in case).
- Recommendation: Better to start than to overcomplicate your transition, but it’s always good to think ahead about what other pieces you will likely need to add to your core platform and ensure your data warehouse has the ecosystem to support those ambitions.
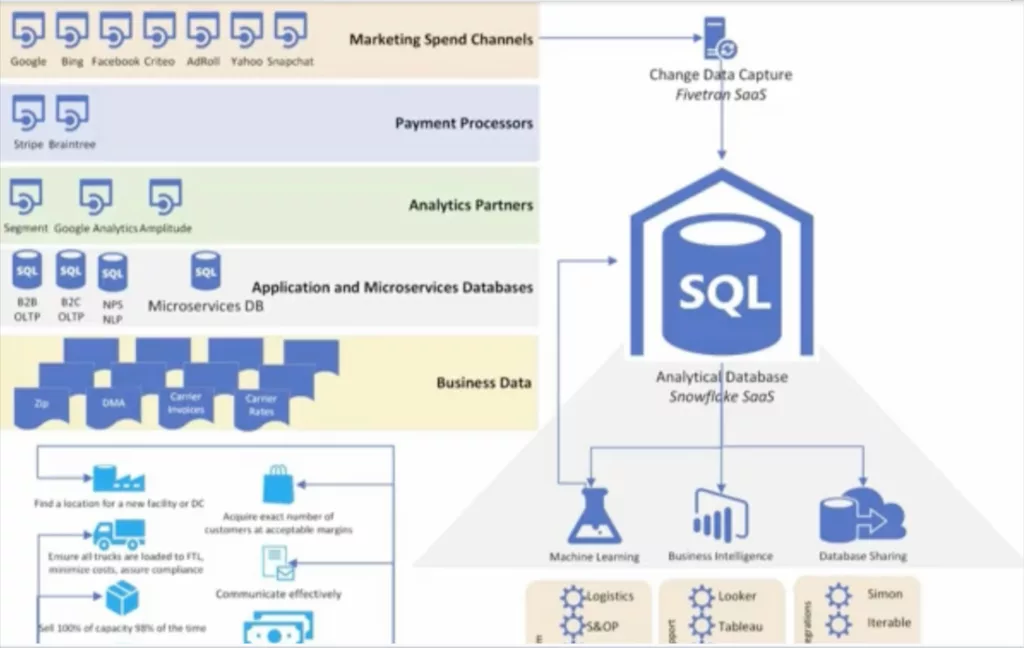
Layer 2: Ingestion or Change Data Capture
With Snowflake in place, the next decision was a CDC (change data capture) system, because we didn’t want to be in a position where we have to manually create hundreds of APIs for various data sources that needed to be fetched. It’s not necessarily that creating those APIs is difficult, but at some point you fall behind when all you’re doing is API labor instead of tasks adding value to the business.
Fivetran was the clear winner of our vendor evaluation because there were no issues syncing in our databases. We don’t have the ability to tap into a Postgres replication slot so we needed to use Xmin. Fivetran didn’t have any issues with that whereas with other vendors we did experience some records that would have been lost–maybe 10 to 20 a day.
So now in just a few clicks we are able to sync our monolith production database to Snowflake. We now also bring in records from a collection of microservices as our engineering team adapts a more modern architecture.
We are pulling data from quite a few external sources as well. We have more than 80 connectors into Snowflake, mostly of the usual marketing suspects—Salesforce, Google, Facebook, payment processors, CRM platforms, and many others.
We are also using Fivetran to parse and load data from dozens of Google Sheets into Snowflake. Usually, this comes into play when data isn’t available digitally but it’s needed for various reporting.
All of the data lands in a single query space–a data lake is an appropriate term here– where it is available for analysis, research, or further activities such as data marting and summary creation.
- Recommendation: Hardcoding your ingestion pipelines can take time that is more productively spent elsewhere.
- Recommendation: There are no raw data files in this setup. The data is in a transient state while FiveTran is transferring the data from the source to the destination. Consider if this is a fit for your specific needs and requirements.
Layer 3: Transformation
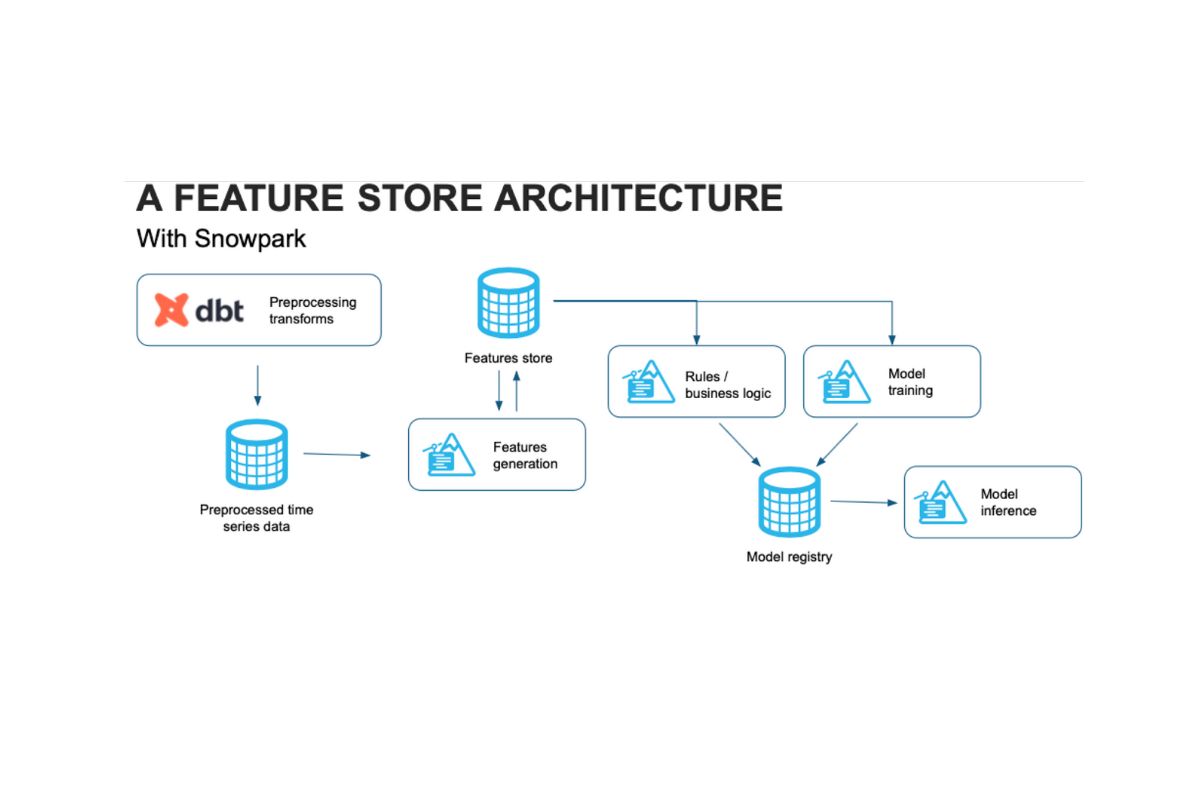
What came next was a lot of dbt work. We have dbt jobs that run after our data loads and organize little data marts giving us high-level marketing reports that marry multiple data sources into a single dashboard where that team can see important metrics like their cost per acquisition.
We have about 300 dbt models that generate around a thousand KPIs used in our weekly business review meetings.
This level of automation means we can spend more time building sophisticated models like our lifetime value, which we do at the user level. That gets very complicated, but by dropping it to the user level we can do more sophisticated analysis at the campaign level as well–which is the lever that can be pulled by the marketing team.
It allows the business to take a step back and understand, for example, our best audience with the highest lifetime value lives in this city. Now you can better target your marketing efforts or better leverage things like Google or Facebook lookalike audiences.
- Recommendation: Fivetran and dbt can be integrated and work really well together via the dbt Transformations feature. Fivetran can also act as the orchestration layer for dbt where you can schedule your jobs through a YAML file.
- Recommendation: A lot of business logic ends up coded into dbt. SQL is ubiquitous and these models can be easily deconstructed, but there is an agility/usability tradeoff. Keep an eye on when this may become a limiting factor.
Layer 4: Metrics, semantics and BI
Anytime somebody says, “I have a critical KPI that I need to monitor,” it goes into our metrics collection system. Then it becomes a table in Snowflake so we can expose it upstream.
This typically happens in Looker, but you can also use something simpler like a Google sheet. The key is to have a central layer where you are standardizing meaning so you can answer questions very quickly.
Having this central layer unlocks data self-service. LookerML is a feature that allows you to control how certain datasets are joined and metrics are expressed. It’s then locked down and surfaced for discovery through their Explorer feature.
This means for the folks who don’t have the skill set for independent analysis and are delivered a dashboard built to their requirements can still explore and evolve how they gain insights from the business without additional requests to the data team.
At the same time, because these metrics are locked, there aren’t multiple definitions of the same metric. Everyone is dragging and dropping the same pieces that are the same shape and called the same thing into their own puzzles.
- Recommendation: There is some risk for people to make mistakes in their self-serve analysis, but the productivity gain on both sides is valuable. This risk can be minimized by having solid semantic and metric layers that preserve a shared understanding and vocabulary across the business.
Layer 5: Data observability and governance/security
All of this speed and self-service access means little if our business colleagues don’t trust the data. This is especially important because at Freshly teams are making very data-driven decisions that impact how efficient we are at generating revenue or satisfying and retaining customers.
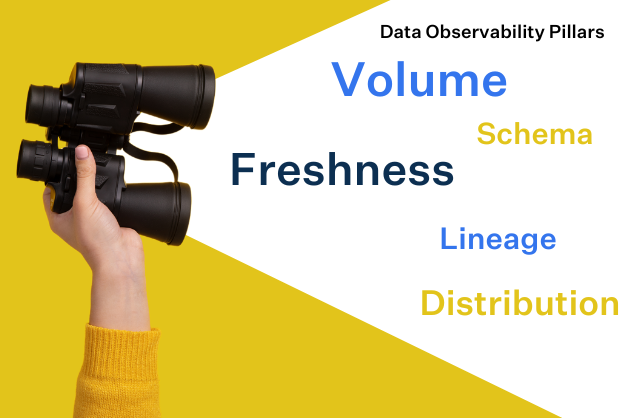
If data quality issues—the table hasn’t updated, there are too many or too few rows, the schema has changed, the data source has fed us garbage data with too many nulls, or whatever it might be– get to these end users then their trust in the data starts to fade. When that happens our ability to make an impact on business operations fades with it.
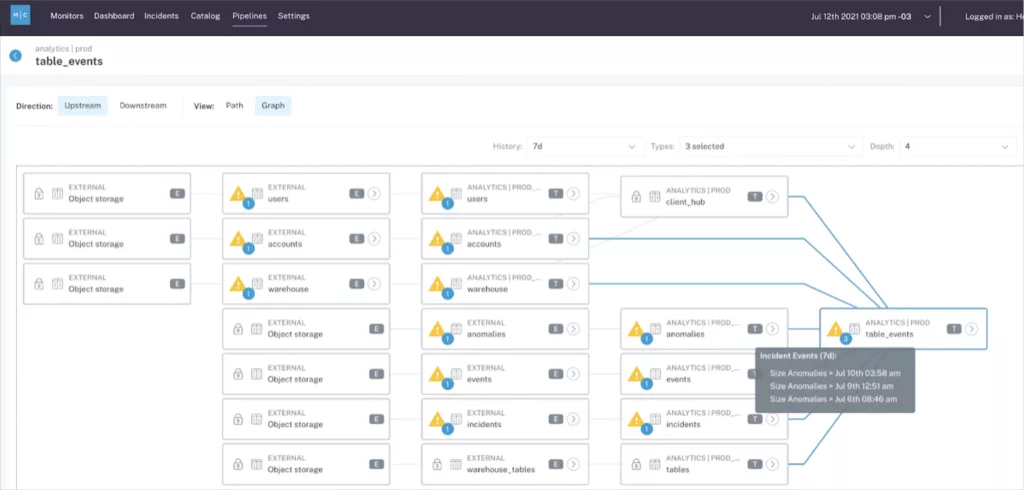
So we leverage the Monte Carlo data observability platform to understand when errors have occurred and get alerted via Slack before it hits our data consumers. With data lineage we can understand when a table busted, who it’s going to impact and proactively alert them that a report is not up to date and that we’re working on a solution. This way no decisions get made on bad data and our team becomes a proactive part of the solution.
As previously mentioned, we mirror and sync our production database into Snowflake. That means if our service is updated and changes how it emits data, that reverberates across our pipelines and dashboards.
Or it would if we weren’t using Fivetran and Monte Carlo. When there is a schema change in our production database, Fivetran automatically rebuilds or materializes the new piece of data in a new table. Monte Carlo then alerts us that a schema change has occurred and we are able to make sure any resulting data downtime is negligible.
The other critical piece of this layer is our security and governance solution, SatoriCyber. It sits as a thin proxy in Snowflake and does two vital things for us. The first is it protects our sensitive data. We can see queries coming in and organize policies around who can see what based on pre-set rules. For example, people in this group should not see any financial or personal data. It’s then redacted in Looker and Snowflake.
SatoriCyber is also a cataloging system. It will mark fields based on its AI algorithm as personal data, financial data, or whatever else you want to create based on a custom taxonomy. It enables us to be truly ELT so we don’t have to cleanse the data before it lands in Snowflake.
- Recommendation: If you are going to have a fast and automated modern data platform, you need your data quality solution to be fast and automated too. Just like building APIs takes time that can be better spent elsewhere, so too is all the time you are spending writing checks and unit tests in your pipelines. Data observability leverages machine learning to provide better coverage at a fraction of the time you spend writing and evolving your testing regime.
- Recommendation: You should consider a protection layer and a data quality layer as essential components of your stack.
Future Layer: activation and reverse ETL
Looking to the future we may start investigating a reverse ETL solution. There is value to having data piped into the systems that our business users leverage. Currently, we are accomplishing this with some API work and a custom framework that allows us to pump events and properties into Iterable, for example.
The modern data stack accelerates time to insight
Before building our modern data platform, we actually had an operations person click across consoles every day to collect all the marketing data from each platform, organize it in the Google sheet, and then present it upstream to the marketing team. That is now done automatically. That means we can turn things around very quickly when requests come in for research or analysis.
My advice to data teams would be to look at what you have today. Talk with stakeholders, understand where your gaps are, and don’t be afraid of tearing things down to build them right. It is rarely as complicated as it seems on the surface. Keep your POCs limited to a few key vendors and make them time efficient.
The honeymoon period for data leaders is short. Moving to a modern platform will allow you to demonstrate value quickly and make time-to-insight a competitive edge for your organization.
Interested in learning more about data observability’s role within a modern data platform? Check out Monte Carlo for yourself by scheduling a time using the form below.
Our promise: we will show you the product.
Read more posts.