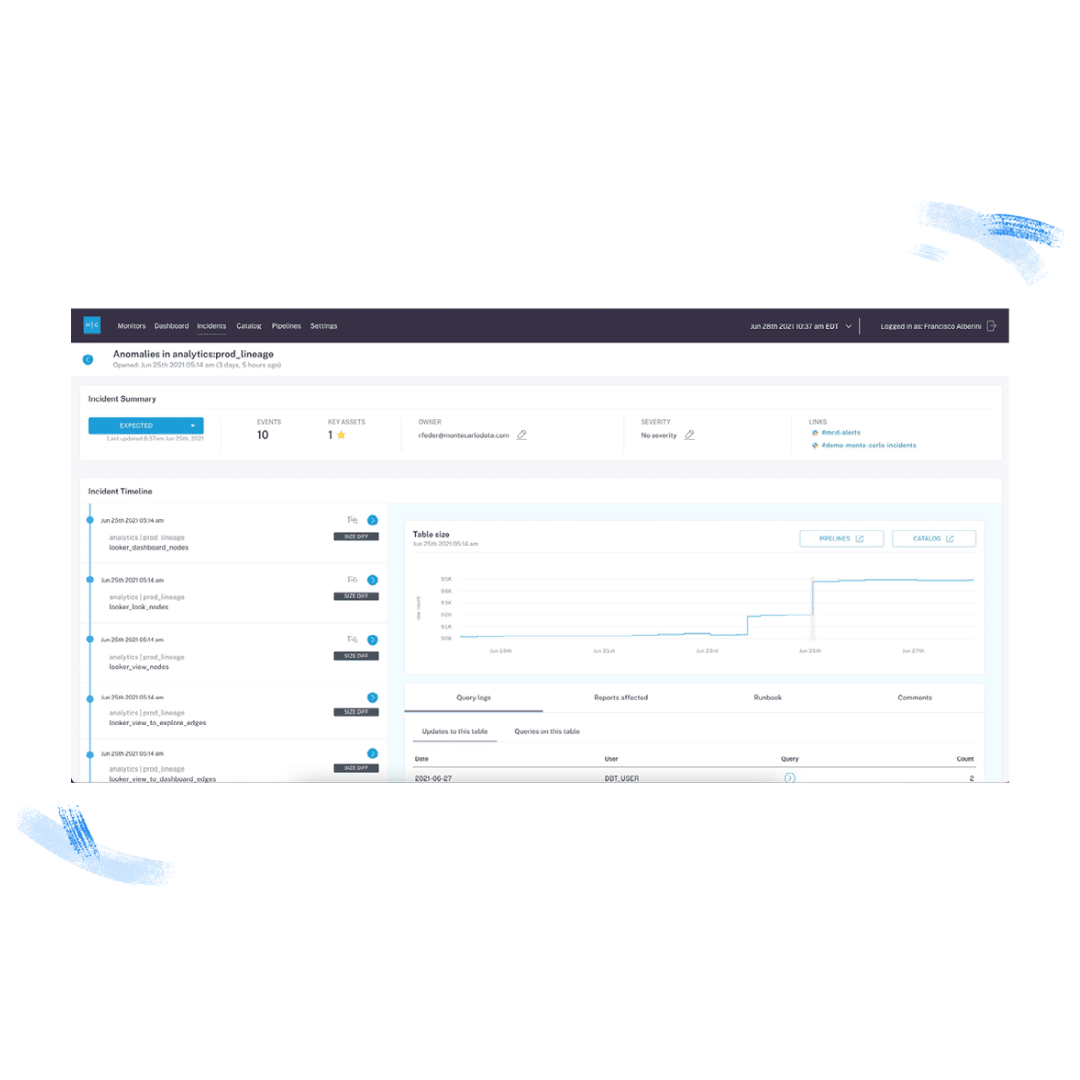
Product demo.
  What is data observability?
  What is a data mesh--and how not to mesh it up
  The ULTIMATE Guide To Data Lineage
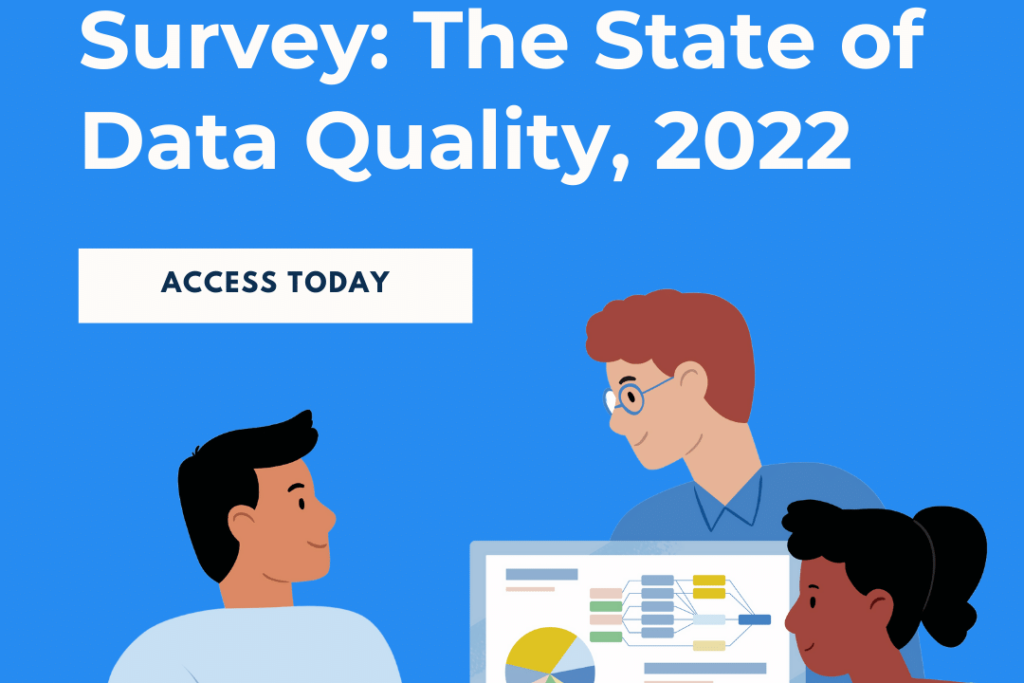
 Data Engineers Spend Two Days Per Week Firefighting Bad Data, Data Quality Survey Says

Michael Segner
Michael writes about data engineering, data quality, and data teams.
New! Check out our latest 2023 data quality survey.
Just about everyone who talks about data quality (including us!) cites the Gartner survey that poor data quality costs organizations an average $12.9 million every year. It’s a great finding to shed light on the business cost of bad data, but it was time to dig a bit deeper.
So we decided to partner with Wakefield Research to survey more than 300 data professionals about:
- The details around the number of data incidents and how long it takes to detect and resolve them,
- The impact of those incidents across the business, and
- Trends in the overall life of the data engineer (remote work, working for FANNG, etc)
We also asked top data leaders to react and comment on the findings including:
- Chad Sanderson, Head of Product Data Platform, Convoy
- Brandon Beidel, Data & Product, Red Ventures
- Adam Woods, Chief Customer Officer, Choozle
- Marion Rybnikar, Senior Director of Data Strategy & Governance
- Atul Gupte, Product Lead, Instacart
- Manu Raj, Senior Director of Data Platform & Analytics, PagerDuty
- Dan Delorey, VP of Data, SoFi
- Edward Kent, Principal Developer, AutoTrader UK
- Gopi Krishnamurthy, Head of Product Engineering & Tech, Clariness
- Rick Saporta, Head of Data Strategy & Insights, The Farmer’s Dog
- Jacob Follis, Chief Innovation Officer, Collaborative Imaging
- Joe Reis, CEO and co-founder, Ternary Data
Key Findings
The resulting 2022 data quality survey found data professionals are spending a whopping 40% of their time evaluating or checking data quality and that poor data quality impacts 26% of their companies’ revenue, among other key findings.
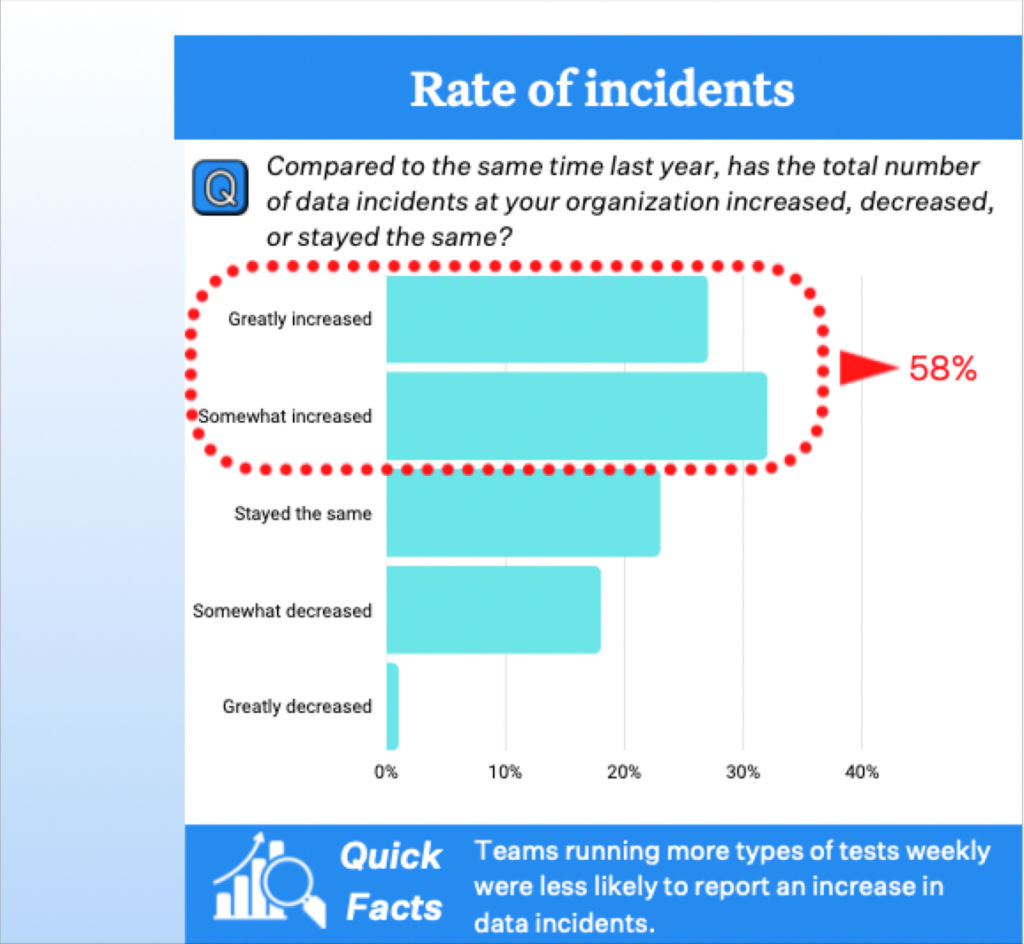
Getting a bit more into the weeds, we uncovered that 75% of respondents take four or more hours to detect a data quality incident and about half said it takes an average of nine hours to resolve the issue once identified. Worse, 58% said the total number of incidents has increased somewhat or greatly over the past year, often as a result of more complex pipelines, bigger data teams, greater volumes of data, and other factors.
Additional findings
- The average organization experiences about 61 data-related incidents per month, each of which takes an average of 13 hours to identify and resolve. This adds up to an average of about 793 hours per month, per company.
- Nearly half of respondent organizations measure data quality most often by the number of customer complaints their company receives, highlighting the ad hoc – and reputation damaging – nature of this important element of modern data strategy.
- Nearly half said business stakeholders are impacted by issues the data team doesn’t catch most of the time, or all the time.
- Respondents that conducted at least three different types of data tests for distribution, schema, volume, null or freshness anomalies at least once a week suffered fewer data incidents (46) on average than respondents with a less rigorous testing regime (61). However, testing alone was insufficient and stronger testing did not have a significant correlation with reducing the level of impact on revenue or stakeholders.
- Within six months, nearly 90% of organizations will invest, or plan to invest, in data quality.
Be sure to check out the full findings and commentary from the experts!
Interested in learning how to reduce your data downtime with data observability and data lineage? Schedule a time to talk with us using the form below.
Our promise: we will show you the product.
Read more posts.