Product demo.
  What is data observability?
  What is a data mesh--and how not to mesh it up
  The ULTIMATE Guide To Data Lineage
 What is Data Reliability?

Barr Moses
CEO and Co-founder, Monte Carlo. Proponent of data reliability and action movies.
Data reliability refers to how often your data and tables reflect reality for a given use-case. Unlike data quality which refers to the accuracy of data at a moment in time, data reliability is a measure of accuracy and completeness against a predetermined standard over a period of time.
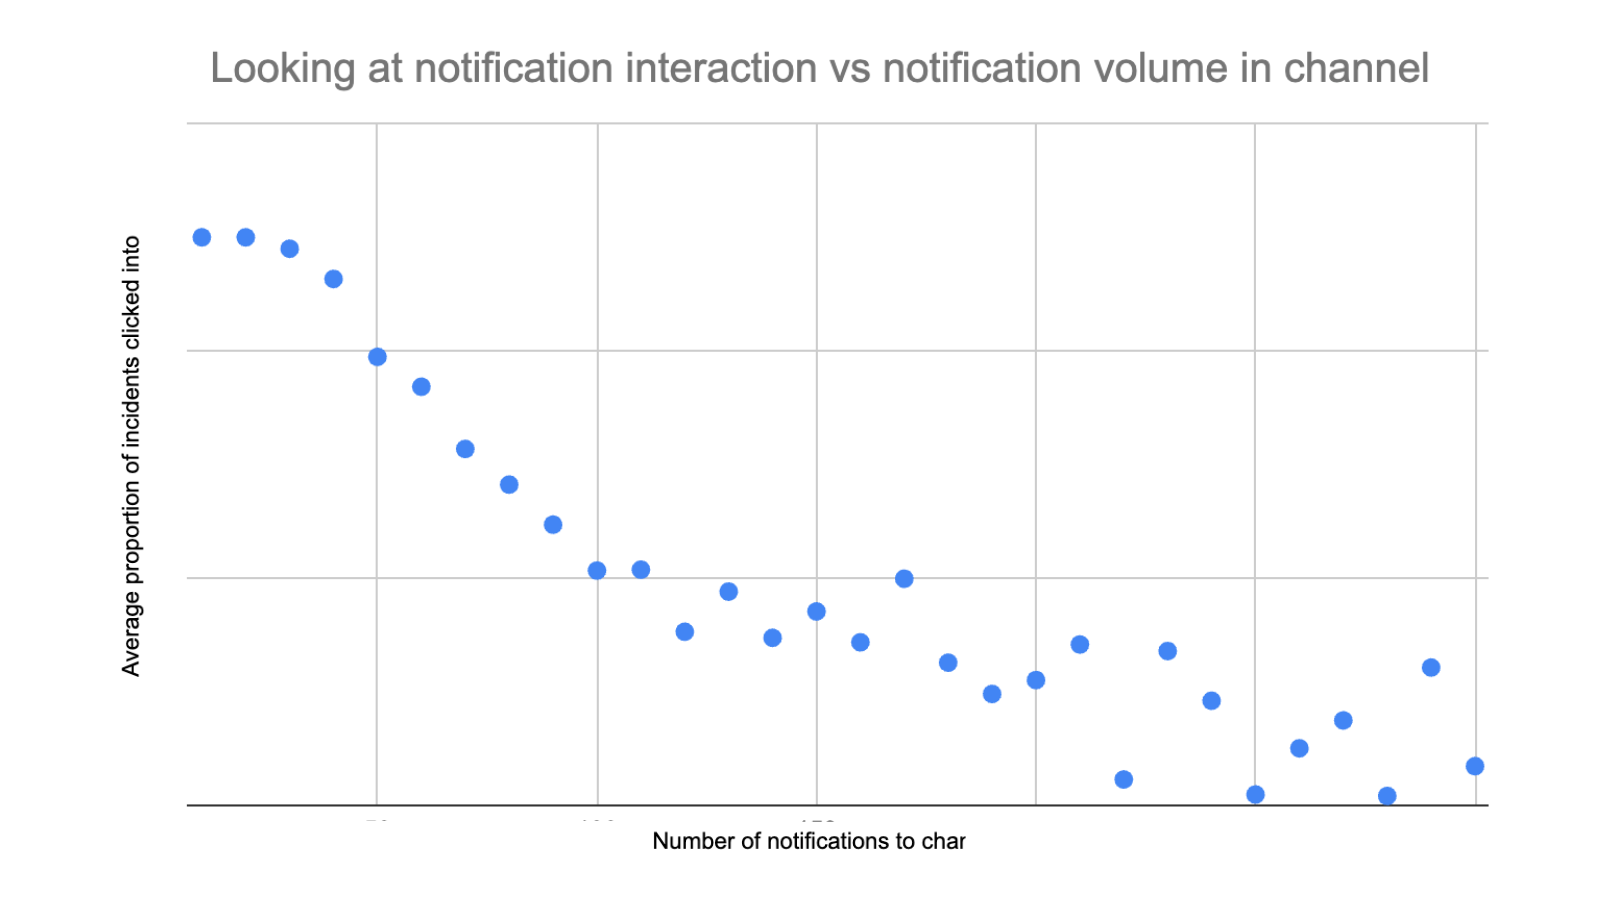
Over the past several years, I’ve spoken with over 150 data leaders about the reliability of their data, ranging from a few null values to wholly inaccurate data sets. Their individual issues ran the gamut, but one thing was clear: there was more at stake than a few missing data points.
One VP of Engineering told me that before his team started monitoring for data downtime, their entire database of customer information was 8-hours off, revealing massive tech debt. Making matters worse, they didn’t catch this issue for several months, only identifying it during a data warehouse migration. While it ended up being a relatively simple fix (and an embarrassing discovery), it went undiscovered for far too long—and their revenue suffered in the process.
This story is a common one — and no company is spared.
In this blog, we’ll take a deep dive into the building blocks of reliable data to understand what it is, where it falters, and what you can do to improve your data reliability at any scale.
Table of Contents
How DevOps informed the modern data reliability movement
As data professionals, we can learn a lot from software engineering when it comes to building robust, highly available systems. In a previous article, I discussed why data reliability is a must-have for data teams, and here, I share how we can apply this concept in practice through engineering operations.
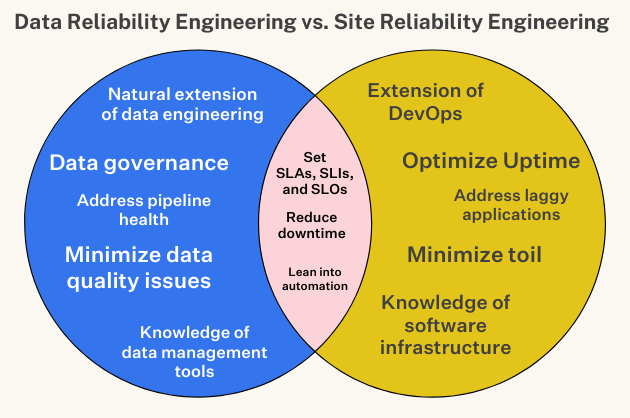
Coined by Google SVP Benjamin Treynor Sloss in the early 2000s, Site Reliability Engineering, a subset of DevOps, refers to “what happens when you ask a software engineer to design an operations function.” In other words, site reliability engineers (SREs for short) build automated software to optimize application uptime while minimizing toil and reducing downtime. On top of these duties, SREs are known as the “firefighters” of the engineering world, working to address hidden bugs, laggy applications, and system outages.
However, while firefighting is certainly a core responsibility, SREs are also charged with finding new ways to thoughtfully manage risk by understanding the opportunity cost for new features and other innovations. To drive this data-driven decision making, establish clear Service Level Objectives (SLOs) that define what this reliability looks like in the real world as measured by Service Level Indicators (SLIs).
Once SLOs and SLIs (say that 10 times fast…) are established, SREs can easily determine this balance between reliability and risk. Even with the smartest solutions and most experienced SREs on tap, achieving 100% system uptime is a non-zero possibility. Innovation relies on iteration, and the only way to eliminate downtime is to stay static, but that doesn’t give you the competitive edge. As one of my SRE friends aptly noted: “it’s not a matter of if the site will go down, it’s a matter of when.”

Now, as data systems reach similar levels of complexity and higher levels of importance in an organization, we can apply these same concepts to our field as data reliability — an organization’s ability to deliver high data availability and health throughout the entire data life cycle.
In the same way we meticulously manage application downtime, we must focus on reducing data downtime — periods of time when data is inaccurate, missing, or otherwise erroneous.
Common challenges of data reliability
There have been a number of major application downtime outages for companies as varied as GitHub, IBM, DoorDash, and Slack — and data downtime is a similarly serious threat.
Data downtime can occur for a variety of reasons at the the data, system, and code level, but the primary issues boil down to a few common issues:
- The data is stale, inaccurate, duplicative, or incomplete.
- The model fails to reflect reality.
- Or the transformed data is impacted by anomalies at any point during production.
Each of these issues needs to be monitored and resolved effectively to maintain a healthy and reliable pipeline. But the bigger your data gets, the greater that challenge becomes.
So, in order to detect and resolve bad data effectively in a scaling environment, data teams will need to rely on a modern approach to data quality management.
Data reliability requires modern data quality management
Over the past several years, I’ve spoken with over 150 data leaders about the reliability of data, ranging from a few null values to wholly inaccurate data sets. Their individual issues ran the gamut, but one thing was clear: there was more at stake than a few missing data points.
In the same way that SRE teams are the first to know about application crashes or performance issues, data teams should be the first to know about bad pipelines and data quality issues, too. Only six years ago, data loss and downtime cost companies a cumulative $1.7 trillion annually; in an age where data is ubiquitous and data management tools haven’t necessarily caught up, these numbers have likely gotten worse.
The challenge with traditional data reliability practices like data quality monitoring and data testing is that they don’t extend into the data, system, and code layers to identify why the data is broken, and they generally lack the automation required to make these practices scalable or effective long term.
To avoid data downtime, it’s important to have full observability over your data throughout the entire lifecycle of data — with automated monitoring all the way from source to consumption. Strong pipelines lead to accurate and timely insights, which allows for better decision making, true governance, and happier customers.
Data observability extends the value of traditional data quality practices into the data, system, and code levels of your data estate to understand not just when but why data breaks; and marries that with resolution features like automated lineage to make those monitors more actionable.
So, no that we understand the tools you need, let’s consider who’s responsible.
Who is responsible for data reliability?
Sometimes a data platform team will manage data reliability as part of the larger environment, sometimes a data reliability engineer, a data observability team, or a data governance team will take responsibility as part of a specialized role. And in the case of a data mesh, oftentimes a domain team will be responsible for data reliability as part of managing their domain pipelines with the help of infrastructure that’s been provided by a centralized platform team.
However, regardless of who is personally responsible for monitoring and fixing a given problem, data reliability is never the responsibility of a single person or team. Managing data reliability requires cultural support and change supported by scalable data quality management tooling.
Of course, while data reliability is in some sense the responsibility of the entire team, data reliability management will vary based on the structure of your data team.
How to measure data reliability
You don’t know what you don’t measure. But measuring data reliability goes beyond assessing completeness and accuracy, it’s crucial to move beyond measuring data quality at a specific point in time and space. You need to understand how your data reliability is trending over time.
The best way to measure data reliability is to measure the downtime of a given data asset or table. That means understanding how often that asset is unusable due to some inaccuracy in the data or break in the pipeline.
Fortunately, the formula to calculate data downtime is relatively simple, but you’ll need to have a few pieces of information handy: the number of incidents over a given time period, how long it takes your team to detect the average incident, and how long it takes your team to resolve the average incident.
Once you have that information, you can follow the formula below:
Number of incidents x (average time to detection + average time to resolution)
Other ways to measure data reliability more specifically include measuring qualitative metrics like consumer satisfaction or how often a data asset is unusable over a given time. To do this, focus on establishing expected levels of quality and service.
Many data leaders tell us their data scientists and data engineers spend 30 percent or more of their time firefighting data downtime. That’s data that could be much better spent delivering new value for stakeholders.
So, it’s important to understand how much data downtime you have—and the cost of those broken pipelines over time. Check out the Data Quality ROI guide below for a deeper dive into measuring and how to calculate the dollar value of your data quality practices.
Data quality vs data reliability
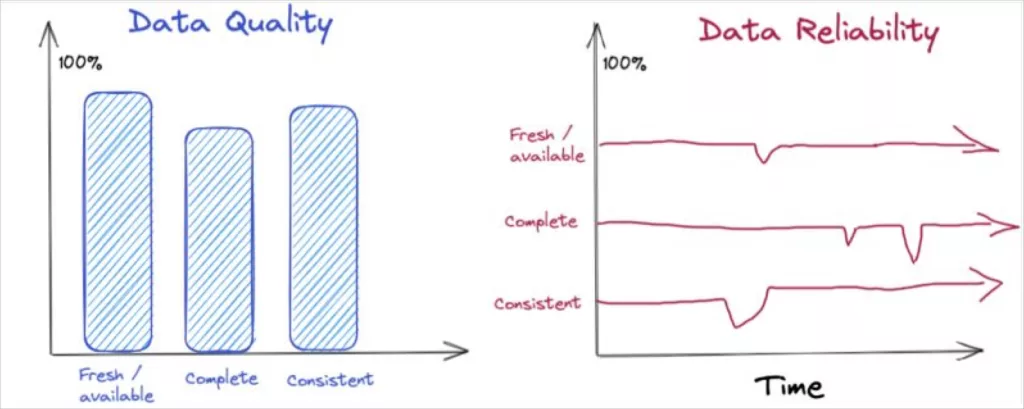
Data quality is often expressed in the six dimensions of accuracy, completeness, consistency, timeliness, validity, and uniqueness. Those six dimensions data quality typically measure the data and it’s fitness for a specific use at a specific moment in time.
Data reliability requires you to think beyond a point in time, and consider how the quality changes over time in a variety of real-world conditions.
For example, the quality of an airline might be measured based on its timeliness (percent of flights on-time), safety (major incidents) and food service approximating that of a diner. But in order for the airline to be reliable, it’s expected to maintain those levels of quality consistently over time, across various routes, weather conditions and holiday weekends.
Similarly, a data product’s quality might be assessed by its availability at 9am, the completeness of records, and its consistency versus a source-of-record. For it to be reliable, you must assess whether it maintains these service levels over time, across holiday traffic spikes and product launches.
In solving for data reliability you must not simply measure data quality (at a point in time and space), but also establish expected levels of quality and service (i.e. how quickly you’ll communicate and respond to incidents), and have the toolkit to rapidly diagnose and resolve data incidents.
How do I make my data reliable?
I propose two primary ways data teams can achieve high data reliability at their organization: 1) set data SLOs and 2) invest in an automated solution that reduces data downtime.
Leverage a data observability platform to set SLOs and SLIs
Setting SLOs and SLIs for system reliability is an expected and necessary function of any SRE team, and in my opinion, it’s about time we applied them to data, too. Some companies are already doing this, too.
In the context of data, SLOs refer to the target range of values a data team hopes to achieve across a given set of SLIs. What your SLOs look like will vary depending on demands of your organization and the needs of your customers. For instance, a B2B cloud storage company may have an SLO of 1 hour or less of downtime per 100 hours of uptime, while a ridesharing service will aim for as much uptime as humanly possible.
Here’s how to think about defining your data SLIs. In previous posts, I’ve discussed the five pillars of data observability. Reframed, these pillars are your five key data SLIs: freshness, distribution, volume, schema, and lineage.
- Freshness: Freshness seeks to understand how up-to-date your data tables are, as well as the cadence at which your tables are updated.
- Distribution: Distribution, in other words, a function of your data’s possible values, tells you if your data is within an accepted range.
- Volume: Volume refers to the completeness of your data tables and offers insights on the health of your data sources.
- Schema: Schema changes often indicate broken data.
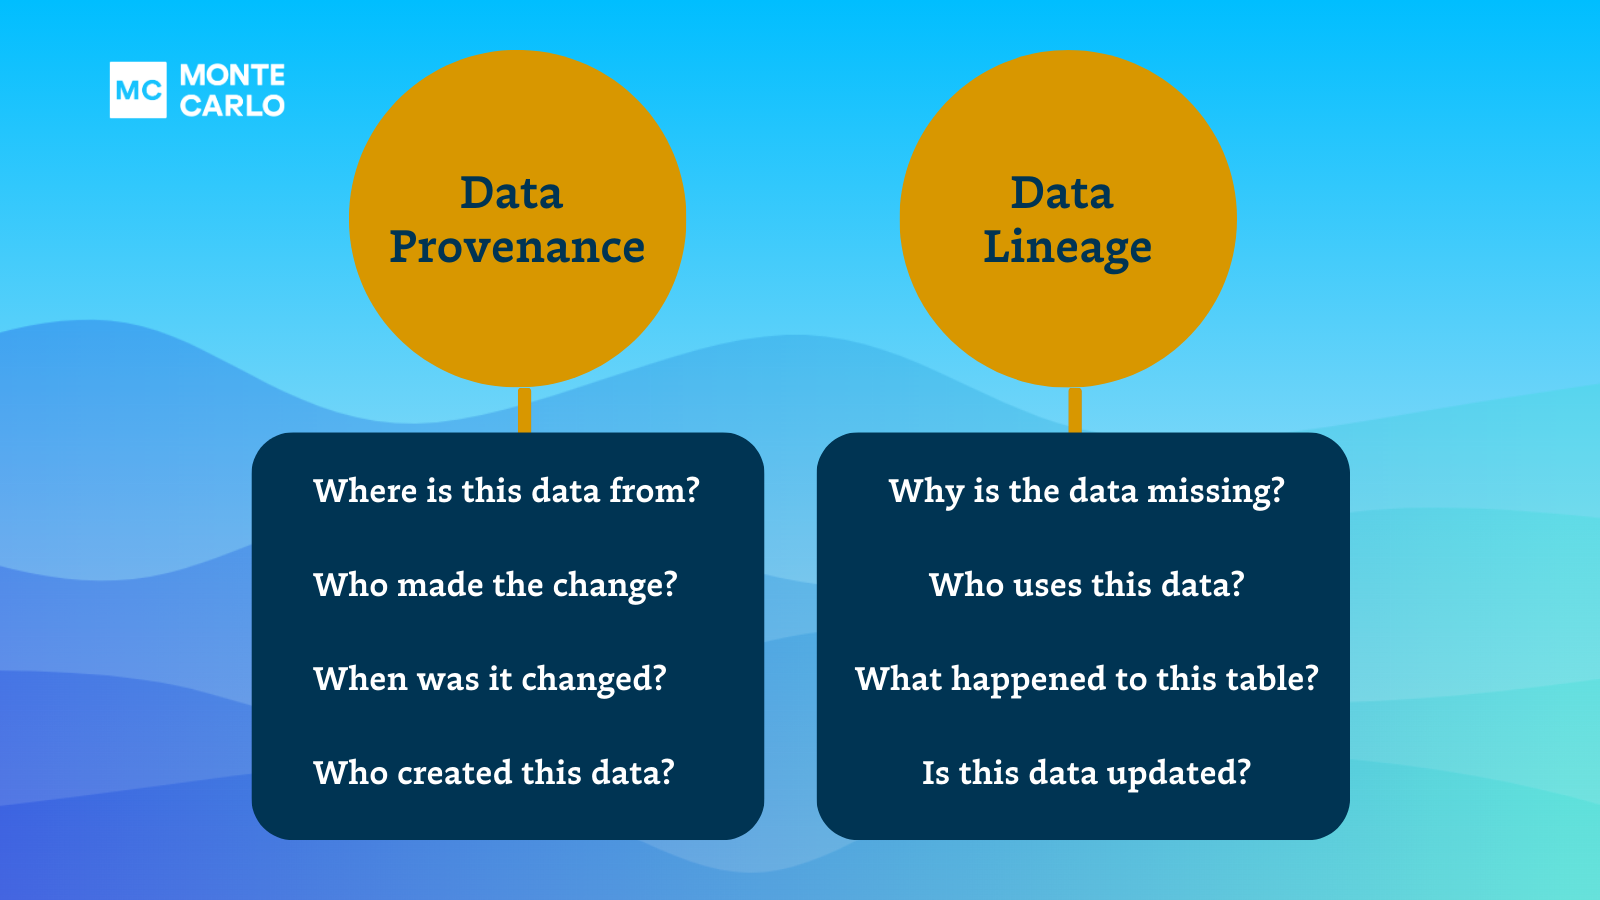
- Lineage: Data lineage provides the answer by telling you which upstream sources and downstream ingestors were impacted, as well as which teams are generating the data and who is accessing it.
Many data teams I work with are excited at the prospect of integrating with the latest and greatest data infrastructure and business intelligence tools but, as I’ve written previously, such solutions are only as good as the data that powers them. These SLIs will enable you to better understand how good that data actually is and whether you can trust it.
Shift data reliability left and prevent issues before they occur
While you will never out-architect bad data, you can improve the reliability of data by reducing the number of data incidents.
First identify your key datasets; these are the tables that are queried most frequently and have the largest impact on downstream consumers. Then consider whether it makes sense to deploy preventive techniques such as data contracts or circuit breakers. Data contracts prevent downstream incidents caused by unexpected schema changes while circuit breakers stop the flow of data into the data warehouse if it doesn’t meet set criteria.
These best practices can be time intensive and when used incorrectly may actually introduce more data downtime. That’s why you will want to focus on your production grade pipelines and most valuable data products.
Establish ownership
This two word phrase wins the contest for, “easier said than done.” Most data leaders understand clear lines of ownership enable quick action to be taken and set the stage for accountability. What is routinely underestimated is the need for layers of ownership.
There needs to be ownership for data quality at the organizational level, domain/project level, and even pipeline/table level. These ownership lines need to be traced back to owners of the business processes they support. There needs to be mechanisms for when these spheres of ownership conflict. If there is a key asset table that is leveraged by data products in both marketing and finance, who owns it?
Our recommendation for these challenges?
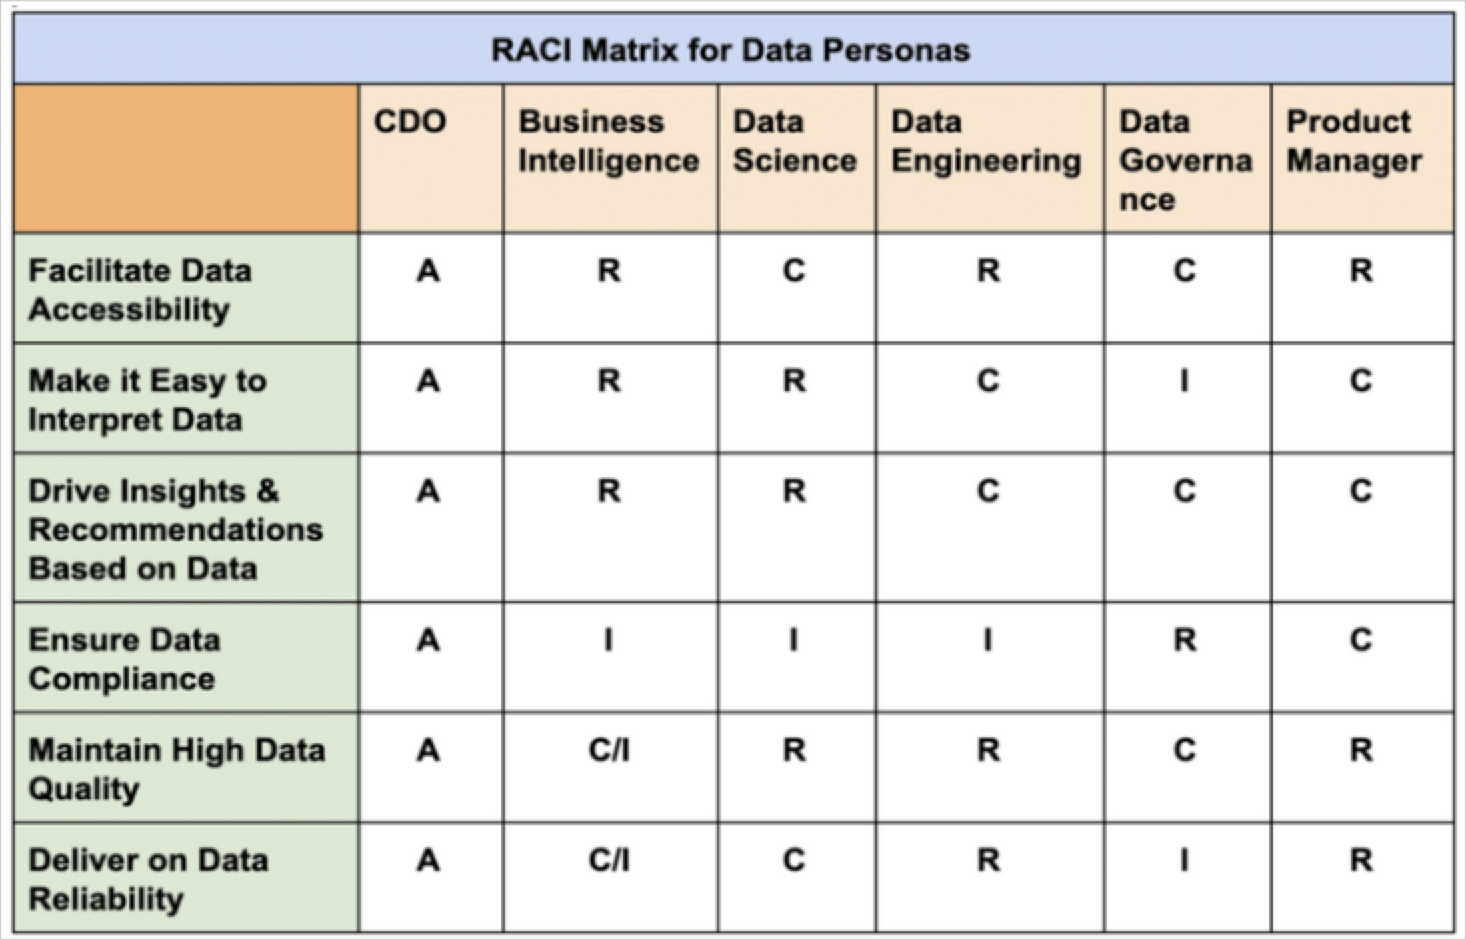
- Create a data team RACI for data quality.
- Create SLAs (more on this later) that establish data and business team ownership for key tables and data products. Hint: data product managers are useful here.
- Where ownership lines overlap, create clarity by appointing a “custodian” who has primary ownership, but must consult other data team stakeholders for any changes.
Document assets
It’s no data engineer’s favorite task, but mistakes get made when good documentation doesn’t exist. Additionally, documentation enables discovery and ultimately self-service.
The challenge is your ability to pipe data is virtually limitless, but you are constrained by the capacity of humans to make it sustainably meaningful. In other words, you can never document all of your data, and rarely will you have as much documentation as you’d like.
So how can you solve this problem? Some of our suggestions include:
- Iterate and automate: One company decided to hold off on a column level approach for their documentation since columns are often self-describing. Instead they focused on tables, views, and schemas on their key assets for a “minimum viable product.” They used their own system as well as Monte Carlo to identify key data assets and owners so they knew who to bother about documentation.
- Tie it to the data onboarding process: Documentation is often everyone’s responsibility and therefore becomes no one’s responsibility. Some of the organizations with best-in-class data asset documentation are those that put mechanisms in place that only allow for key datasets to be added to their warehouse/lake environment once documentation is in place.
- Measure your documentation levels: Create a dashboard or otherwise track the percentage of your data assets that are appropriately documented. You can also use an overall data product maturity scorecard like the one below from former New York Times senior vice president of data and insights, Shane Murray. One of the key columns for measuring the maturation was the documentation level.
- Leverage and integrate with other sources: There are multiple solutions inside and outside of the modern data stack that can contain helpful context on data assets. For example, one company has integrated documentation coming in from dbt within the Catalog plane of the Monte Carlo platform. Others leverage data catalog solutions (some of which are experimenting with Chat-GPT for automating documentation ?) Another solution is to integrate with or train data consumers to leverage what is typically an unused goldmine of information about a company’s data: Slack. A quick Slack search for a table name before asking a question can save tons of time.
Check out how Cribl approaches documentation and creating a data driven culture.
Conduct post-mortems
Post-mortems can contribute greatly to data reliability as they help ensure incidents don’t happen again. A few post mortem best practices include:
- Frame everything as a learning experience: To be constructive, post-mortems must be blameless (or if not, blame aware).
- Use this as an opportunity to assess your readiness for future incidents: Update runbooks and make adjustments to your monitoring, alerting, and workflow management tools.
- Document each post-mortem and share with the broader data team: Documentation is just as important as any other step in the incident management process because it prevents knowledge gaps from accruing if engineers with tribal knowledge leave the team or aren’t available to help.
We would also recommend these post mortem templates from Github.
Use data health insights to understand hot spots
Pareto’s principle–80% of the consequences are the result of 20% of actions– is alive and well in the data engineering field. In this specific case, it is data quality issues and tables/pipelines.
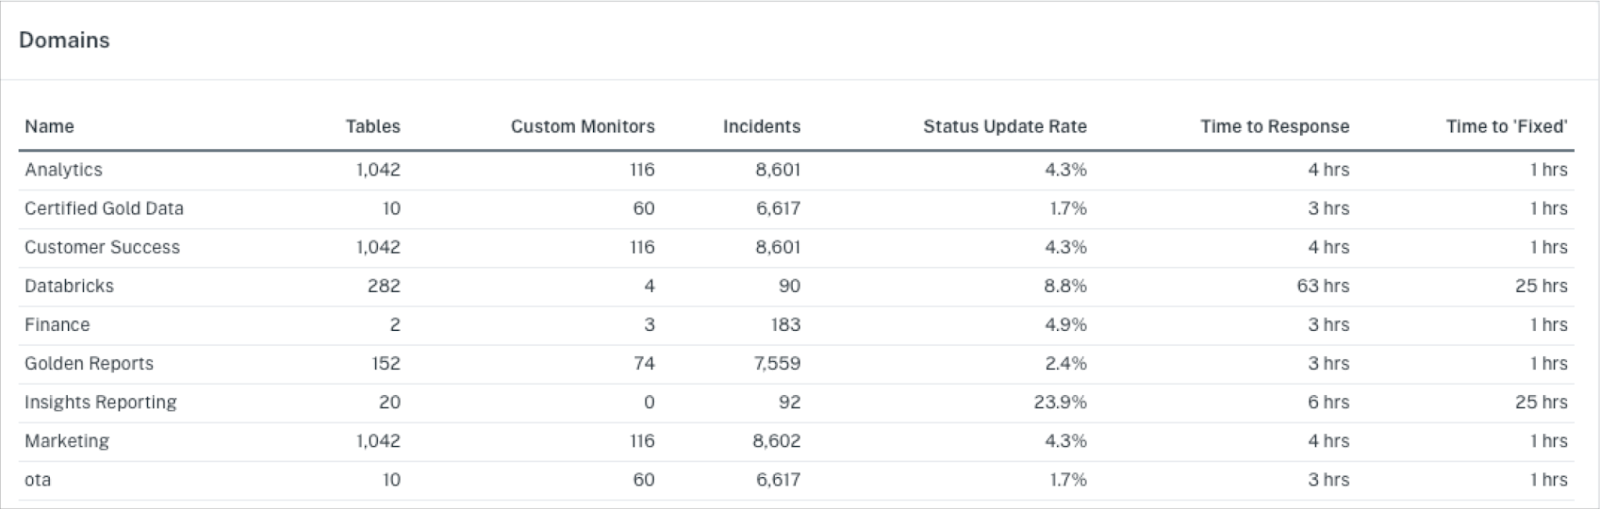
In other words, it’s a good rule of thumb to assume 20% of your tables are creating 80% of your data quality issues. Cross-referencing those problematic hot-spots with your list of key assets is a good place to concentrate your investment of data quality resources. While that can be easier said than done, items like a data reliability dashboard can make this optimization a reality.
You don’t have to limit Pareto’s principle to tables either. You can splice and dice data quality metrics by domains because rest assured there is one department within your organization that is on fire more frequently than the rest.
This focus and data quality optimization was the approach taken by Brandon Beidle, Red Ventures Director of Data Product. He said:
“The next layer is measuring performance. How well are the systems performing? If there are tons of issues, then maybe we aren’t building our system in an effective way. Or, it could tell us where to optimize our time and resources. Maybe 6 of our 7 warehouses are running smoothly, so let’s take a closer look at the one that isn’t. Having a record also evolved the evaluations of our data team from a feeling, ‘I feel the team is/isn’t doing well,’ to something more evidence-based.”
Data health insights can also help optimize your data operations by preventing table versioning issues or identifying degrading queries before they become problematic.
Invest in data reliability
The truth is — in one way or another — you already are investing in data reliability. Whether it’s through manual work your team is doing to verify data, custom validation rules your engineers are writing, or simply the cost of decisions made based on broken data or silent errors that went unnoticed. And it’s a hell of a price to pay.
But there is a better way. In the same way that site reliability engineers use automation to ensure application uptime and improve their efficiency, data teams should also rely on machine learning-enabled platforms to make data reliability easier and more accessible — leading to better decisions, better trust, and better outcomes.
Like any good SRE solution, the strongest data reliability platform will give you automated, scalable, ML-driven observability into your pipelines — making it easy to instrument, monitor, alert, troubleshoot, resolve, and collaborate on data issues — ultimately reducing your data downtime rates to begin with and thereby increasing the reliability of your overall data pipelines.
Now, with clear SLIs, SLOs, and a new approach for data reliability in tow, we can finally leave firefighting to the professionals.
If you want to learn more about the reliability of data, reach out to Barr Moses.
Read more posts.
![[VIDEO] Introducing Data Downtime: From Firefighting to Winning](https://www.montecarlodata.com/wp-content/uploads/2020/08/My-Post-10.png)