Product demo.
  What is data observability?
  What is a data mesh--and how not to mesh it up
  The ULTIMATE Guide To Data Lineage
 Measuring Data Quality: Key Metrics, Processes, and Best Practices

Lindsay MacDonald
Lindsay is a Content Marketing Manager at Monte Carlo.
Today, the term “data-driven” is everywhere. Every company is “data-driven,” every decision is “data-driven,” even our daily lives, complete with recommendations and notifications from our wearable watches, rings, and phones, are driven by the data we create and consume.
But just because everything is “data-driven” doesn’t guarantee that the data doing the driving is reliable.
Reliability is the first step to unlocking real value from your data. But what does reliable data actually look like? How do you build data quality standards – and how do you measure and maintain them?
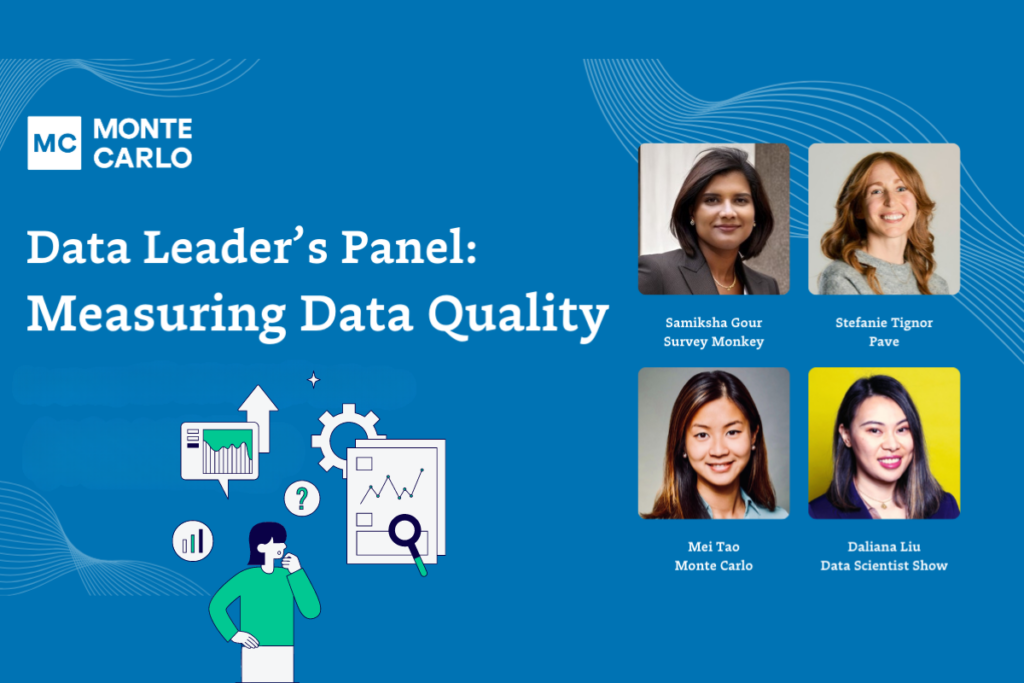
We brought together data leaders from across the industry, including Samiksha Gour, Senior Data Engineering Manager, at SurveyMonkey, Stefanie Tignor, Head of Data at Pave, Mei Tao, Product at Monte Carlo, and Daliana Liu, Host of The Data Scientist Show to learn their answers to these questions. Read on to hear how their teams measure data quality and prove that value across their organizations.
Table of Contents
Why is measuring data quality important?
Consider the following scenario:
Your CFO approaches you with a seemingly simple question: “How’s the health of our data?”
You respond saying “It’s good! Our data quality is high and we’re maintaining active pipeline maintenance.”
Your CFO says “That’s great. How do you know the data quality is high?”
And that’s the tricky part.
What does “good data quality” actually mean?
Knowing the right data quality metrics is imperative to building trust with downstream consumers and stakeholders. And that means defining the exact metrics that contribute to data quality—and then building a framework for measuring those metrics on a regular basis.
So, now let’s dive into what those metrics and frameworks might look like in practice.
Evangelizing the importance of data quality
Not every data team views data quality with the same degree of importance. Oftentimes, data engineers can become so bogged down with competing priorities that data quality will take a back seat to seemingly more urgent priorities. But if you don’t get the data right first, whatever comes after it isn’t likely to be right either.
That’s why winning hearts and minds is the first step to measuring and optimizing data quality. And that all starts with your data quality management style.
Samiksha said there are four data quality management styles she’s encountered during her time as a data professional:
- Unaware: “People across the organization just don’t understand the impact of data quality.”
- Reactive: “As data issues arise, data teams are spending time fixing them in siloes.”
- Proactive: “There is clear ownership between business and engineering stakeholders, and there are data quality measurement processes in place.”
- Optimize: “Companies actually have dedicated data quality management roles and accountability for data is company wide. There are data quality standards and metrics, they’ve invested in tools and processes, and the entire organization is invested in the data’s quality.”
It takes widespread internal buy-in to be able to “Optimize” data quality management. It’s not just the data engineering team that needs to understand the value of data quality – it’s also data producers upstream and data consumers downstream as well. When the entire organization understands the value of data quality, the teams maintaining the data quality practice day-to-day will feel more empowered by the impact of their work.
“That helps build trust,” says Samiksha. “Trust is something that’s very hard to gain and easy to lose. With observability, that confidence is built in.”
Stefanie agrees. “We want as many people as possible with diverse backgrounds and skill sets to try to use the data internally,” she says. “Non-technical stakeholders use data and look at it and think about it in such a different way. For us, they’re often the ones that catch data quality issues because they’re doing something different with the data. Data democratization is huge.”
“That also helps promote data literacy across the organization,” adds Samiksha.
It’s this combination of building an understanding of not just the value of the data itself but also the value of the data’s reliability that enables teams to better optimize their data quality measurement.
3 common data quality measurement strategies
Measuring data quality is a journey for every data team, but Mei typically sees organizations measure their data quality in three ways:
Strategy #1: “Teams tend to set up automated metrics that are relatively easy to monitor so they can track them over time. For example, teams set up data tests to do validation or freshness checks on their data. They want to know how many test figures they’re getting on a day-to-day or weekly basis, and if that number is growing or decreasing over time. They want to easily be able to know the percentage of tables that have failed this test on a daily basis.”
Strategy #2: “I’ll also see teams look at their data product engagement metrics. For example, they’ll want to know if a certain BI dashboard is viewed by a lot of users, or if that number is decreasing. If so, it’s likely that something broke the trust of that dashboard over time.”
And the most comprehensive, strategy #3: “In addition, some organizations have implemented a very complex framework for measuring their data quality scores. They might determine a few dimensions of data quality that they care about, such as:
- How reliable is this table?
- Is the data updated on time every day?
- How complete is this table? Are we missing columns or rows?
- How usable is this table? Do we have all the documentation for this table?
- What’s the stewardship on this table? Is there an owner? Who’s responsible?
“From there, they apply qualitative scores to each of these dimensions, and they assign a weight to identify how much each dimension matters. Then, they can calculate a data quality score for each dimension.”
“This requires more effort, but it’s the most comprehensive and accurate measurement you can get for measuring the data quality in a table,” says Mei.
How Pave measures key data quality components to maintain consistency and accuracy
At Pave, customers purchase data products, so it’s essential that the data upholding those data products is consistent and accurate. Their customers need to be able to trust their data. So, as Stefanie shares, their data quality is measured by these theoretical concepts, and then broken into various measurable components.
“We don’t have one giant data quality score, because I think it’s hard for all parts of the staff to act on one score in the same way,” says Stefanie. “Instead, for example, we have a data quality component metric around the amount of missingness in our data. That’s something that data engineers and data scientists can improve.”
“I find that measuring components of data quality like this, instead of one big data quality score, is easier to act on,” she says. “A good data quality metrics inspires the team and motivates the team, and it allows us to have a more cross-functional conversation with our stakeholders about what we’re doing and why.”
How Surveymonkey focuses on data variety and governance to maintain data quality
For SurveyMonkey, accuracy, consistency, and completeness are also key data quality metrics measured by the team.
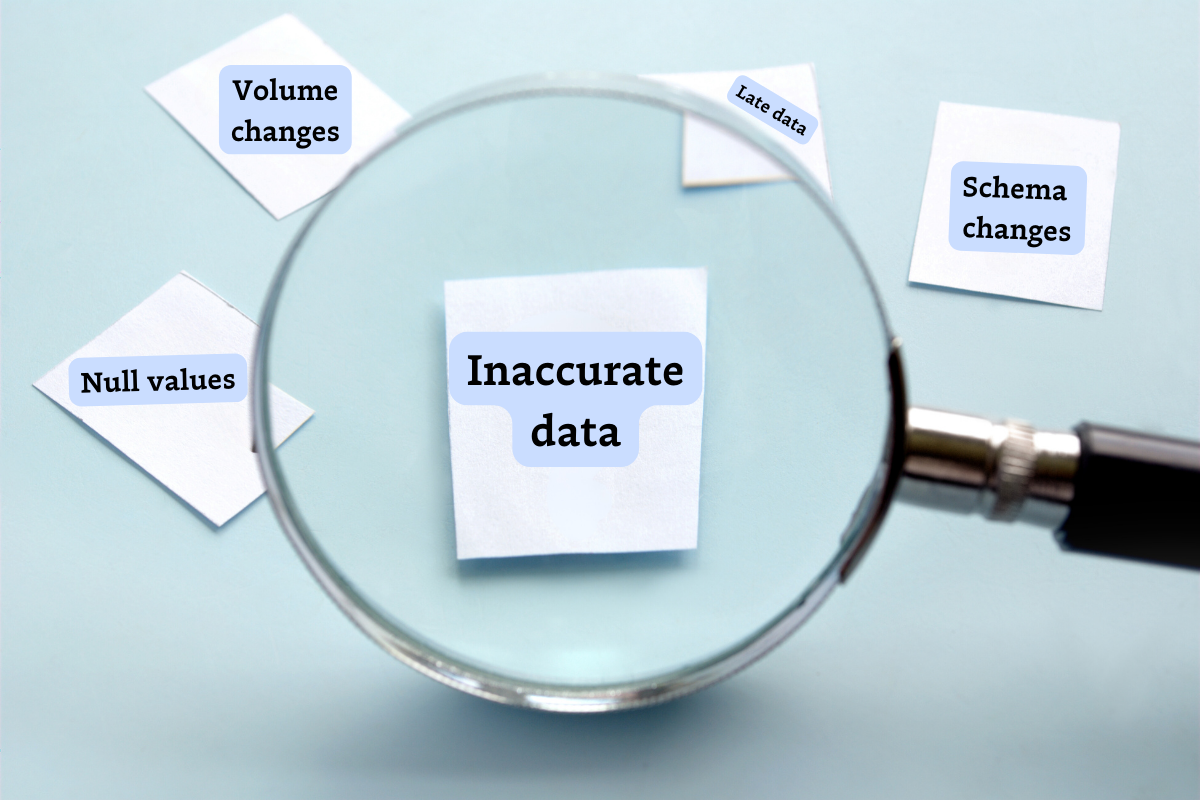
“We also think about data variety. With AI, we experience large volumes of data creeping in, and AI algorithms thrive on vast, diverse datasets.” And especially when it comes to AI, that wide variety of data needs to be reliable to be valuable.
“AI models are highly sensitive to inaccurate data,” says Samiksha.
“We’re also taking data governance into consideration. That’s something we take very seriously,” says Samiksha. “For every project we do, we have a strategy and process in place. Each project is not considered complete unless we have these checks, monitors, and alerts in place. These aspects of the health of the data are factored heavily in our planning phase.”
The golden rule? Everyone owns data quality
It’s an age-old question across every data organization. If the business is going to be brought in on the importance of data quality, how do we tell who’s actually responsible for the quality of that data? For both Samiksha and Stefanie, data quality management is a collaborative effort across teams.
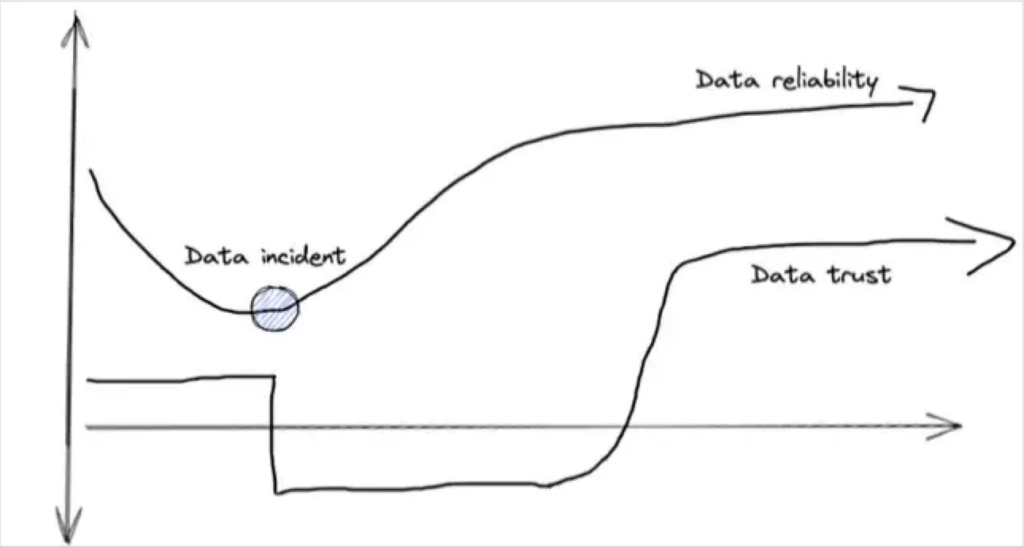
“When you have observability in place, you’re proactively getting notifications, and it’s not just the data engineer getting notified,” says Samiksha. “Upstream users getting notified too.” Both teams are alerted to an issue and can take the necessary actions to resolve the issue from their perspectives, eliminating the possibility of surprises and decreased trust.
Stefanie expands on the importance of collaboration. “One of the things that’s really important to me when we’re designing our data quality OKRs is asking: ‘Is this metric something that can be moved by both our data engineering and data science teams? Maybe even our integrations team upstream?’” she says. “Those are the best goals for data quality metrics because they can be increased in multiple ways across teams.
When everyone’s an owner, data trust becomes a byproduct of each person’s commitment to the task at hand, increasing not only the data’s quality but also the collaboration and cooperation between teams.
Data observability is essential to measuring and maintaining data quality at scale
Measuring data quality can be tricky, but the right data observability tool is an enterprise cheat code. With data observability—including robust automated data lineage and baked-in health metrics—your data team can proactively set SLAs across the organization, domain, and data product levels, and detect and resolve faster when things go wrong.
Solutions like Monte Carlo help teams quickly identify and track the metrics that matter most to their organization – like accuracy, freshness, and volume – and set monitors to detect and measure effectively.
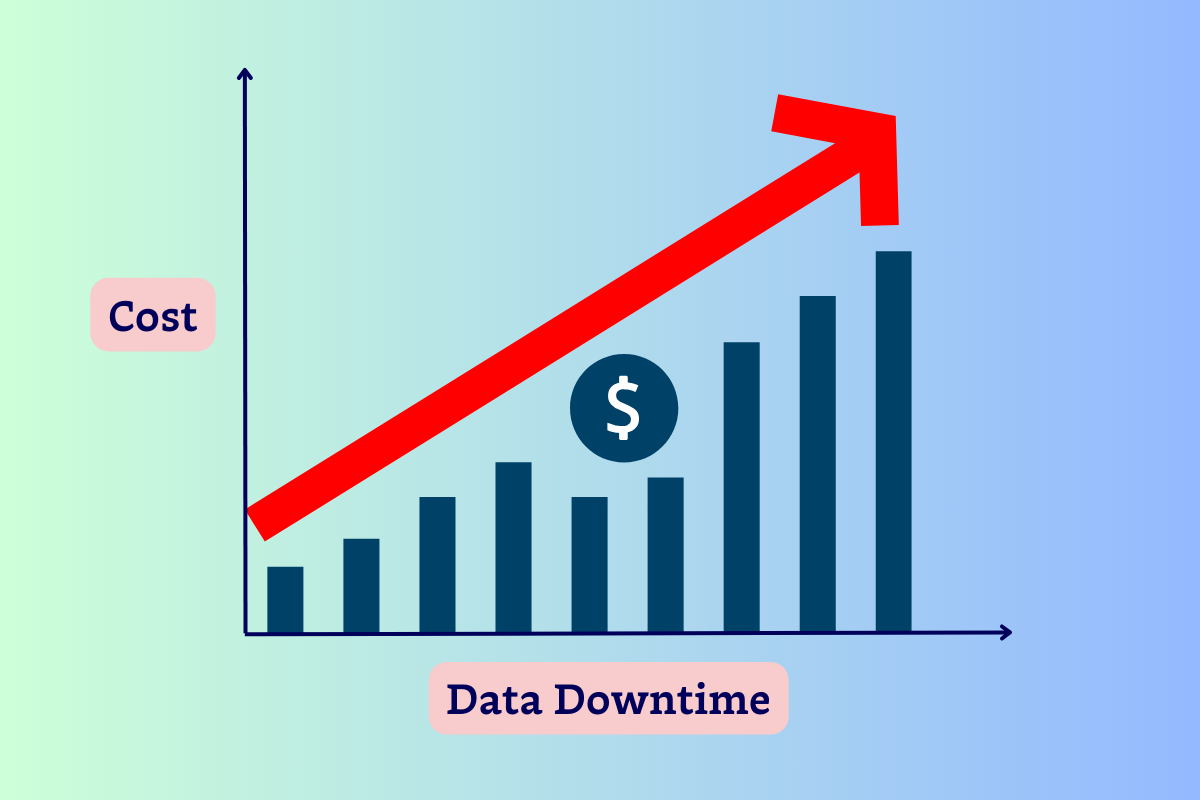
Good data is valuable. Bad data is expensive.
Don’t let data quality issues ruin your data products. Contact our team to learn how data observability can help you measure and maintain your data quality better.
Our promise: we will show you the product.
Frequently Asked Questions
What are the 4 categories of data quality?
Reliability, completeness, usability, and stewardship.
How do you define data quality?
Data quality is defined by metrics that include accuracy, consistency, completeness, and reliability of data. These metrics help ensure that data is suitable for its intended use and meets the needs of data consumers.
Read more posts.