Product demo.
  What is data observability?
  What is a data mesh--and how not to mesh it up
  The ULTIMATE Guide To Data Lineage
 The Future of Business Intelligence


Michael Segner
Michael writes about data engineering, data quality, and data teams.
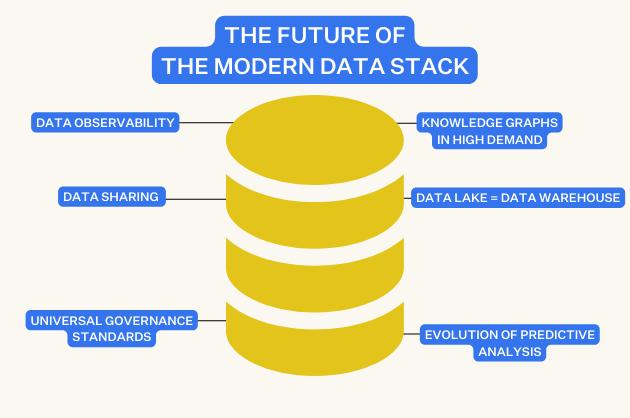
The future of business intelligence (BI) is inextricably linked to the future of data.
As the amount of data companies create and consume grows exponentially, the speed and ease with which you can access and rely upon that data is going to be more important than ever before.
From artificial intelligence to tools that foster collaboration and self-service, below we’ll be looking at several different developments and approaches that reflect the changing face of data analytics, as well as how they’re already contributing to the ever-changing future of business intelligence.
Table of Contents
Self-service business intelligence
As the name suggests, the aim of self-service BI is to empower everyone within an organization to be able to access the data that they need and draw relevant conclusions from it without the need for any extensive training or additional supervision.
In days gone by, one of the duties of the data team was to produce whatever analytics reports stakeholders needed. Data teams have historically been the gatekeepers of data, tasked with turning it from something inscrutable into something that other departments can act upon.
This approach was problematic for a number of reasons: it often prevents decision makers from acting on data within an appropriate time frame, and results in data teams being tied up with exporting datasets instead of using them to conduct their own meaningful analysis.
Beyond that, it means that data is only as up to date as the last set exported by those who have access to it. Trends that have taken shape in the past day, week, or month, depending on how old the data in question is, can end up being overlooked by those making decisions.
Self-service BI reduces these dependencies, doesn’t require expert knowledge or training, and improves overall agility. Tools like ChatGPT can generate SQL code from plain English, for example, democratizing data access and accelerating data retrieval.
According to the firm Verified Market Research, the self-service BI market was valued at $24 billion in 2023 and is projected to reach $150 billion by 2030, making this a top trend to watch.
Real-time business intelligence
As mentioned above, business intelligence has not always been available in real time. Before the days of constantly updating analytics dashboards mounted on the walls of startup offices, datasets were exported daily, weekly, or even monthly, for analysis by relevant parties.
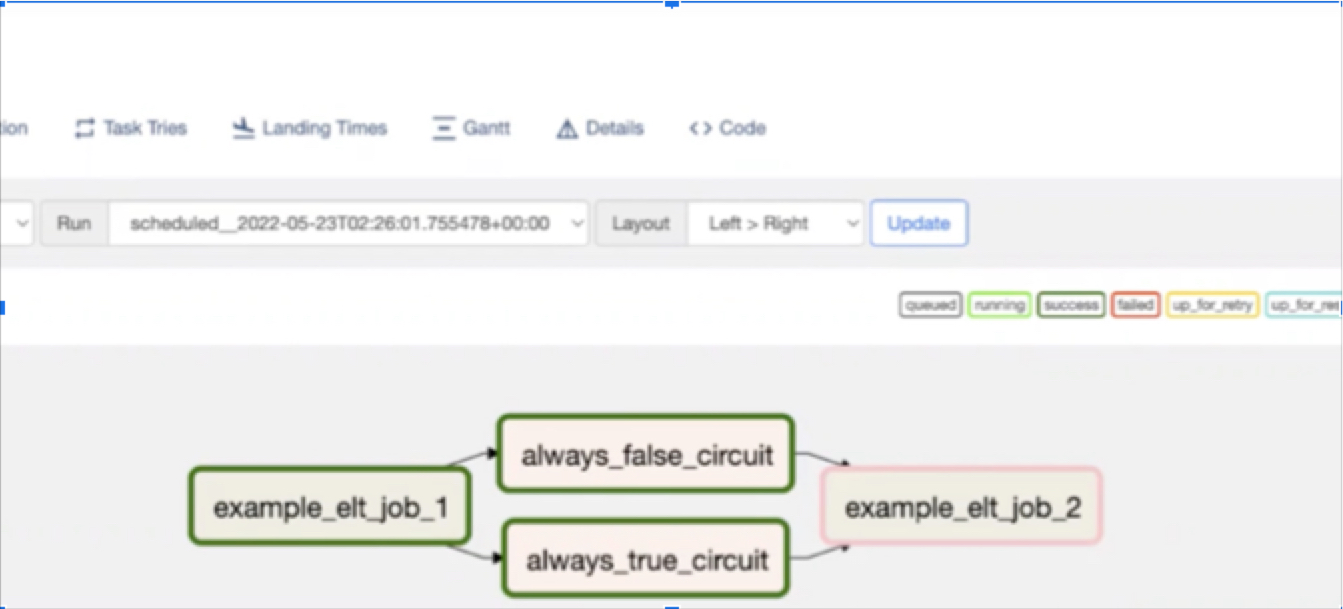
Even as the modern data stack has greatly expedited and automated the delivery of easily digestible data analytics, data teams and data consumers haven’t always been aligned. If an ETL pipeline is refreshing the data behind a dashboard once a week and the business stakeholder needs daily data updates, there is still an unacceptable lag. Or it may even be unintentional, the Airflow job may fail resulting in the dashboard remaining stale while the data team remains unaware.
This is where creating data SLAs and monitoring/enforcing them with data observability solutions to monitor for data freshness can help.
Going beyond looking at trends, another huge advantage of real-time analytics is that they’re useful for identifying emergency situations such as data pipeline failures, outages, DDoS attacks, or a sudden influx of refund requests. The sooner you identify issues like these, the sooner you can take the appropriate actions to mitigate problems associated with them.
Examining the relationship between two data streams, for example, can be conducted on the fly and its potential value determined immediately, which stands in stark contrast to suggesting a comparison, waiting for it to be aggregated, sent to a BI server for analysis, …you get the picture.
Semantic layer and Headless BI
Similar to how data modeling seeks to create an architecture within a data warehouse that tells the story of how the business operates, the semantic data layer (or metrics layer) is the next level of abstraction and a bridge between raw data assets and how they are defined by the business.
For example, the “customers” metric when used by the business likely refers to active customers.
All the classic components of big data (volume, variety, veracity, and velocity) make it difficult for business users to gain a comprehensive understanding of a company’s data assets. Data catalogs, BI tools, dbt, and more are all exploring how they might become your future semantic layer. See also: “headless BI.”
Explainable artificial intelligence
Handing control of the reins to artificial intelligence (AI) is daunting, and can seem foolhardy if you’re not able to look into how it’s coming up with the results that it is.
Historically, AI has done much of its work behind the scenes and tracking its progress hasn’t always been easy. When stakeholders can’t see the process, they often don’t trust the process. This is one of the reasons why adoption of AI has been more sluggish than might be expected.
Explainable artificial intelligence is important for the same reason teachers need to see their students’ working on their homework: getting the “right” answer is all well and good, but it’s important to know that students understand how they got to it.
Likewise, anyone using AI to inform their business decisions (or even automating those decisions using AI) will want to know how relevant data was gathered, and what assumptions are being operated on. In other words, they need transparent and easily digestible information. That’s particularly true for high-risk industries like finance and healthcare.
Addressing the issue of AI “hallucinations” and ensuring data accuracy are crucial for fostering trust in AI-driven BI solutions.
When people don’t trust the conclusions drawn by AI, or can’t examine the reasoning behind them, they may not act on that information. That increases the risk of human error. When they can examine that process, regardless of whether or not the results fit with their gut instincts, they’re far more likely to take it into account.
According to Next Move Strategy Consulting, The global Explainable AI market was valued at $6.2 billion in 2023 and stands to rise to $16.2 billion by the year 2028. In other words, we can expect to see businesses doubling down on explainable AI in the years to come.
Data Observability
More and more business owners are getting switched on to the value of data observability, which refers to an organization’s ability to understand the health of the data in its systems.
Discovering data errors before feeding data into business intelligence tools is absolutely crucial for a number of reasons, with some more obvious than others. Perhaps the most obvious of these is that using flawed data can lead to poor business decisions.
Effective data observability means knowing what data has come from where, timely delivery of trustworthy data, and easier resolution of any data issues that do arise. To put it another way, the emergence of data observability is concrete recognition that data is more important to businesses than it’s ever been.
Ultimately, in some way or another, better data observability is at the core of all the concepts listed above. And that’s a good thing, because better data observability means better business intelligence.
+++
To learn more about how data observability can make your business intelligence dashboards more reliable, reach out to us using the form below.
Our promise: we will show you the product.
Read more posts.