Product demo.
  What is data observability?
  What is a data mesh--and how not to mesh it up
  The ULTIMATE Guide To Data Lineage
 61 Data Observability Use Cases From Real Data Teams


Michael Segner
Michael writes about data engineering, data quality, and data teams.
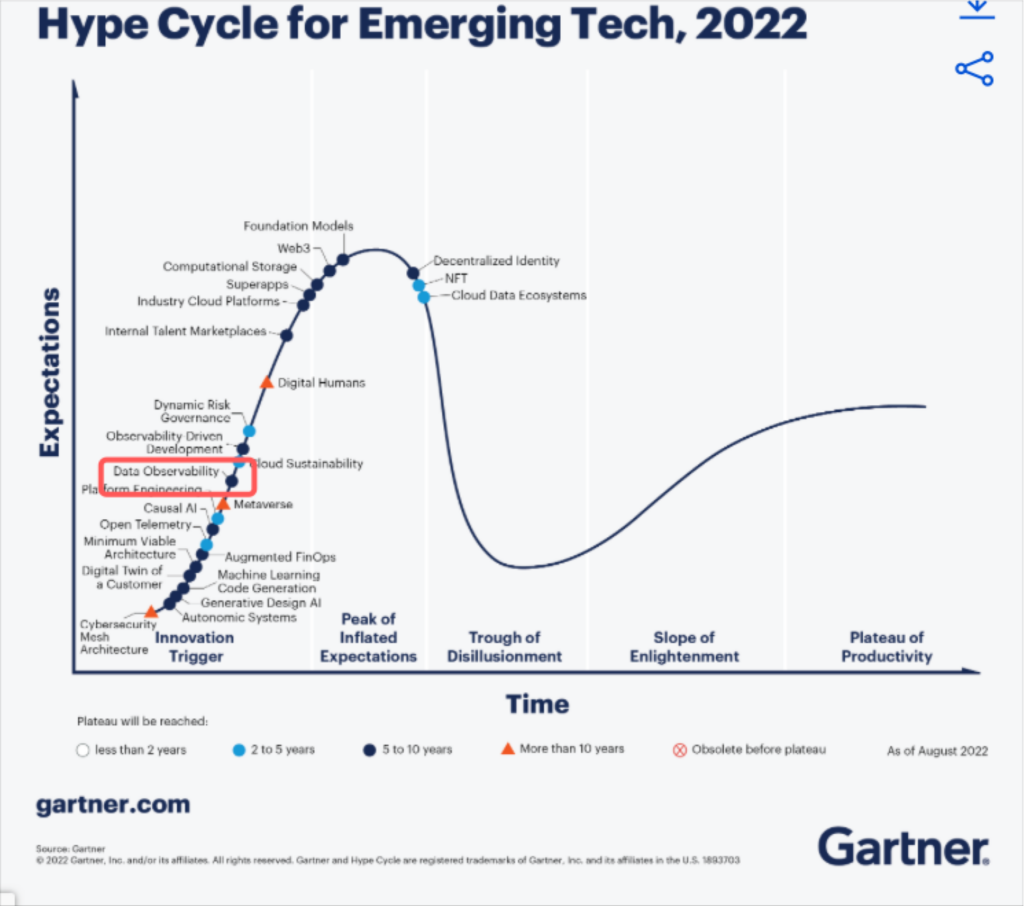
Data observability, an organization’s ability to fully understand the health and quality of the data in their systems, has become one of the hottest technologies in modern data engineering.
In less than three years it has gone from an idea sketched out in a Barr Moses blog post to climbing the Gartner Hype Cycle for Emerging Technology.
Because the technology is so extensible, there have been a wide array of suggestions–some more grounded than others–for how it can be used.
To help clarify, we reviewed hundreds of data observability deployments to identify 61 real data observability use cases and benefits.
Some of these data observability use cases will be more popular and valuable than others, but each one listed below has been successfully leveraged in production by a data team likely similar to your own. As a result, the below list is filled with clear and specific examples.
Table of Contents
Core Data Observability Use Cases
The main data observability use case is to improve data quality. Specifically, to reduce data downtime or the period in which data was inaccurate, missing, or otherwise inaccessible.
The three levers for reducing data downtime and the four main types of data issues were defined from the first moment the category was born, and thus are the first seven core data observability use cases listed here.
1. Reduce The Amount Of Data Incidents
Resident, an online mattress and homegoods store, has a lot of data. In fact, director of data engineering, Daniel Rimon, and her team were managing more than 30,000 BigQuery tables alongside complex data pipelines. The data team dramatically reduced the overall number of data incidents over time thanks in large part to the increased visibility from data lineage as well as broad, automated data freshness alerts.
“We have 10% of the incidents we had a year ago. Our team is super reliable, and people count on us,” said Daniel. “I think every data engineer has to have this level of monitoring in order to do this work in an efficient and good way.”
2. Detect Data Incidents Faster
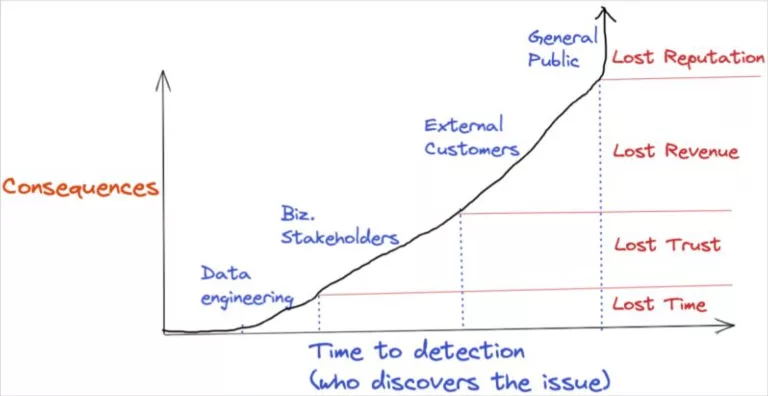
Most data teams get alerted to data incidents when they get an email complaint from a data consumer lands in their inbox. Often that means the data has been incorrect for days or even weeks.
“…If there was an issue that made its way into a dashboard, but nobody on that team used the dashboard for a bit, that could have been a problem for 12, 18 or more hours before they notify you it’s broken,” said Nick Johnson VP of IT, data, and security Dr. Squatch.
Data observability platforms deploy machine learning monitors that detect issues as they become anomalous and provide the full context to data teams allowing them to jump into action. Contentsquare, which had already deployed an extensive data testing regimen, saw a 17% reduction in time to detection within the first month of deploying data observability.
3. Fix Data Incidents Faster
Resolving data issues has become increasingly difficult as modern data stacks and pipelines grow in complexity. According to our recent survey of 200 data professionals, the average time to resolve a data incident has jumped from 9 to 15 hours year over year.
Data observability platforms deploy features such as data lineage, query change detection, and correlation insights to determine where issues are occurring at the system, code, or data level.
Data observability helped BlaBlaCar, the world’s leading community-based travel network, reduce their time to resolution by 50%.
“The 200 hours of investigating the root cause is now basically cut in half. Now, data engineers barely have to investigate the issue because the root cause is right in front of you,” said Kineret Kimhi, BI and Data Engineering Manager, BlaBlaCar.
Choozle also saw an 80% reduction in overall data downtime as a result of data observability.
“We see about 2 to 3 real incidents every week of varying severity. Those issues are resolved in an hour whereas before it might take a full day,” said Adam Woods, CEO, Choozle. “When you are alerted closer to the time of the breakage it’s a quicker cognitive jump to understand what has changed in the environment.”
4. Prevent, Detect, Resolve Schema Changes
Let’s go a little deeper with our data observability use cases and examine a few of the common types of data issues that data observability is especially well equipped to tackle such as unexpected schema changes. In these scenarios, the structure of the emitted data will change causing breakages in the data pipeline downstream.
Since data engineers are rarely in control of the services emitting the data, this can create considerable data downtime. For example, online marketplace Mercari was able to quickly detect and fix a breaking schema change.
“The schema change monitor helped us in a situation where a Google query automatically transformed a data type to an integer, which would have caused problems,” said Xi Zhou, data reliability engineer, Mercari. “We got the alert and took care of it before the downstream report failed.”
Another common breaking schema change scenario is when data teams sync their production database with their data warehouse as is the case with Freshly.
“When there is a schema change in our production database, Fivetran automatically rebuilds or materializes the new piece of data in a new table. Monte Carlo then alerts us that a schema change has occurred and we are able to make sure any resulting data downtime is negligible,” said Vitaly Lilich, former senior director of data, Freshly.
Data engineers will need to change schemas on occasion as well. Data observability platforms allow them to see the impact on tables, dashboards, and consumers downstream to plan and mitigate any impacts.
For example, Yotpo’s business applications team, the group responsible for integrating and maintaining internal operational systems such as Salesforce, wanted to replace an outdated field with a new one. Many of their dashboards heavily relied on this field so they used the data lineage capabilities within a data observability platform to prepare in advance for this change.
5. Prevent, Detect, Resolve Data Freshness Issues
Data needs to be delivered on-time to be valuable–stale data kills data driven organizations. While data freshness alerts are not technically difficult to set up, managing them at scale is a nightmare. Data observability automates and scales these monitors across an organization’s entire environment.
Fintech Checkout.com monitors 4,600+ data sets, supports 300+ active data platform users every day, and supports 1,200+ dbt models that run various transformations on a daily basis.
“That forced our hands to adopt data observability—or essentially data quality and data freshness—quite early on in our journey, and that became a crucial part of our day-to-day business,” said Checkout.com Senior Data Engineer Martynas Matimaitis.
6. Prevent, Detect, Resolve Data Volume Issues
You can think of tables as Goldilocks–the number of rows added need to be juuust right. Too few or too many are data quality red flags. Manually coding a test or volume alert can be tricky as you need to determine the right threshold. Otherwise you will miss incidents or create alert fatigue.
Data observability’s data volume monitors can help detect issues that would be nearly impossible to find such as empty queries. For example, one company successfully ran a query that updated three tables, but with no new rows added.
A volume monitor immediately notified the team via Slack of the incidents, calling out that the impact radius of the incident could affect up to 200 data warehouse queries as well as numerous downstream tables and views.
7. Prevent, Detect, Resolve Data Distribution Issues
If data is outside of historic value ranges, or if there is a spike in the NULL or unique rate, there is likely a data quality issue that needs to be addressed.
Data observability platforms enable users to drill down and monitor specific fields for these types of data anomalies. One data team applied these field health monitors to certain customer identification fields and noticed that “device type ID” and “patron ID” fields had rows with values of 0, meaning they could not be associated with unique individuals. This had implications for their customer services department which relied on this data to make real-time decisions on support levels.
Mitigate Risk of System Failures
Data downtime and the four types of data issues are helpful high-level categories to explain the benefits of data observability, but it is also important to take a closer look at some of the common reasons why these data quality issues arise in the first place.
While there are a near infinite number of ways data can break bad, they can typically be attributed to issues at the system, code, or data level. We highlight a few of the more colorful of these data observability use cases below.
8. Safety Net For When Alerts Fail
Most solution layers within the modern data stack will have the ability to set alerts for when there is a failure. For example, Fivetran (ingestion), dbt (transformation), and Airflow (orchestration) all have these capabilities.
These alerts are generally data unaware, meaning they know if the job ran successfully but have no idea if they ran successfully with garbage data. The other challenge is these alerts don’t always fire in ways that can help mitigate the damage. “Quis custodiet ipsos custodes,” or who watches the watchers? For Mercari, that answer is their data observability platform.
“One of our streaming pipelines experienced a connection failure, which impacted hundreds of tables,” said Xi Zhou, Mercari data reliability engineer. “Monte Carlo caught it right away, allowing us to fix it quickly. Quick time to detection and resolution is important because it makes the process of backfilling the correct data less painful.”
9. Flag System Authorization And Integration Failures
Data pipelines are complex, interdependent systems with many moving parts. They are connected and integrated in ways that are often prone to failure. These are often silent killers that create data freshness issues and headaches for data teams. Here are two real-world examples.
A Salesforce password expired, causing one data team’s salesforce_accounts_created table to stop updating. Monte Carlo alerted them that updates on this table had stopped, allowing them to find and fix the root cause before it caught executive attention.
Another data team had their integration with Google Adwords failed because of an authorization issue. As a result, they were missing a bunch of data in tables that they then run a bunch of aggregations on.
Mitigate Risk of Code Failures
To code is to err. That is why the majority of organizations have extensive code review and other quality assurance processes in place.
That helps, but we all know code and query issues still occur all the time. Code failures are particularly insidious as troubleshooting often involves combing through blocks of code line by line…unless data observability is involved.
10. Query Change Detection
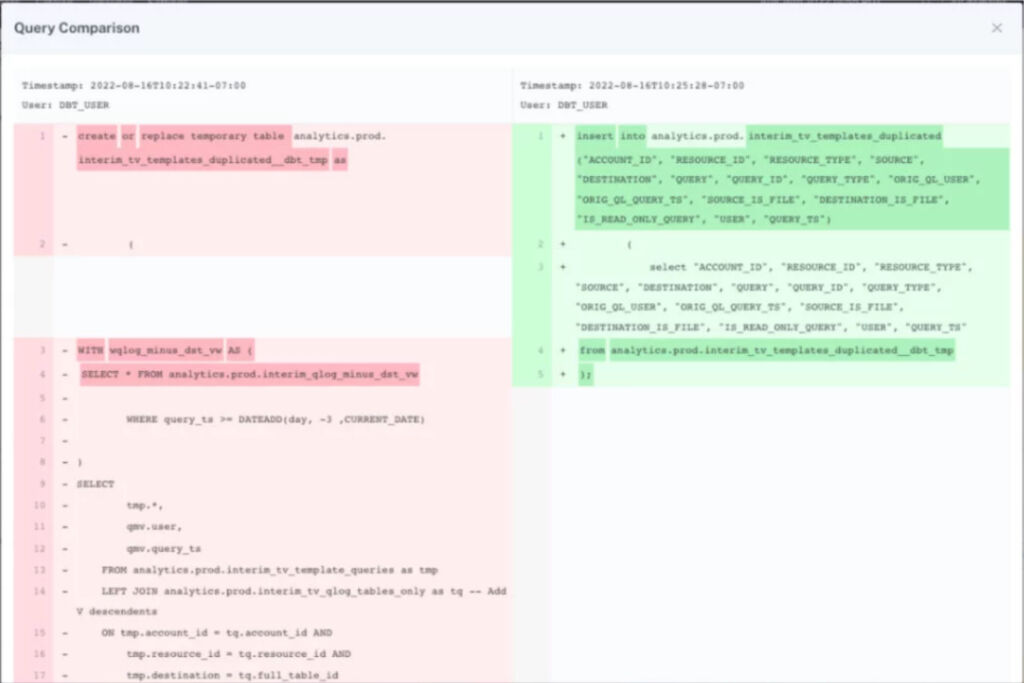
One of the most common ways bad data is introduced is when a query is modified, updated, or changed. This is especially impactful when you have many cooks in the kitchen or data professionals across multiple domains.
Data observability platforms can help data teams by pointing out when a data quality issue is correlated with a query change.
“When an incident occurs, it’s helpful to see when a query has changed and who has changed it. We can reach out directly to that person rather than asking around, or get an understanding of the root cause if it’s a service account,” said Daniel Lameyer, data reliability engineer, Mercari.
11. Query Simplification
Sometimes queries work…but they could work better. Data observability and data lineage can help reduce complexity, ultimately making data systems more reliable.
“We had complicated queries, many duplications, inconsistent logic—it was quite a mess. We knew we were missing a lot of data and wanted to keep better track of our website through Google Analytics and Google Tag Manager. We didn’t have any monitoring, information about what’s going on in customer success, and found out we didn’t have connections to a lot of our marketing sources,” said Daniel.
“In addition to identifying when there is a problem, [data observability] has also helped us to understand where problems are likely to occur, where things are brittle. And over time, we’ve invested effort into cleaning up our lineages, simplifying our logic,” said Brian London, director engineering, AI, and data platform, SeatGeek.
12. Extra Attention For Big Jobs
Heavy queries are common failure points. A common data observability use case is to provide insights to help identify these queries, determine if they are performing worse over time (and at risk of timing out), and allow users to place custom data freshness monitors to ensure they run successfully.
One successful CMS company uses these custom monitors to keep track of a process that loads data to BigQuery that is gathered by a cron on the server farm. Because the sheer amount of data takes several days to process, they designed a query that checks rows loaded on a day over day and week over week basis to make sure the cron is on track.
Another data team noticed they had multiple queries timing out in Snowflake. Over one weekend they had 21 different tasks that were hanging. They set up custom monitors to alert them of any queries that were running over one hour.
13. Upstream Code Impacting Data Systems
It’s not just SQL queries that can create data quality problems. Another data team caught data freshness and volume issues caused by a bad code merge upstream.
The issue was with a Lambda that took data from S3 and pushed it into Snowflake. They originally built this specific function in a way that stored the Snowflake credentials in code. When they updated it, they didn’t update how they were passing credentials and it stopped new data from being loaded.
14. Human Error
As long as humans are part of the data engineering process, bad data will never be completely solved. However, data observability platforms can help accelerate detection and resolution to keep data downtime manageable.
An example of this is an engineer who had inserted a backfill process into production data that was not QA’ed (which as well all know happens). The problem was it was running on a daily basis. This impacted machine learning algorithms and dashboards used for real-time decision making. Luckily, the data observability solution caught what otherwise would have been an otherwise difficult to detect issue.
Mitigate Risk of Data Failures
Software engineers are also challenged by system and code issues, but data engineers are faced with the unique challenge of issues within the data itself. That’s why data observability platforms need to feature both data pipeline monitoring as well as data quality monitoring.
15. Keep Third Parties Honest
Data is often exchanged as a result of paid, contractual relationships. One of the most common is when marketing departments pay for advertising and receive data on the performance of their campaigns, which is vital for their optimization.
These partnerships can range from automatic updates to manually loaded spreadsheets. Either way, problems arise if the partner is providing bad data or delayed in sending that data.
As a result, many data teams will create a set of monitors to evaluate the quality and freshness of the data received by partners–and some will even go so far as to set expectations via a data SLA.
For example, one data team sets custom monitors on the third-party shipping data they receive on their products as they go to and from their warehouse. By doing so, this team caught an issue where one of the shipping partners hadn’t sent data. They were contacted and immediately sent the data in question.
16. Validate Data
Just like data teams need to hold third parties accountable, they also need to validate data on-boarded from other parts of the business. This could be from data power users or even other internal data teams. This was the case for ThredUp head of data engineering Satish Rane.
“We had a decentralized approach to onboarding data,” Rane said. “There are sacred things which the data team owns, which are critical for the finance side, and there are all these other on-boarders of data that probably do not go through the same regimen of what the data engineering team goes through.”
17. Profile Data
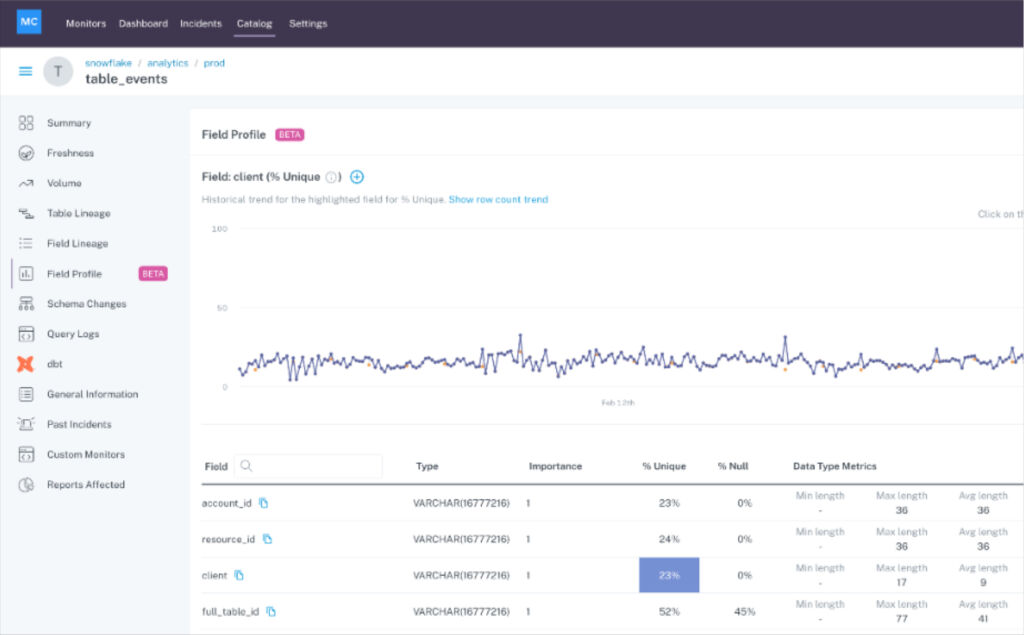
An embedded data analyst might understand the eccentricities of specialized data within their domain, but data engineers can’t be expected to be intimately familiar with every data set.
Data profiling is a helpful data observability use case that enables centralized data teams to quickly understand the critical qualities of a data set like the percentage of NULLS or unique values within a specific column.
Save Time
Let’s face it, data engineering expertise is scarce and valuable. It’s a waste to have your best data professionals firefighting preventable data quality issues, coding the 91st data test for a problematic pipeline, or addressing ad-hoc questions about “are we sure about this number?”
It’s not just the members of the data team either–quality data allows the entire organization to perform at its best and most efficient.
18. Save Data Engineer’s Time
Our 2023 survey revealed that data professionals spend more than a third of their time evaluating or checking data quality–that is too much. Making data engineers more efficient is one of the most valuable data observability use cases.
Many times this is by freeing them from having to manually implement and maintain hundreds of data tests as was the case with Contentsquare and Gitlab.
“We had too many manual data checks by operations and data analysts,” said Otávio Bastos, former global data governance lead, Contentsquare. “It was very time-consuming. We had low efficiency on internal reporting, and it took a lot of time to build new reports on new metrics.”
The Gitlab team built manual tests within dbt and throughout their data stack to try and check for accuracy, freshness, and other attributes of data quality. “But it’s very time-consuming to do that,” said Rob Parker, former senior director of data and analytics, Gitlab. “You can imagine onboarding a new data set that has a dozen tables, building row count tests, data volume tests—it’s just incredibly, incredibly time intensive.”
Thanks to data observability, organizations like Optoro and Blinkist can save 44 data engineering hours and 120 hours per week respectively.
19. Scale Small Teams
You can realize massive cost savings when you make larger teams more efficient, but reducing the opportunity cost for smaller data teams can be just as critical. For these teams, it’s often a choice between ensuring quality data or executing other high-value tasks.
For example, a one person data team at an insurance company found they were spending more time maintaining tools than actually using them to deliver data. With these bottlenecks and a lack of accessibility to—and therefore trust in—the data, many data consumers found workarounds by simply querying the source data directly.
“All this investment that I was making in this data stack was for naught,” they said.
20. Save Data Analyst And Data Scientist’s Time
Not every data observability use case centers around the data engineer. Before data scientists or data analyst can do anything interesting with the data, they often need to spend time verifying the lineage, ensure there aren’t any missing rows, and other general cleaning tasks.
In a recent Snowflake webinar, JetBlue data scientist Derrick mentions how helpful it is for the data science team to know they don’t need to continuously do “sanity checks” on the volume of their data sets since they know they are being monitored for volume anomalies (as well as freshness, schema, and overall quality).
21. Save Analytical Engineer’s Time
Analytical engineers play a critical role as a liaison between technical and business teams. They are also typically deploying dozens of dbt models each of which is transforming data and the underlying SQL codes in ways that can create quality issues if not closely monitored.
“With data observability, our analysts know almost immediately if there’s a big problem, which is a huge time saver. Obviously, the code goes through multiple reviews, but no process is perfect,” said Danielle Mendheinm, associate director of analytics & strategy, Dr. Squatch.
“If there is an issue, it can be addressed immediately while the pull request is fresh in their mind rather than having to readjust a sprint weeks later to account for it. I’d estimate it saves our analyst team a couple of hours every week from having to re-open pull requests and adjust code,” she said.
Increase revenue
Data quality issues can be costly and mitigating that risk is nothing to scoff at. However, data observability has several use cases that can directly increase revenue that are frequently overlooked. Here are several examples.
22. Improve Marketing Campaigns
Data-driven companies are 58% more likely to beat revenue goals than those who don’t use data to guide strategy and decision making, according to Forrester. No where is that difference more black and white than in marketing, and specifically the outcomes of paid advertising campaigns.
This is the case for Blinkist, an eBook subscription company with more than 16 million users worldwide. Their primary use case for data observability was so they could make bold, aggressive marketing investments with confidence in order to hit an ambitious 40% growth target.
It gave Blinkist a competitive advantage by allowing them to pivot quickly–which turned out to be essential when the COVID-19 pandemic caused sharp changes in the market.
At that point, historic data didn’t reflect the current reality of their audience’s daily lives, and real-time data became essential—not just for determining advertising spend, but for understanding the current state of how users were interacting with the Blinkist app and content across the web.
“The scale of growth that we’ve seen this year is overwhelming. Although the data teams can’t take full credit, I definitely think the things we were able to do—in terms of data observability and bringing transparency into data operations—improved how we target our audience and channels,” said Gopi Krishnamurthy, former director of engineering, Blinkist.
23. Enable A Robust Experimentation Infrastructure
Experimentation is a means for data teams to demonstrate strong, easily quantifiable value. However, statistical significance is a fragile thing. If you experience data freshness issues or other data anomalies because your data pipelines broke during an experiment, all the effort that has been invested is for naught.
Unfortunately, bad data is particularly likely to strike during periods of product change that involve multiple simultaneous changes to instrumentation. This is potentially disastrous given how experiments are highly scrutinized; after all, painstakingly crafted code and promotions are often on the line.
Clearing this bar requires a high degree of data trust. It’s hard to convince departments to launch experiments or executives to trust them if no one believes in the underlying data or the dashboards they look at every day. Oftentimes these ETL systems come under considerable pressure as all of your stakeholders want to look at every metric a million different ways with sub second latency. Data observability can help ensure your experimentation program gets off the ground.
24. Differentiate Data Products
Oftentimes users that get the most topline benefit from a data observability platform are companies where data is the product or at least a core component of it.
Generating and providing access to data is how they drive revenue, and for these organizations, higher quality data means a higher quality product. This can help lead to higher margins or increased product differentiation.
Leading digital advertising software company Choozle found value in data observability as they were launching a major platform update that gave its users unparalleled insight into their campaign performance.
For example, whereas previously Choozle could provide campaign performance across the top 20 zip codes, they could now show advertisers their performance across all 30,000 zip codes if they wanted to dive into that level of the data.
Snowflake gave them the power to dramatically increase the amount of data and how their users could interact with it, but data observability played a key role in making sure everything came together without a hitch.
25. Keep Customers Happy
As anyone in the B2B SaaS business knows, customer success and happiness is vital to expansion and churn prevention.
The Blend data team leverages data observability to make sure data quality issues aren’t caught by customers.
“We have many cases where folks would say, ‘Hey, we’re not seeing this data. We’re not seeing these rows. Where are these?’” said Albert Pan, software engineer, Blend. “It’s never great when a customer tells you that something is wrong or missing. So, we wanted a proactive solution that could tell us when something is wrong, and we can fix it before they even know. That’s one of the main reasons why we use Monte Carlo.”
The Optoro data team also prioritizes the close monitoring of data being sent to customers.
“We can get a visual on affected data sources, from internal data marts all the way downstream to our Looker reports that could be client-facing,” said Patrick Cambell, lead data engineer, Optoro. “Being able to quickly identify client-facing issues and be proactive is really the key to building trust in our data. And this feature makes the data engineers’ jobs much much easier—I can tell you definitely from experience here.”
26. Keep Critical Machine Learning Algorithms Online
Online retailers have found a great way to increase the revenue from their customers is to automatically recommend complementary items to those that have been placed in the online shopping cart. This functionality typically depends on machine learning algorithms that are operating on fresh data.
One ecommerce site found their recommendation algorithm failed to capitalize on opportunities estimated to be worth around $6 million as their model was operating on stale data and temporary tables. Keeping these revenue generators online and accurate is a common data observability use case.
27. Move Your Generative AI Strategy From Pitch Deck To Reality
If generative AI is a gold rush, high quality data is the pickaxe. As the leaked Google memo says, “data quality scales better than data size” for these types of projects which can save time by training on “small, highly curated datasets.”
28. Support Reverse ETL Initiatives Like Personalization
Data observability and reverse ETL go together like peanut butter and jelly. Why? The more valuable you make data, the more costly its downtime will be.
It’s not ideal when a dashboard surfaces stale data, but in many cases, it’s not exactly a crisis. But what if that same data freshness problem occurs across a data pipeline that is plugged directly into a marketing automation program? The result is stale audience segments, increasing customer acquisition costs, and a frustrated marketing team.
That’s why it doesn’t surprise me to see that respondents to our survey reported poor data quality impacted 31% of revenue on average. Nor that it was a five percent increase year over year.
29. Go Deep On Key Business Metrics
Every organization has a key handful of critical metrics that help model the growth and overall health of the business. When those numbers fluctuate outside of historical norms, executives will fire off an email to the data team to determine if it’s an anomaly or cause to celebrate. Smart data teams are closely monitoring not only those fields, but the tables upstream of those fields as well.
Additionally, it can be a good idea to create custom monitors that measure the relationship between metrics and other inputs to help explain any fluctuations that do arise (for example say the orders column spikes which is correlated with an increase in customer addresses located in New York City).
This is a valuable data observability use case for the Contentsquare team. “We can calculate any KPI using SQL codes, and we can use Monte Carlo to verify if [a certain] metric is increasing or decreasing faster than normal standards,” said Otávio Bastos, former global data governance lead, Contentsquare.
Avoid Costs
Data observability platforms can also help data teams make a direct impact on the business by avoiding costs. Many use cases here focus on infrastructure optimization (the focus of the next section), but there are other common examples as well. Here are a few.
30. Prevent Charges Related To Overconsumption
Most data systems pricing models are based on usage, but the exact formula varies. One relatively common model is buying a certain capacity for a period of time and paying an additional rate for any overages.
The HotJar data team avoided significant costs thanks to their data observability platform alerting them that they were almost at 80% of their MTU capacity for Segment. Yotpo had a similar data observability use case when an erroneous data point in their Segment instance generated 6x more rows than expected, even with seasonality and normal data fluctuations taken into account.
31. Avoid Compliance And Regulatory Fines
This is a data quality and data governance use case that is frequently cited in the hypothetical, but not always linked to specific scenarios. While not the main use case for data observability, it is a very real benefit in a world where the only thing propagating faster than data is data regulations.
To cite a specific, but anonymous example, a new team member of a data team made a change wild carding an existing production pipeline that was responsible for feeding mandatory legal requirements within a geographic market. Time to detection was dramatically shortened thanks to the data observability platform, which avoided an “all hands on deck support weekend” and possible fines.
32. Stop Revenue Bleeding
As the world becomes increasingly digital, mistakes that impact revenue can increasingly be detected within data systems. In these cases data observability platforms aren’t only helping to fix a data issue, they are fixing a business issue.
For example, one data team identified a freshness issue with a column related to a specific currency rate. After investigation, it was revealed that the app_purchase table was broken which had a domino effect on the currency column. Essentially, the organization was losing revenue until the issue was remediated.
Another organization saw the row count on their financial_margin table spike. They quickly determined a discrepancy that caused issues with their real time pricing model that could have had serious cost implications.
System Modernization and Optimization
The only constant in data engineering is change. This applies especially to your data architecture. Luckily, data observability can help with migrations, refactoring pipelines, and more.
33. Data Warehouse (Or Lakehouse) Migration
Interested in how to launch a successful data warehouse migration? The data lineage capabilities within a data observability tool can help!
If you have a decent amount of data with a high change rate, you will likely need to set up multiple waves with subsequent incremental migrations or a CDC to catch any changes and regressions introduced by the migration early.
So how should you group your migration waves? Some of the most common approaches are to migrate by domain or to migrate the highest value data first. However, it makes no sense to migrate a table and not the table upstream on which it depends. This is where data lineage can help you scope and plan your migration waves.
Data lineage can also help if you are specifically looking to migrate to Snowflake like a boss.
34. Integrate Data Stacks Post Merger
Data teams are often working to create the “one source of truth,” which can make it difficult to fully integrate another data stack post merger. Few teams want “two sources of partial truths.” Data observability and data lineage can help data teams get their footing in the new environment.
As Vox Media absorbed the Group Nine data ecosystem, senior product manager Vanna Treiu and his team needed to find a way to understand the lay of the data land.
“This is no shade on how Group Nine set up our data stack in the past,” Vanna said, “But we used a sledgehammer to do jobs where a regular hammer would have done perfectly fine.”
And the team was spending a lot of time on manual processes that weren’t scalable. The merger with Vox Media was an opportunity for Vanna and his team to modernize the approach. “There are frameworks and tools out there that can ably do these jobs without having us write bespoke scripts every time to move a source system into our warehouse.”
35. Reduce Clutter (tables, dashboards, etc)
Unused dashboards, tables, and columns create a data swamp that is hard to navigate both for data consumers as well as members of the data team. It also increases the risk that someone will somehow inadvertently pull data from accounts_deprecated.
This is one of the data observability use cases deployed by Dr. Squatch.
“The whole team is trying to build new things and I’m trying to prune them. I like being able to go into lineage and in a singular, unified view see if a table is useful. Previously I would have had to look at the DAG, go into dbt, and then go into Looker and see what tables are referencing this model table. I love lineage” said Nick Johnson VP of IT, data, and security Dr. Squatch. “The clean up suggestions are great too. It’s just easy validation. You can clean things faster that way and it’s a good guardrail for knowing what not to delete.”
It can also reduce infrastructure costs which is a data observability benefit enjoyed by ShopRunner.
“That’s the beauty of Monte Carlo because it allows us to see who is using data and where it is being consumed,” said Valerie Rogoff, former director of analytics architecture, ShopRunner. “This has allowed us to actually free up some of our processing time from unused data elements which no one was using anymore and were no longer relevant.”
36. Know When To Fix Vs. Refactor Data Pipelines
As Kenny Rogers said, “You’ve got to know when to hold ’em, know when to fold ’em, Know when to walk away, know when to run.” I don’t think he was talking about the decision on when to quickly patch versus refactor a data pipeline, but it is relevant advice for data engineers nonetheless.
The Mercari data reliability engineering team keeps a close eye on problematic pipelines and reoccurring issues. For these scenarios, it can make sense to adapt the underlying infrastructure.
“One new service we are excited about in Google Cloud is GCP Data Fusion which is a fully managed UI based data pipeline tool that natively integrates across GCP products, and enables fast ingestion of large datasets thanks to DataProc (Apache Spark) running behind the scenes,” the DRE team shared on their engineering blog.
Improve DataOps Processes
DataOps is a very specific set of practices and even tools for some data professionals. Here I’m using the term a bit more loosely to mean improvement to operations within the data team that can sustainably improve quality and efficiency.
37. Conduct Pre-Mortems
No data engineer in their right mind has looked at their to-do list, the unfilled roles on their team, the complexity of their pipelines, and then said: “This needs to be harder. Let’s break some systems on purpose.” That may be part of the problem.
Pre-mortems or chaos data engineering is the practice of simulating data system failures to improve incident management and response. It can ultimately help prevent data incidents and make systems more robust, but it only works if teams are able to observe their data and are confident they can safely contain any impacts from their drills.
The Mercari data team is tentatively planning to simulate data pipeline failures in this manner.
“The idea is we’ll roleplay an alert from a particular dataset and walk through the steps for triage, root cause analysis, and communicating with the business,” said Daniel, member of the Mercari data reliability engineering team. “By seeing them in action, we can better understand the recovery plans, how we prioritize to ensure the most essential tables are recovered first, and how we communicate this with a team that spans across four time zones.”
38. Analyze Data Incident Impact and Triage
Let’s be honest: not all data incidents are created equal. For data engineering teams to maximize their impact, they need context to help them prioritize their response to data quality issues. That can only be done with a data observability platform that leverages data lineage integrated down to the BI level.
“Knowing that a DAG broke or that a dbt run failed doesn’t speak to what actually has occurred in the underlying data structures,” said Vanna Triue, senior product manager, Vox. “What does that actually mean? How does this impact the data? How does this impact your users? Does this mean that the numbers will look funky in a dashboard or a report that they’re accessing in Looker?”
“The incident alerting directly into Slack and giving the ability to triage straight from there was a game changer. It’s so great that if I add new columns to some of the ingestion tables, [our data analyst] gets alerts from Monte Carlo. It’s like, ‘Look, here’s this schema change,’” said Dylan Hughes, Engineering Manager, Prefect.
39. Transition To A Data Mesh (Or Other Data Team Structure)
Sometimes it isn’t the data that moves, but the people. One of the hottest trends in data right now is the implementation of data mesh, a socio-technical concept that involves decentralizing the data team and embedding members within each business department or domain.
Moving toward a domain-first, data-as-a-product mindset can be difficult, and even more so without clear lineage from dataset to domain owner. Good thing then that online carpool network Blablacar had access to data lineage as part of their data mesh transition.
“When we decided we’re moving to a data mesh, the first thing we did was define our business domains and to do that we used Monte Carlo’s data lineage feature which helped us understand the dependencies,” said BlaBlaCar Data Engineering and BI Manager, Kineret Kimhi. “It helped untangle the spaghetti and understand what’s going on across over 10,000 tables, which would have been impossible to do manually.”
40. Prioritize Data Assets And Efforts
Data teams that take a “boil the ocean” approach to data quality will be stretched too thin, ultimately failing in their task.
Data observability can help teams determine and focus their maintenance efforts on their key assets–calculated based on the number of queries and dashboard consumers downstream. For data teams that already know their key assets or data products, data lineage can help highlight the dependencies upstream that should be maintained at just as high a level.
“We want to focus our attention on those things that are being used by the business,” said Braun Reyes, former lead data engineer, Clearcover. “By isolating these key assets in a specific Slack channel, it allows my team to just focus on those particular incidents.”
41. Improve Incident Documentation
It’s not the most obvious data observability use case, but having a centralized platform for detecting and resolving data issues also creates a central repository for incident documentation.
Since the impact radius of each incident is clear, teams can also create processes around what types of incidents and what levels of severity should be documented. This type of prioritization is helpful since your ability to ingest data is virtually limitless, but your capacity to document it is not.
Contentsquare saw their data incident documentation increase by 46% once they adopted a data observability platform. This is valuable institutional knowledge-sharing that gives the team a more comprehensive, nuanced understanding of the company’s data health.
“We can see it’s working, we can see people are solving [issues] faster, we can see they’re starting to engage,” said Otávio Bastos, former global data governance lead, Contentsquare. “We can see they’re starting to align themselves within every department to tackle these issues and create a better data environment for analysts to exploit data, create dashboards, create analysis, correlations, models, or any data product.”
42. Combat Alert Fatigue
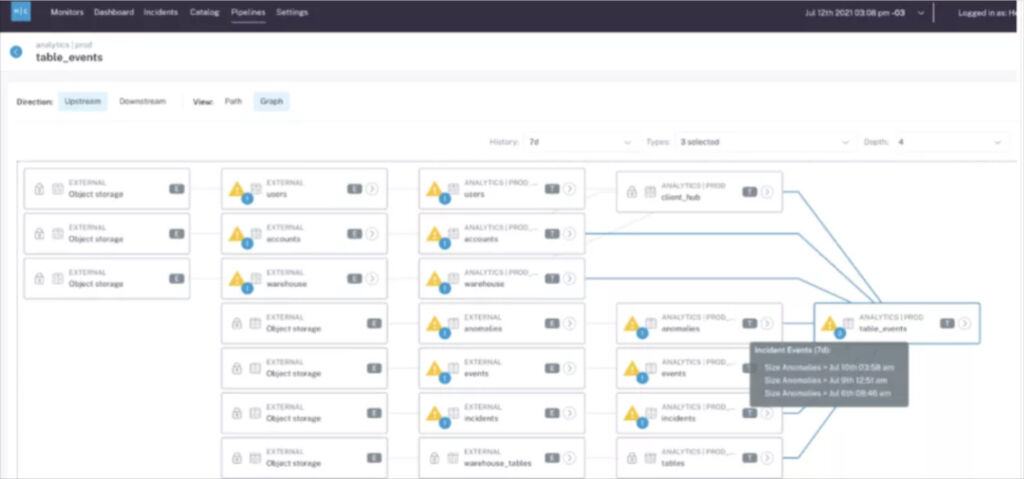
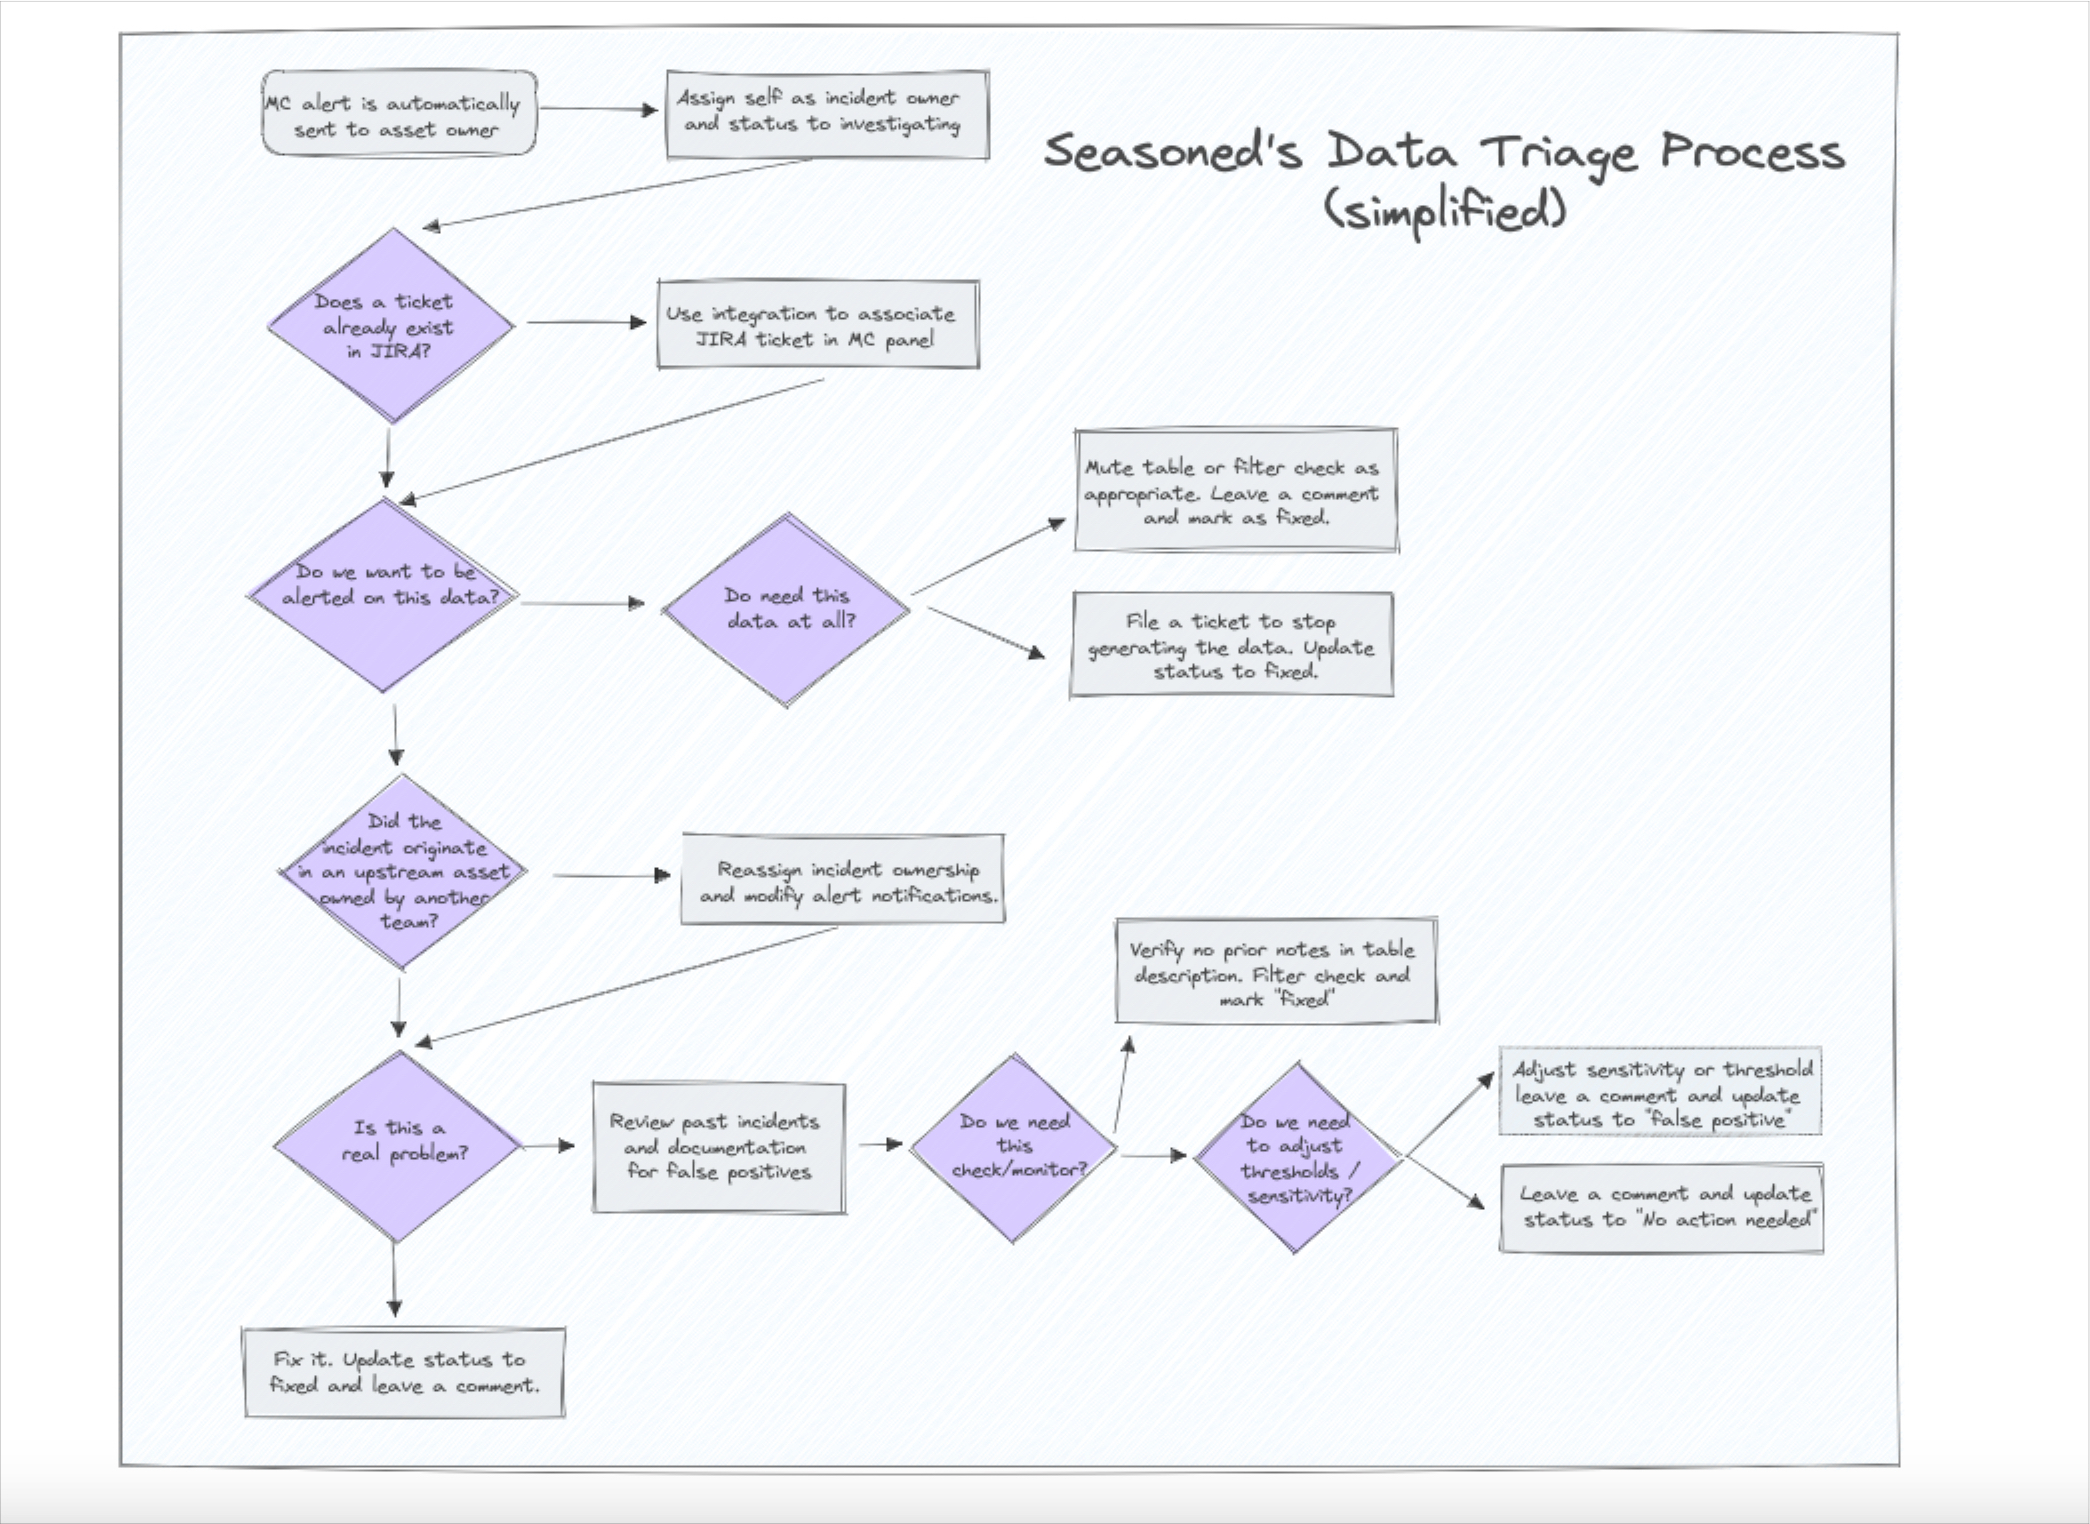
Imagine you have an issue with a table upstream that cascades into multiple other tables across several downstream layers as is the case in the image above. Do you want your team to get one alert or do you want to get 15 – all for the same incident?
The first option accurately depicts the full context along with a natural point to start your root cause analysis. The second option is akin to receiving 15 pages of a book out of order and hoping your on-call data engineer is able to piece together they are all part of a single story.
Not to mention, too many superfluous alerts is the quickest route to alert fatigue–scientifically defined as the point where the data engineer rolls their eyes, shakes their head, and moves on to another task.
Another way to help combat alert fatigue and improve incident detection is to set alert parameters to only notify you about anomalies with your most important tables. However, without native data lineage incorporated into your data observability solution, it’s difficult and time consuming to understand what assets truly are important.
For Checkout.com, the team found that their previous approach of manual data testing produced a slew of false positives which created alert fatigue.
“ML-based anomaly detection beats manual threshold basically any day of the week,” says Martynas. “If you actually try to look at [schema changes or anomalies] manually in your entire data warehouse, that’s what takes so much effort to actually capture. Now, since these models are actually constantly learning and they’re adapting to all the changes and load patterns, over time you get only very few false positives,” said Martynas Matimaitis, senior data engineer, Checkout.com.
Improve Visibility And Transparency
Effective data leaders create trust across their team and across the wider organization. Data observability increases visibility into data health as well as the actions being taken by data engineers to ensure high levels of data quality. Surfacing those efforts builds the data trust required by data driven organizations.
43. Increase Visibility Into Data Incident Management Workflows
One reason data leaders tend to underestimate the extent of their data quality problems is that much of the work can take place in siloes. Jacq in marketing notices a data issue and emails or directly messages a data engineer to fix it, or perhaps she files a ticket.
Either way, data leaders don’t often get visibility into the data incident detection and resolution process as it is unfolding. That’s why one of the most beloved data observability use cases for data leaders is the increased visibility into data incident management workflows.
“Being able to use Monte Carlo to have a workflow around, okay, somebody on the team has picked up the alert, they’ve marked it as a status, they’ve made comments…in the UI is really helpful,” said Jacob Follis, head of data, Collaborative Imaging.
“The alerting through Slack gives me immediate visibility. I can see when a developer picks up an issue for investigation and when it has been resolved,” said Adam Woods, CEO, Choozle.
44. Increase Visibility Into Other Domains And Decentralize Data Quality
In some organizations data quality is managed by a central team, but data operations are decentralized and owned at the domain level. It’s very difficult to be responsible for maintaining data quality when you don’t have full visibility into other domain’s processes.
Data observability gives central teams the ability to empower decentralized teams to monitor and improve their own data quality, while still retaining oversight.
For example, Checkout.com migrated toward a data mesh approach and multiple functional areas leveraged data in their work, the data team lacked visibility into data across domains. This visibility deficit threatened the team’s overarching mandate to maintain optimal levels of data freshness, data quality, and data latency.
“Giving the power back to the domain owners and the domain experts, I think, is one of the most important steps” in achieving improved data observability,” said Martynas Matimaitis, senior data engineer, Checkout.com.
Designating dedicated domains “creates an environment where the actual data owners who are the domain experts have visibility into their own data,” said Martynas. “And any issues that actually might come up are directed to them [rather than to the data team], which causes a lot faster turnaround, and there’s no longer a bottleneck on a single team.”
Vimeo also found considerable value by leveraging data observability to decentralize data quality while still keeping domain teams accountable.
“One of the things that helps us is we’re getting fancy reports which for me is a get out of jail free card. Now, whenever someone comes to me and says ‘hey the data is bad,’ I can find out where the data is bad and say ‘well you all haven’t been responsive to alerts for the past month, obviously it’s bad,’“ said Lior Solomon, former VP of data engineering, Vimeo.
45. Illustrate The Data Health “Big Picture”
In his article on data trust, my colleague Shane Murray talks about his experience at the New York Times when an executive approached him after a contentious meeting and asked, “Shane, so is the data trustworthy?”
His response at the time, “Some of it, if not precise, is at least directionally useful,” while honest, likely wasn’t satisfying to either party. With data observability, data leaders can show rather than tell the story of their organization’s overall data health.
“Monte Carlo is a very good way for us to understand our data quality at scale,” said Trish Pham, head of analytics, PayJoy.
“We didn’t have good visibility into the data health of the organization. We could see there were failures and we had KPIs, but they couldn’t give us the full landscape,” said Kineret Kimhi, data engineering and business intelligence manager, BlaBlaCar. “That’s when we realized we needed data observability because you can’t plan to find all the ways data will break with all of the unknown unknowns.”
Create Accountability
There are so many studies on the positive impacts of clear accountability, ownership, and goal setting that it is hard to cite just one.
The reality is that data quality is filled with tasks that are not quite as exciting as building new pipelines. Without accountability, mundane lower visibility tasks don’t always get done to the degree they should. Here are some data observability use cases that help create accountability across the data team.
46. Set Data SLAs
One of the best ways to create accountability is to set standards for datasets that ensure they remain valuable for their intended use. To do this, data teams need to gather requirements from the business, which is what Red Ventures director of data engineering, Brandon Beidel, set out to do as he met with every business team in a weekly cadence.
He’d ask
- How do you use this table?
- When do you look at this data? When do you report this data? Does this data need to be up to the minute, hourly, daily?
- What purpose does this serve?
- Who needs to get notified if this data is delayed?”
“I would also push back if I was told the data was important but no one could tell me how it was used. Conversations became more sophisticated and I would even get descriptions that could quickly transform into a query like, ‘no null values in this column,’” Brandon said.
Once data SLAs are set they need to be monitored and enforced, which is where data observability comes into play for organizations like PepsiCo, BlablaCar and Vimeo.
“We are planning to better define SLIs and SLOs using Monte Carlo,” said Sarger Saraiya, data platforms lead, PepsiCo.
“We’re still finalizing ownerships, but we have a process and understanding in place so we avoid a game of hot potato when there are issues,” said Kineret Kimhi, data engineering and business intelligence manager, BlaBlaCar. “We’re looking into data contracts as more of a carrot approach–if you want to participate in this amazing mesh then here are the things that you need to abide by including a data steward who will have a data contract with the central team that involves things like SLAs and API contracts you need to meet.”
We have spent a lot of the last year on creating data SLAs or SLOs making sure teams have a clear expectation of the business and what’s the time to respond to any data outage,” said Lior Solomon, former VP of data engineering, Vimeo.
47. Publish The Uptime of Your Data Products
If you have single use data products your data mesh is more silo than mesh. Publishing the uptime of each data product and its overall trustworthiness can encourage re-use across domains.
Once you’ve created a mechanism for self-service or discovery, go the extra mile to display both the reliability SLA as well as the percentage of time the product meets that SLA. This is the strategy Roche takes when building data products on their data mesh.
48. Create Clear Lines of Ownership
It’s hard to create accountability when your team isn’t sure who is responsible for which data assets. Fuzzy data lineage creates fuzzy ownership. Data observability not only helps draw those lines, but it also repeatedly creates opportunities for teams to draw better lines over time as was the case with Contentsquare and Vimeo.
“Both challenges are very correlated,” explained Kenza Zanzouri, data governance strategist, Contentsquare. “Identifying the right person for each specific data quality rule can reduce stress, ease the adoption, [and] address all Monte Carlo incidents correctly in a timely manner.”
“We started building these relationships where I know who’s the team driving the data set,” said Lior. “I can set up these Slack channels where the alerts go and make sure the stakeholders are also on that channel and the publishers are on that channel and we have a whole kumbaya to understand if a problem should be investigated.”
Build Data Trust With The Business
Simply put, trusted data leaders have trusted data. Data quality is an existential issue because there is no use case for low quality data.
49. Be First To Know
To paraphrase Ricky Bobby, “When it comes to data quality, if you ain’t first, you’re last.” Each data incident caught by data consumers insidiously pecks away at any levels of data trust you have established.
Unfortunately, most data teams are failing to clear this bar. In our recent survey, an astounding 74% of data professionals reported that business stakeholders identify issues first, “all or most of the time.”
It’s no surprise then that being the first to know about data incidents is one of the most popular data observability use cases. This way data teams can fix the issue with no one being the wiser or proactively notify impacted business teams.
“All of this speed and self-service access means little if our business colleagues don’t trust the data…” said Vitaly Lilich, former senior director of data, Freshly. “If data quality issues—the table hasn’t updated, there are too many or too few rows, the schema has changed, the data source has fed us garbage data with too many nulls, or whatever it might be– get to these end users then their trust in the data starts to fade. When that happens our ability to make an impact on business operations fades with it.”
“Time and again, our staff would approach my team and tell us the data is wrong, but we had no idea how the data broke in the first place,” said Doron Porat, director of data infrastructure, Yotpo. “It was clear to us that we had to gain better control over our data pipelines, as we can’t have our data consumers alerting us on data issues and keep getting caught by surprise, no one would be able to trust our analytics this way.”
“The self-service capabilities of data observability helped build back trust in data, as users were seeing us in action: going from a red alert to a blue “work-in-progress” to “resolved” in green,” said Gopi Krishnamurthy, former director of engineering, Blinkist. “They knew who was accountable, they knew the teams were working on it, and everything became crystal clear.”
50. Proactively Flag Application Bugs
One of the best ways to go from being seen as a reactive ticket taker to a proactive data leader is to not only fix issues within your data architecture, but to set up alerts that can help detect and solve application issues.
An increasingly popular data observability use case for data teams to apply custom monitors on user or customer identification fields coming from their external applications. If those show up NULL, something needs to be fixed.
“We like placing Monte Carlo field health monitors on user tables and particularly userID fields,” said Hatone Oshima, data reliability engineer, Mercari. “If we see NULL rates on those fields jump from 2% to 30%, we can help the team quickly find an application bug and backfill the data.”
“We collect daily engagement metrics on how our videos are performing, like views, likes, comments, and reactions,” said Vanna Triue, senior data engineering manager, Vox. “And we want to know if the metrics aren’t being collected, or if there are any sort of statistical anomalies that we should be checking for. So we have a custom check within Monte Carlo that meets the criteria we’ve set for the videos and our expectations for video performance.”
“We use field health monitors on our critical tables to look at things like the discount percentage. If the discount percentage is extremely high, or we’ve had a spike in people coming in with $0 orders that shouldn’t be, we take action fast,” said Nick Johnson VP of IT, data, and security Dr. Squatch.
“In some instances, Monte Carlo has notified us of bugs in our product because they notified us when data wasn’t being refreshed,” said Pablo Recio, data engineer, HotJar.
51. Keep Up With Hypergrowth
Everyone is moving fast when an organization is experiencing hypergrowth…and the data team better keep up if it wants to be seen as a true partner. Data observability provides the efficiencies and coverage at scale that allow data teams to keep pace with insane data demands.
For example, Yotpo has grown exponentially over the past few years expanding their operations globally and acquiring companies including Swell Rewards and SMSBump. As Yotpo grew, so too did the number of data sources and complexity of their data pipelines. Over time, it became harder to keep track of data completeness, lineage, and quality, three critical features of reliable data.
Contentsquare, BlaBlaCar, and Fox Networks also leverage data observability to keep pace with their fast moving business teams.
“When we say fast-growing, we have skyrocket growth,” said Otávio Bastos, former global data governance lead, Contentsquare. “The result [of that growth] is that we need near real-time business performance monitoring. And the challenge there is that teams are evolving so fast, new processes are being created, new data is evolving.”
“We started with this core product and suddenly acquired a bus line and then another company and all of a sudden we had multiple modes of transportation,” said Kineret Kimhi, data engineering and business intelligence manager, BlaBlaCAr. “It took us a year to add everything into the central warehouse, and we realized if we want to help the company grow and add more modes of transportation we need to find a way to scale. When we looked into it we realized that much of our capacity issues came from data quality issues popping up.”
“If you think about a centralized data reporting structure, where you used to come in, open a ticket, and wait for your turn, by the time you get an answer, it’s often too late,” said Alex Tverdohleb, VP of data services, Fox Networks. “Businesses are evolving and growing at a pace I’ve never seen before, and decisions are being made at a blazing speed. You have to have data at your fingertips to make the correct decision.”
52. Justify And Expand Data Investments
The exploding nature of data means few data leaders would say no to additional headcount. But in today’s macroeconomic environment, those investments need to be justified. This is made exponentially more difficult when the business doesn’t have trust in the data.
“We’re actually expanding our machine learning teams and going more in that direction. It would be hard to advocate for hiring more and taking on more risk for the business without creating that sense of trust in data,” said Lior Solomon, former VP of data engineering, Vimeo.
53. Improve CRM Quality
Data observability can create a data quality tide that lifts all boats, which includes the center of every sales operations professionals life: the customer relationship management platform.
Since customer data is particularly high value, some data teams will leverage custom rules within their data observability platform to focus specifically on CRM data quality.
For example, one data team used custom rules and field health monitors to check for duplicate data and missing fields such as address and other valuable contact information within the CRM system. This prompted an initiative that created a sustainable fix.
Improve MLOps
Because MLOps and data engineering are similar skill sets involving similar processes, data observability can be a very relevant use case. However, these platforms should not be confused for actual MLOps platforms that offer more advanced capabilities such as providing a model registry, log of all experiments, and helping to see the minute differences between model versions.
Here are some appropriate MLOps use cases for data observability platforms.
54. Trigger ML Model Retraining
One central question plaguing MLOps engineers is when to retrain a model.
Retraining too often is inefficient and adds unnecessary complexity. Retrain too infrequently and your models are operating on stale training data that is significantly different than what is currently flowing through production.
The ideal then, would be to retrain ML models immediately once they start underperforming. Some of the leading data teams have discovered ways to do exactly that by leveraging data observability to automatically monitor and alert when accuracy levels dip below acceptable standards. That is what JetBlue did as described by data scientist Derrick Olson in a recent Snowflake webinar.
Essentially, JetBlue runs a batch inference on their model that writes back to a Snowflake table so those predictions can be joined with the actual values to determine the mean absolute error.
That error margin is then monitored by Monte Carlo so if it reaches a certain point, an alert is sent. Their data science team can then proactively retrain their models and reach out to their stakeholders before they lose trust in the predictive models capabilities. The team is now starting to evaluate how Monte Carlo can not only monitor for model drift, but data drift as well by leveraging the Snowflake data share to signal when to trigger model retraining jobs.
55. Monitor For ML Model Feature Anomalies
ML models can drift when they are operating on stale data or when the data pipelines feeding them are experiencing issues, but they can also go wrong when the actual data itself, specifically the ML model features, experience anomalies.
For a real Monte Carlo example, one of our production models makes use of a “seconds since last metadata refresh” feature. This value is an integer, and in many places it’s stored as signed, meaning our system is perfectly happy ingesting a negative value for this feature. But we know that this value should never be negative, otherwise we’d be somehow measuring data from the future.
Feature stores are often complex, so it’s possible we never configured a test for this edge case. By placing field health monitors on your feature tables, a data observability platform can learn automatically that this field’s negative rate is 0%, and an alert would be sent to the MLOps engineer should this ever change.
A leading subscription based news company leverages Monte Carlo to automatically monitor their custom built feature store to prevent these types of scenarios from impacting the dozens of models they have in production.
56. Solve The Garbage In, Garbage Out Problem
Because features feed ML models downstream, this type of monitoring accelerates time to detection and can prevent drift/inaccuracies before they occur. By catching the issue upstream, it is also much easier to determine the feature anomaly as the root cause versus the many other variables that could be at play.
We’ve previously covered in depth why monitoring data pipelines that feed ML models is so important for preventing data quality issues from infiltrating each stage of the machine learning lifecycle.
But in summary, ML models are only as good as the input they are given. If the data pipeline is unreliable, then data scientists will need to spend more time cleaning data sets and ensuring they have all of the relevant data at hand. That’s exactly what a MLOps engineer is trying to prevent.
For example, one company’s custom acquisition model suffered significant drift due to data pipeline reliability issues. Facebook changed how they delivered their data to every 12 hours instead of every 24. Their team’s ETLs were set to pick up data only once per day, so this meant that suddenly half of the campaign data that was being sent wasn’t getting processed or passed downstream, skewing their new user metrics away from “paid” and towards “organic.”
Accelerate Self-Service Analytics And Data Democratization
Just like scaling a fundamentally flawed process doesn’t make it more efficient, so too is it a bad idea to broaden access to low quality data. This is why many data leaders will ensure they have a data observability solution in place prior to launching these efforts.
57. Enable Self-Service Analytics
If you don’t at least try to implement a self-service motion, you will need to start initiatives from scratch every time you lose a data engineer with that particular bit of tribal knowledge. That can’t scale.
It’s not just the destination that has value, but the journey itself. Along the self-service path are the pitstops of data documentation, literacy, discovery, and quality. All incredibly important to an organization in their own right. Data observability has a starring role of course as well.
For Fox Networks, the centralized data team control a few key areas: how data is ingested, how data is kept secure, and how data is optimized in the best format to be then published to standard executive reports. When the central team can ensure data sources are trustworthy, data is secure, and the company is using consistent metrics and definitions for high-level reporting, it gives data consumers the confidence to freely access and leverage data within that framework.
“Everything else, especially within data discovery and your ad-hoc analytics, should be free,” said Alex Tverdohleb, VP of data services, Fox Networks. “We give you the source of the data and guarantee it’s trustworthy. We know that we’re watching those pipelines multiple times every day, and we know that the data inside can be used for X, Y, and Z — so just go ahead and use it how you want. I believe this is the way forward: “striving towards giving people trust in the data platforms while supplying them with the tools and skill sets they need to be self-sufficient.”
“If you don’t approach your data from the angle that it’s easy to discover, easy to search, and easy to observe, it becomes more like a swamp,” said Alex.
58. Execute A Smooth Data Catalog Roll Out
It often makes sense to implement data observability prior to a data catalog initiative.
One e-commerce organization we worked with started their catalog initiative but the challenge was the value wasn’t immediately evident. Their users had a catalog of data assets with some context that was updated automatically, but they couldn’t differentiate the quality levels between datasets to determine what could be trusted.
Adoption was slow, which for data catalogs can be a time-to-value death spiral. Slow adoption means low ROI. Low ROI means limited business value for your data governance initiatives.
Go deeper and broader with your data quality coverage
Yes, data observability will save your team time on tedious data quality tasks, but it will also catch issues you otherwise would miss. Improving data quality coverage is a prime data observability use case.
59. Catch The Needle In The Haystack
Data observability allows you to drill deeper into your data to catch issues and anomalies that aren’t evident to data consumers or flagged by data testing. This is one of the most cited data observability benefits from data leaders at Contentsquare, Vimeo, Choozle, Farmer’s Dog, Optoro and more.
“We have some kind of unsupervised monitoring, and we can automatically start detecting some very important issues that cannot be detected by human beings,” said Otávio Bastos, former global data governance lead, Contentsquare.
“Suddenly I’m starting to become aware of problems I wasn’t aware of at all,” said said Lior Solomon, former VP of data engineering, Vimeo. “ For example, I had no idea that a specific data set would have an issue once a week where it would not be refreshed for two days.”
“Without a tool like this, we might have monitoring coverage on final resulting tables, but that can hide a lot of issues,” said Adam Woods, CEO, Choozle. “You might not see something pertaining to a small fraction of the tens of thousands campaigns in that table, but the advertiser running that campaign is going to see it. With Monte Carlo we are at a level where we don’t have to compromise. We can have alerting on all of our 3,500 tables.”
“When data that is used everyday breaks, you know instantly because someone always has eyes on it,” said Rick Saporta, former head of data strategy, Farmer’s Dog. “But then you have that other data – the kind that is critically important when used, but that is not looked at every day. Because of its nature, when it has the potential to silently break, unnoticed until right before the most critical of meetings.”
“Not only is this a huge win for Data Engineering in terms of trying to track down the needle in the haystack issues, but it helps us enable other data teams to help us keep trust in our data,” said Patrick Cambell, lead data engineer, Optoro. “Putting these frameworks in place takes Data Engineering out of being the middleman or woman in these situations…Data integrity really should be self-service. And your data engineers will thank you.”
60. Catch Unknown Unknowns
One of the biggest challenges with data testing is you have to anticipate all the clever ways data can break…and then set thresholds that will make sense over time. By leveraging machine learning monitors, data observability enables data teams to catch issues they didn’t expect. Oftentimes those are the most valuable to detect.
“We had a lot of dbt tests. We had a decent number of other checks that we would run, whether they were manual or automated, but there was always this lingering feeling in the back of my mind that some data pipelines were probably broken somewhere in some way, but I just didn’t have a test written for it,” said Nick Johnson VP of IT, data, and security Dr. Squatch.
“The first thing that was really interesting was this idea of your unknown unknowns…this anomalous alerting that would be set up on things that I probably wouldn’t even think to set up alerts on,” said said Dylan Hughes, Engineering Manager, Prefect.
“ELT is great, but there’s always a tradeoff,” said Braun Reyes, former lead data engineer, Clearcover. “For example, when you’re replicating data from your CRM into Snowflake, your data engineering team is not necessarily going to be the domain experts on CRM or marketing systems. So it’s really hard for us to tailor data quality testing across all of those sources.”
“Whether it’s custom SQL rules or dbt tests, you have to do that upfront configuration,” said Edward Kent, Technical Lead, Auto Trader UK. “You have to know in advance what it is you’re going to monitor, and go through the process of setting it up. For us, we have hundreds of data models defined and hundreds of tables built daily. We wanted something that would effectively get this off the ground and running without us having to put in that effort. The schema checks, the volume checks, the freshness checks that Monte Carlo offers delivers on that.”
61. Final Data Observability Use Case: Get A Good Night’s Rest
I won’t profess to understand how data leaders are using data observability as a sleep aid, but it has been mentioned so many times I would be remiss not to include it here. If I haven’t mentioned any data observability use cases relevant for your organization, perhaps at the very least you can use it to help you stop tossing and turning at night.
“By anticipating and communicating to the people who are interested in [data quality information], we actually created a revolution,” said Kenza Zanzouri, data governance strategist, Contentsquare. “Now, we can sleep tight at night. We know if anything happens with our data, we’re going to be alerted before our end users of our dashboard[s] see any problem.”
“I think any data leader will tell you one of the things that keep them up at night is whether or not their data’s ready for the morning’s reports or the next day’s analytics,” said Rob Parker, former senior director of data and analytics, Gitlab.
“Our execs rely on my team’s dashboards to make decisions. With Monte Carlo, we know exactly what to update when there’s a change in our data, so there’s no downtime and no fire drills. Our decision makers are happier and I can sleep at night,” said Yoav Kamin, former director of business performance, Yotpo.
Want to go deeper on one of these data observability use cases? Talk to our team by setting a time in the form below.
Our promise: we will show you the product.
Read more posts.