Product demo.
  What is data observability?
  What is a data mesh--and how not to mesh it up
  The ULTIMATE Guide To Data Lineage
 Databricks Lakehouse Monitoring vs. Data Observability – What’s the Difference?

Michael Segner
Michael writes about data engineering, data quality, and data teams.
One of the stars taking center stage at the Databricks’ Data + AI Summit this year was their latest data quality feature, Lakehouse Monitoring.
If you were looking for a sign or additional validation that data quality needs to be at the top of the list for data teams supporting analytical, machine learning, and AI use cases, look no further. As we’ve been saying for years: to achieve stakeholder trust, data teams need a comprehensive understanding of the health and performance of data within their systems!
Now that Lakehouse Monitoring has entered public preview, more details have emerged that can help data teams understand its value and where it fits within their data reliability stack.
In this post, we’ll introduce Lakehouse Monitoring and when it makes sense to start leveraging a data observability platform like Monte Carlo.
Table of Contents
What is Databricks Lakehouse Monitoring?
Lakehouse Monitoring is a feature available for premium tier and above Databricks users that automatically monitors data pipelines and AI models within the Databricks ecosystem.
Every monitor will automatically generate three new assets within Databricks upon its creation: a profile metrics table, a drift metrics table, and a dashboard. Dashboards display metrics on a per monitor basis. In other words, each monitor corresponds to a specific dashboard and vice versa.
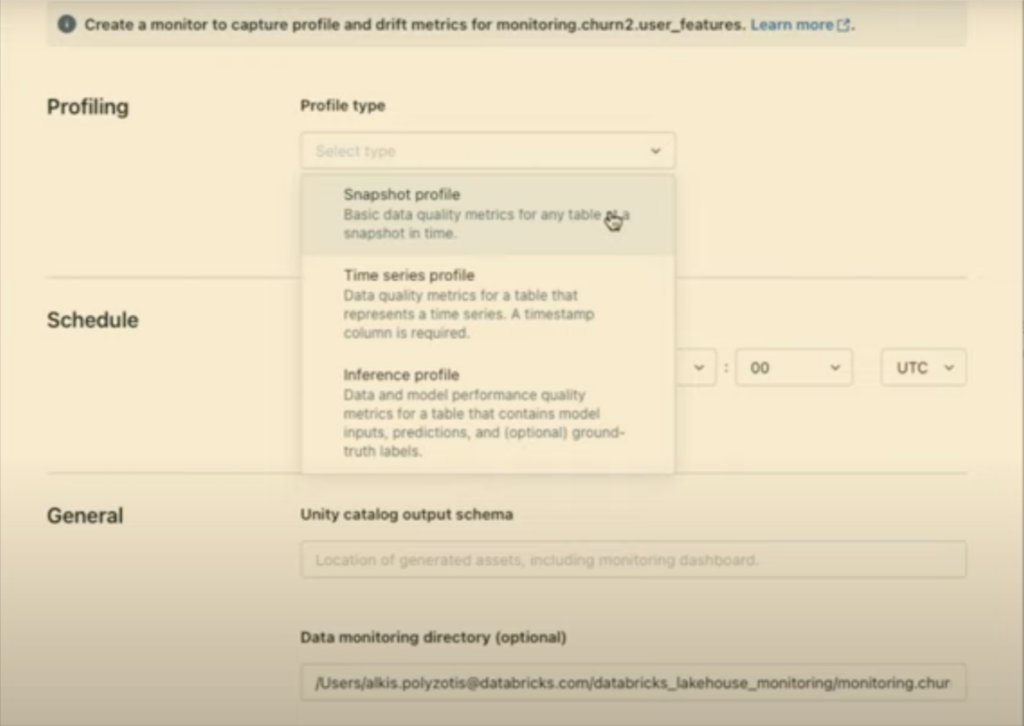
These monitors are opt-in, meaning they must be set ahead of time and applied to each table to catch any data quality issues associated with that asset. Alerting is limited to email, but webhooks can be used for other communication methods.
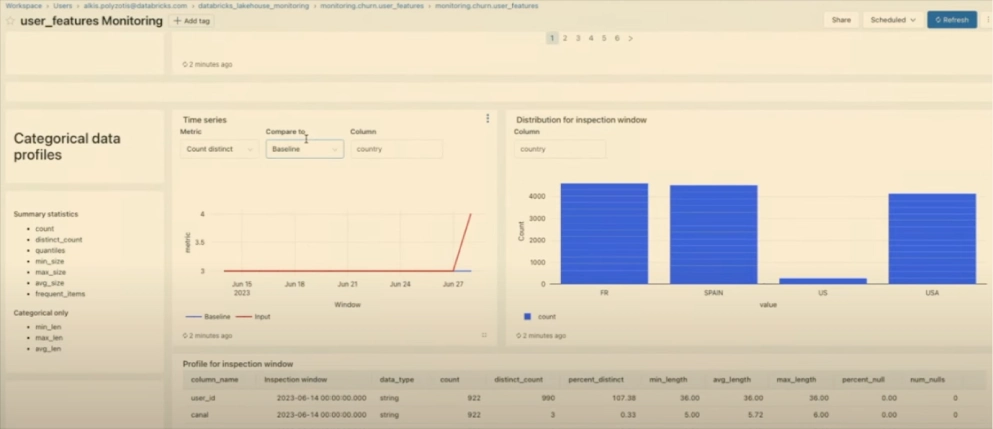
At its core, Lakehouse Monitoring tracks data quality anomalies, machine learning drift metrics, and (optionally) PII, with a few features that assist with root cause analysis such as segmentation analysis and data lineage via Unity Catalog.
When to use Lakehouse Monitoring
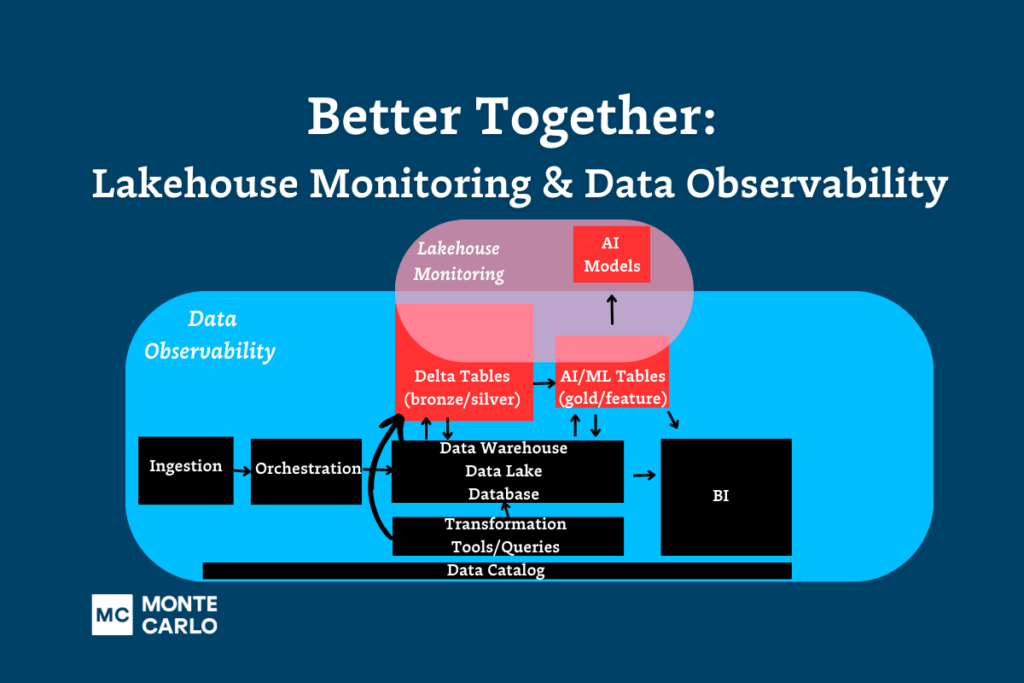
Lakehouse Monitoring is ideally suited for MLOps teams monitoring the drift of AI models hosted within the Databricks platform. It can also be useful for data monitoring use cases involving smaller teams that have built data pipelines (ingestion, transformation, consumption) entirely within the Databricks platform.
Deployments will likely be focused on gold-level aggregate/feature tables where the data scientist or ML engineer desires a bit more visibility into the quality of the data feeding a specific model.
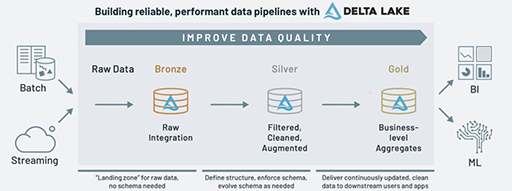
This makes sense when you think about Databricks’ medallion architecture philosophy, which takes an incremental approach to improving data quality across each data curation layer.
Lakehouse Monitoring capabilities are also going to be limited to the Databricks ecosystem and oftentimes without the context of how data is ingested, transformed outside of Databricks, consumed by BI or other data stores and applications.
The data observability difference
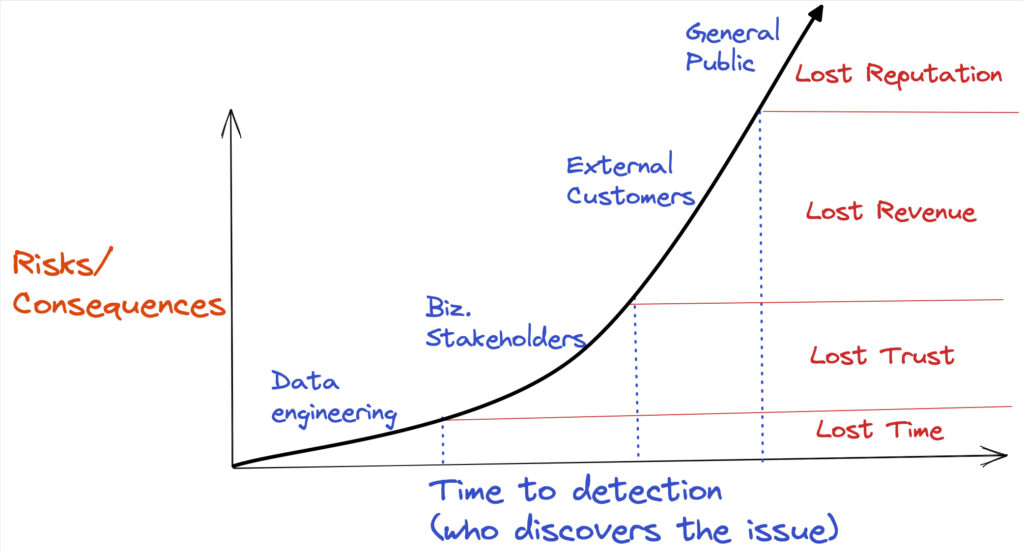
Unlike monitoring, data observability facilitates more scalable and comprehensive data reliability workflows that reduce time to detection and resolution while unlocking opportunities for incident prevention.
Rather than taking a table by table approach within a discrete part of the stack, data observability holistically addresses how data, pipelines, products, platforms, teams, and consumers interact at the system level.
This means broad end-to-end pipeline coverage, integrations across the modern data stack, and data reliability workflows that scale. Let’s look at each in more detail.
Coverage from ingestion to consumption
Monte Carlo’s data observability philosophy is rooted in end-to-end coverage, from when data first lands to when it has been transformed into its final form and ready for consumption.
At the feature level, this translates to data freshness, volume (too many or too few rows), and schema change monitors that automatically deploy across all tables as they are created. This broad monitoring, which includes all tables upstream of active data products, provides numerous benefits such as:
- Accelerating time to detection and improves data trust;
- Increasing visibility into issues obfuscated later in the pipeline;
- Coverage for cases where queries and data usage occur in earlier layers; and
- Additional context for root cause analysis
Data observability platform users supplement this “safety net” coverage by choosing where to deploy detectors that monitor the quality of the data itself (similar to a Lakehouse Monitoring time series profile monitor) or with custom rules.
Integrations across the modern data stack
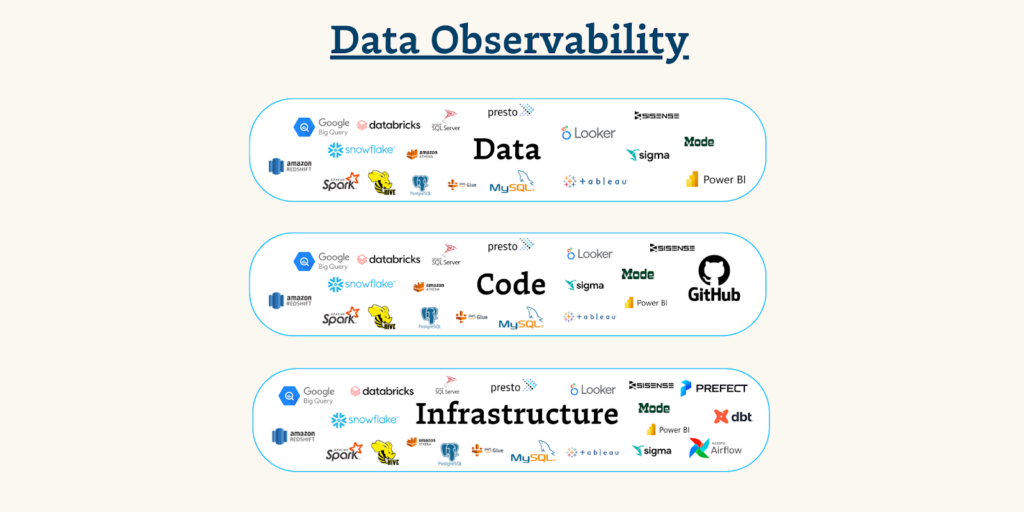
Data observability platforms integrate across the modern data stack, which is critical because data quality can be impacted by any of these infrastructure systems. In fact, data quality can be impacted across the infrastructure, code, and data levels.
Segmentation analysis, a feature found within both Lakehouse Monitoring and data observability, works at the data level. It could determine, for example, if a column’s unique values dropping 50% is strongly correlated with a large percentage of bad rows in a particular segment.
But there are a lot of other possibilities. Did a job fail? Was a dbt model modified? Was data filtered inadvertently by the changing logic of a transformation job? Is data just being duplicated upstream?
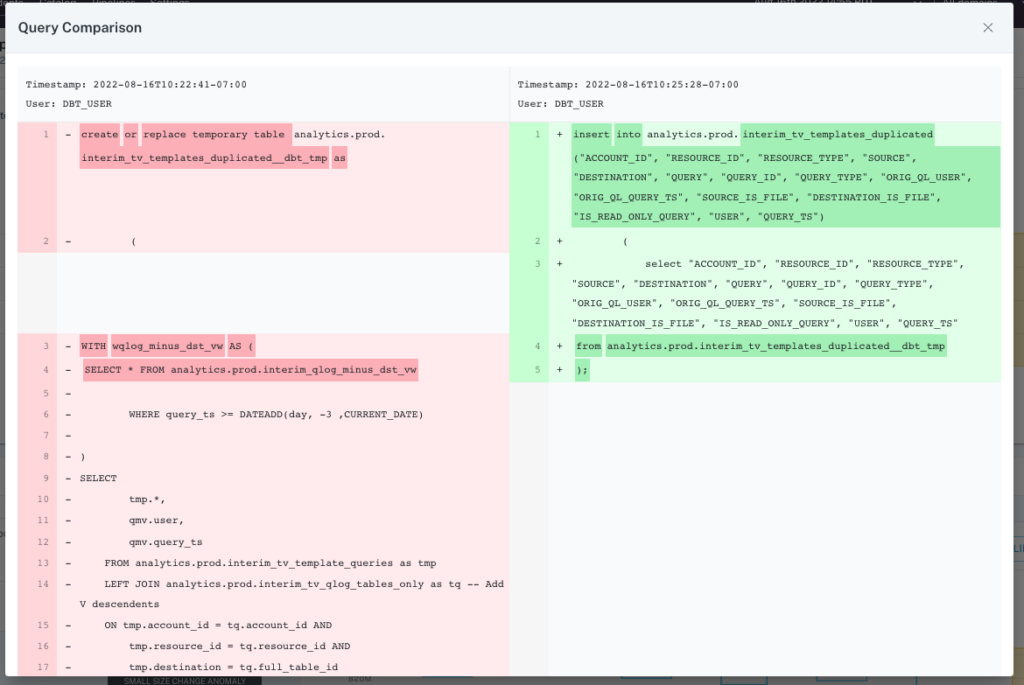
To answer these questions you need incident resolution features that work across all three levels to quickly identify the root cause. For example, Monte Carlo can also help at the code level with query insights and change detection that help fix issues introduced during the transformation process.
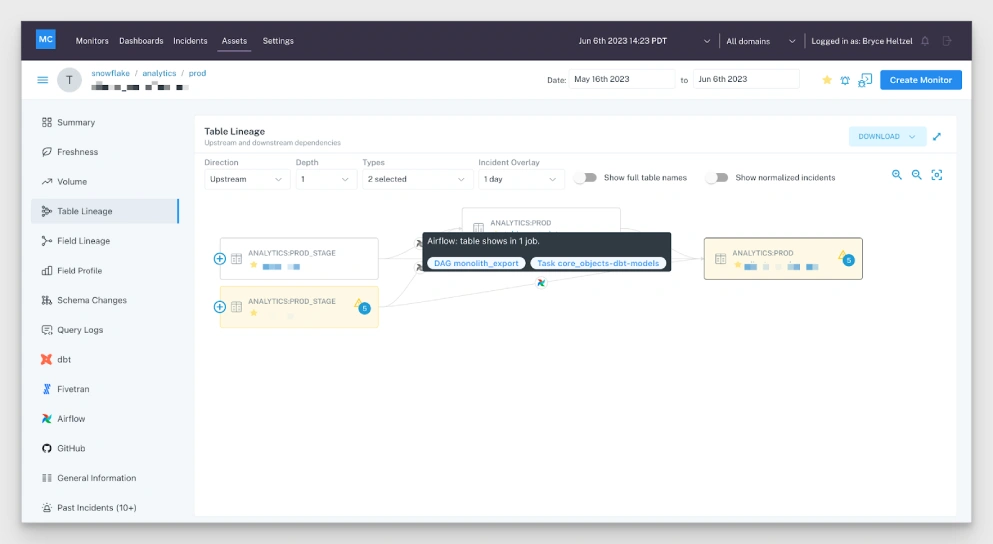
Monte Carlo helps at the infrastructure level thanks to seamless integrations with: Fivetran, Airflow, Prefect, dbt, GitHub, and most major business intelligence tools. Without these integrations, something like a dbt model or Fivetran sync failure could become a pipeline blindspot making incidents difficult to detect and fix.
Not to mention that when it comes to resolving data issues, one of the most important steps is triaging. This prioritization is only possible with data observability platform’s integration at the BI layer so that teams can understand how many dashboard and data consumers are impacted by an incident in an upstream table.
Of course it almost goes without saying–Lakehouse Monitoring is great for monitoring the eponymous lakehouse, but most data teams use one or many of these modern data stack solutions. It is even common for organizations to use a data warehouse or transactional database alongside their lakehouse. Or they may use a data lake with a metastore like Hive or AWS Glue.
In all these cases, it’s important to have a single pane of glass to observe the health of these data systems, which is where data observability has you covered.
Data quality at scale
A programmatic approach to data quality requires processes that go beyond the scope of Lakehouse Monitoring.
We’ve mentioned a couple already: 1) monitors that scale across tables automatically as they are created and 2) incident resolution features that accelerate root cause analysis at the infrastructure, code, and data levels.
Just as important, however, is how data observability platforms enable data engineers to collaborate with one another and communicate with their data consumers. Why?
Data reliability is a team sport, and while there are many legitimate ways for organizing those teams, generally accountability is best achieved through a “you build it, you own it” approach. Not only does this create the right incentives to design for reliability from the start, but the builder will almost always have the best context from which to fix issues.
To enable this type of approach, teams need to get the right alert to the right person at the right time. And to do that, teams must understand how different alerts map to different components of the stack to determine the right owner as well as measure how each component contributes to the overall reliability of the larger system.
For example, Monte Carlo enhances visibility, accountability, and ownership of each data asset by allowing teams to logically group them by domains and by data product. This produces deep insights without losing sight of the big picture.
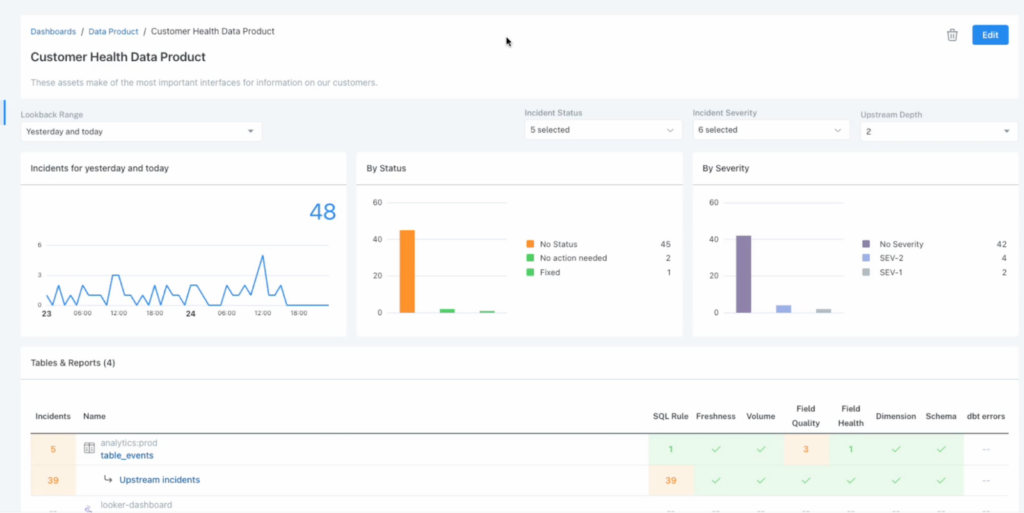
This categorization, along with key asset scores that denote the relative popularity of each asset, also give teams incredible control over their notification strategy to ensure the right alert reaches the right audience in the right Slack/Teams channel.
Integrations with platforms like JIRA or PagerDuty provide an additional means of creating, tracking, and collaborating on incident tickets while integrations with data catalogs can assist with data consumer communication by displaying the current incident status on impacted dashboards.
This scales much more effectively than per table dashboards or simple email notification workflows in Lakehouse Monitoring, allowing teams to be more effective and benefit from broader coverage without risking alert fatigue.
Lakehouse Monitoring and data observability: better together
Lakehouse Monitoring is a great feature that will be a natural starting point for some data teams before they graduate to data observability’s more scaled approach.
However, it’s important to note that it doesn’t have to be an either/or choice. Just like some teams use data testing and data observability in complementary ways, the same can be true with Lakehouse Monitoring.
And, just like with data testing, most teams will find Lakehouse Monitoring an ideal check for
specific components of their pipeline while leveraging data observability to do what it does best: reducing data downtime through broad coverage and in-depth root cause analysis tooling.
If you have any questions about how other teams are using Lakehouse Monitoring or are currently using it and interested in expanded coverage, talk to us! Schedule a time using the form below.
Our promise: we will show you the product.
Read more posts.