Product demo.
  What is data observability?
  What is a data mesh--and how not to mesh it up
  The ULTIMATE Guide To Data Lineage
 The 31 Flavors of Data Lineage And Why Vanilla Doesn’t Cut It


Lior Gavish
CTO and Co-founder, Monte Carlo. Programming wizard and lover of cats.
Data lineage, an automated visualization of the relationships for how data flows across tables and other data assets, is a must-have in the data engineering toolbox.
Not only is it helpful for data governance and compliance use cases, it also plays a starring role as one of the 5 pillars of data observability. Data lineage both accelerates a data engineer’s ability to understand the root cause of a data anomaly, as well as the potential impact it may have on the business.
As a result, data lineage’s popularity as a must-have component of modern data tooling has skyrocketed faster than a highschooler with parents traveling out of town for the weekend. Almost all data catalogs have introduced data lineage in the last few years, and more recently, some of the big data cloud providers such as Databricks and Google (as part of Dataplex) have announced data lineage capabilities.
It’s great to see that so many leaders in the space, like Databricks and Google, are realizing the value of lineage for use cases across the data stack, from data governance to discovery.
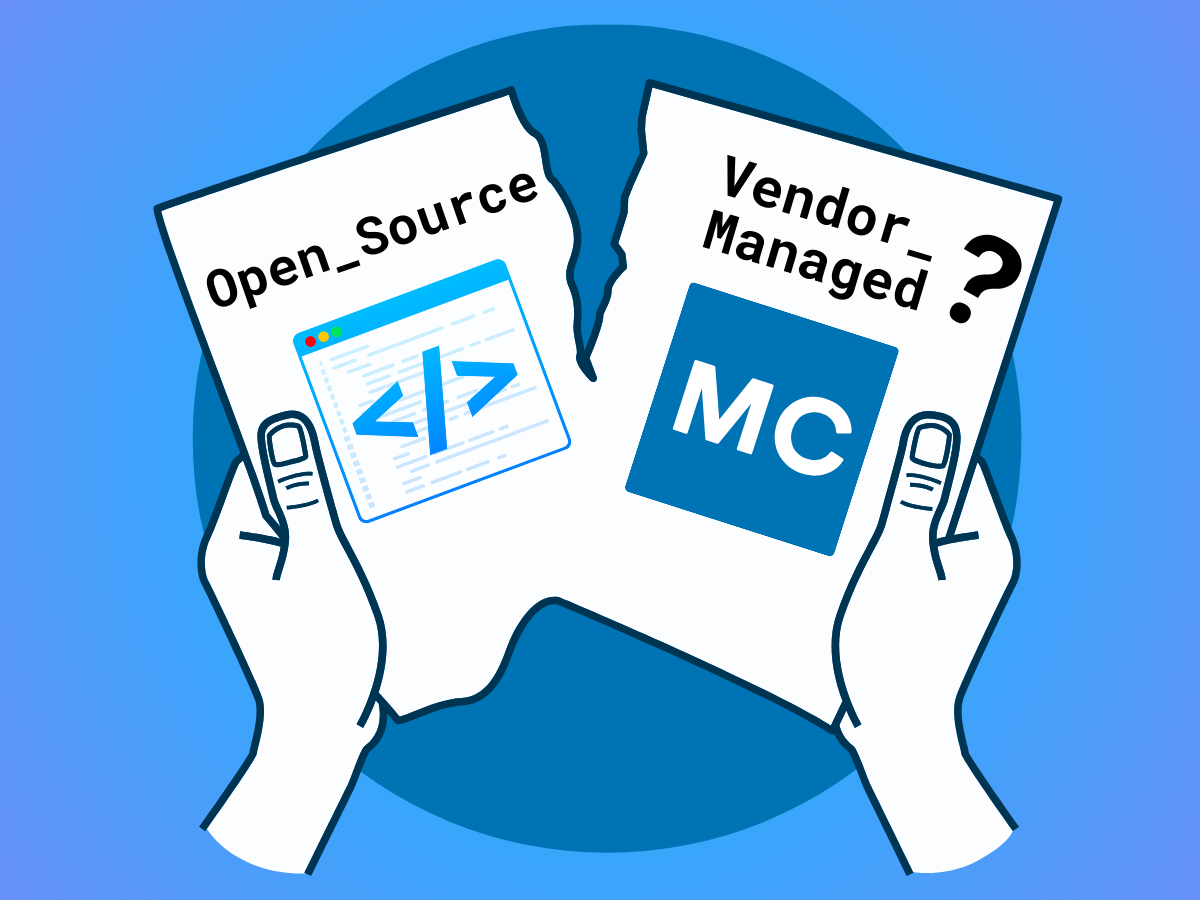
But now that there are multiple solutions offering some flavor of data lineage, the question arises, “does it still need to be a required feature within a data observability solution?”
The answer is an unequivocal, “yes.” When it comes to tackling data reliability, vanilla lineage just doesn’t cut it. Here’s why…
#1. Data Lineage Informs Incident Detection and Alerting
Data lineage powers better data quality incident detection and alerting when it’s natively integrated within a data observability platform.
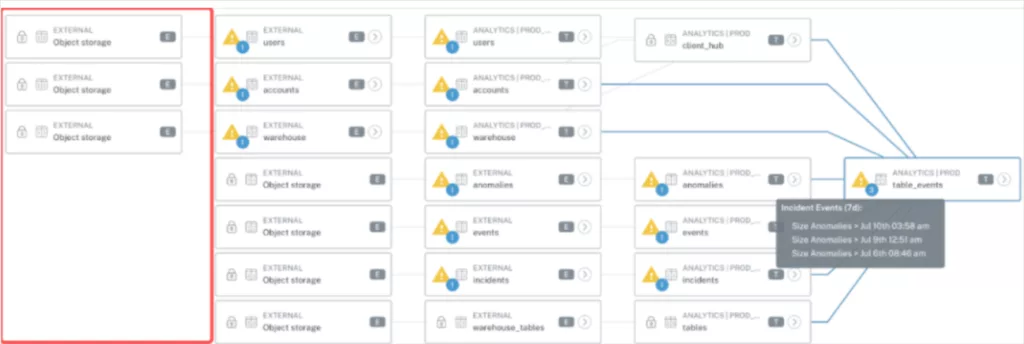
For example, imagine you have an issue with a table upstream that cascades into multiple other tables across several downstream layers. Do you want your team to get one alert or do you want to get 15 – all for the same incident?
The first option accurately depicts the full context along with a natural point to start your root cause analysis. The second option is akin to receiving 15 pages of a book out of order and hoping your on-call data engineer is able to piece together they are all part of a single story.
As a function of data observability, data lineage pieces together this story automatically, identifying which one is the climax and which ones are just falling action.
Not to mention, too many superfluous alerts is the quickest route to alert fatigue–scientifically defined as the point where the data engineer rolls their eyes, shakes their head, and moves on to another task. When your incident management channel in Slack has more than 25 unread messages all corresponding to the same incident, are you really getting value from your data observability platform?
One way to help combat alert fatigue and improve incident detection is to set alert parameters to only notify you about anomalies with your most important tables. However, without native data lineage, it’s difficult and time consuming to understand what assets truly are important.
One of the keys to operationalizing data observability is to ensure alerts are routed to the right responders–those who best understand the domain and particular systems in question. Data lineage can help surface and route alerts to the appropriate owners on both data team and business stakeholder sides of the house.
#2. Data Lineage Accelerates Incident Resolution
Data engineers are able to fix broken pipelines and anomalous data faster when data lineage is natively incorporated within the data observability platform. Without it, you just have a list of incidents and a map of table/field dependencies, neither of which are particularly useful without the other.
Without incidents embedded in lineage, those dots aren’t connected–and they certainly aren’t connected to how data is consumed within your organization. For example, data lineage is essential to the incident triage process. To butcher a proverb, “If a table experiences an anomaly, but no one consumes data from it, do you care?”
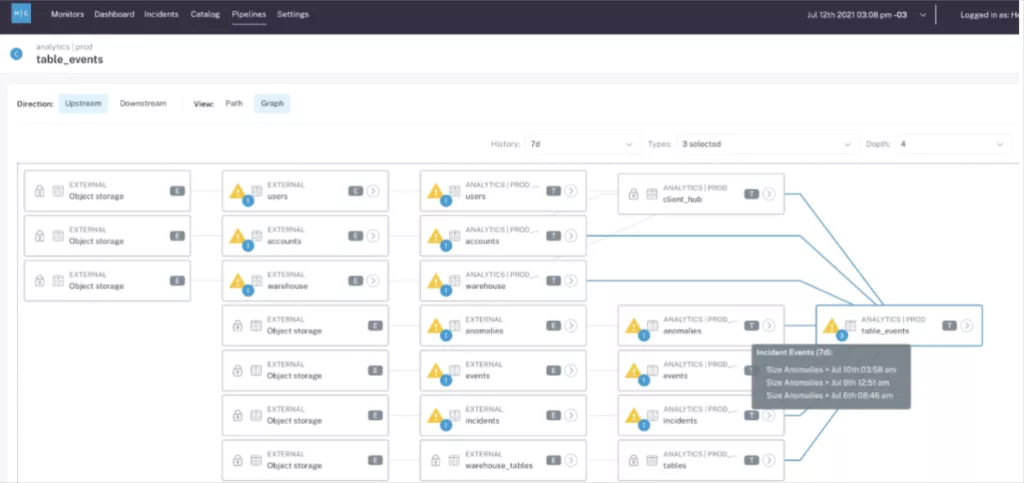
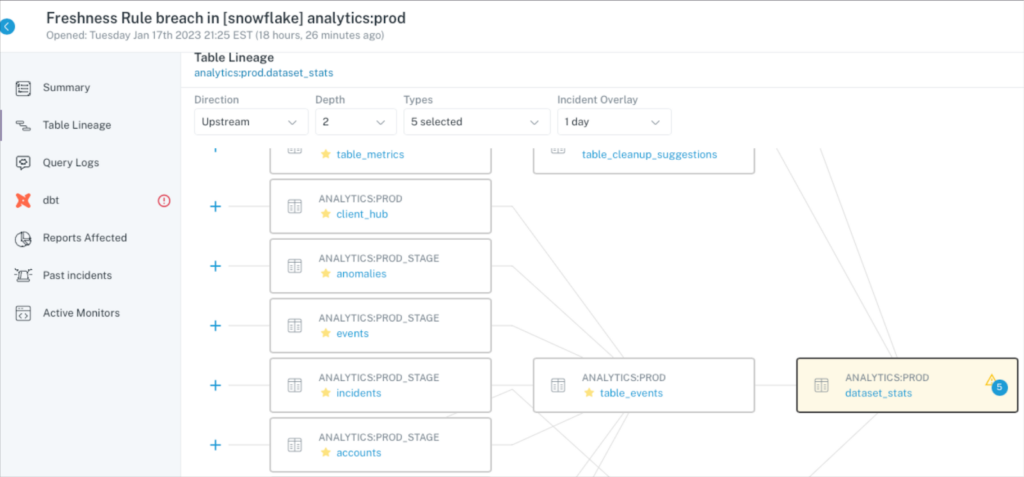
Tracing incidents upstream across two different tools is a disjointed process. You don’t just want to swim to the most raw upstream table, you want to swim up to the most upstream table where the issue is still present.
Remember the data lineage diagram from earlier? Within our data observability platform, we can quickly and definitively see incidents were not introduced a level further upstream.
Of course, once we arrive at our most upstream table with an anomaly, our root cause analysis process has just begun. Data lineage gives you the where but not always the why. Data teams must now determine if it is:
- A systems issue: Did an Airflow job not run? Were there issues with permissions in Snowflake?
- A code issue: Did someone modify a SQL query or dbt model that mucked everything up?
- A data issue: Did a third-party send us garbage data filled with NULLs and other nonsense?
Data lineage is valuable, but it is not a silver bullet for incident resolution. It is at its best when it works within a larger ecosystem of incident resolution tools such as query change detection, high correlation insights, and anomalous row detection.
Finally, data lineage will be an essential tool for some of the most innovative, advanced incident resolution features to come. If you want to explore these infinite possibilities, check out this in-depth think piece on How ELT Schedules Can Improve Root Cause Analysis For Data Engineers.
#3. A Single Pane of Glass
Sometimes vendors say their solution provides “a single pane of glass” with a bit too much robotic reverence and without enough critical thought toward the value provided. Nice to look at, but not very useful.
How I imagine some vendors say, “a single pane of glass.”
In the case of data observability, however, a single pane of glass is integral to how efficient and effective your data team can be in its data reliability workflows.
I previously mentioned the disjointed nature of cross referencing your list of incidents to your map of data incidents, but it’s important to remember data pipelines extend beyond a single environment or solution. It’s great to know data moved from point A to point B, but your integration points will paint the full story of what happened to it along the way.
Not all data lineage is created equal; the integration points and how those are surfaced are among the biggest differentiators. Are you curious how changes in dbt models may have impacted your data quality? If a failed Airflow job created a freshness issue? If a table feeds a particular dashboard? Well, if you are leveraging lineage from Dataplex or Databricks to resolve incidents across your environment, you’ll likely need to spend precious time piecing together information.
Does your team use both Databricks and Snowflake and need to understand how data flows across both platforms? Let’s just say I wouldn’t hold our breath for that integration anytime soon.
#4. The Right Tool For The Right Job
Ultimately, this decision comes down to the advantages of using the right tool for the right job.
Sure, your car has a CD player, but it would be pretty inconvenient to sit in your garage every time you’d like to hear some music. Not to mention the sound quality wouldn’t be as high and the integration with Amazon Music account wouldn’t work.
The parallel here is the overlap between data observability and data catalog solutions. Yes, both have data lineage features, but they are designed within much different contexts.
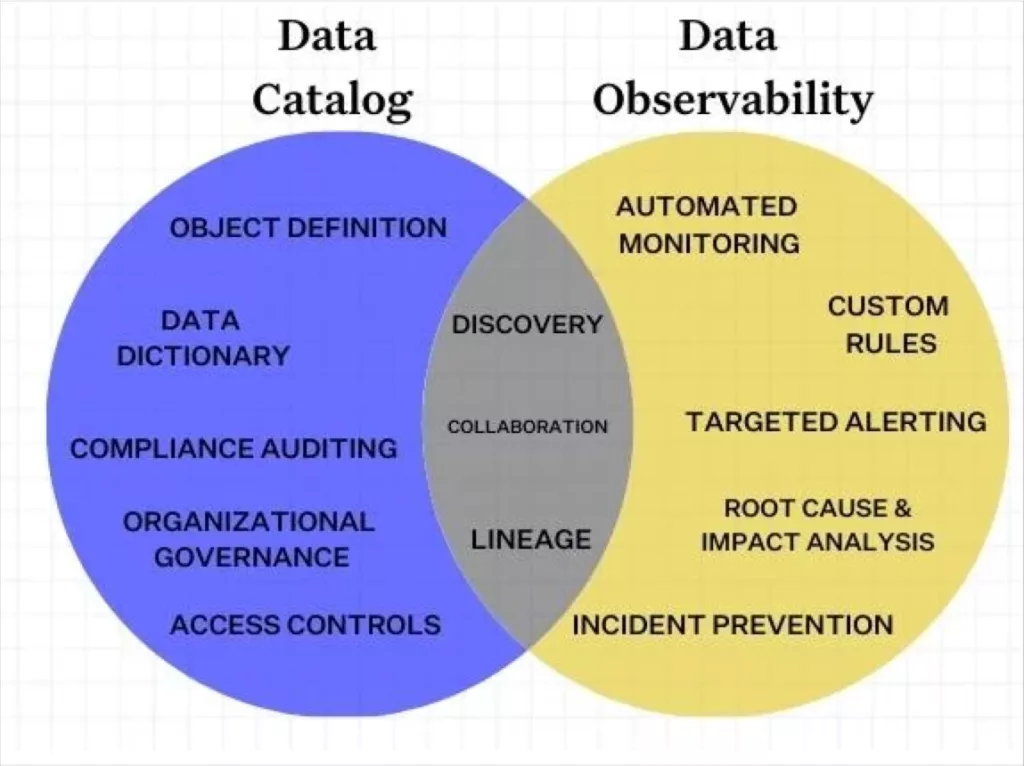
For instance, Google developed their lineage features with compliance and governance use cases in mind, and Databricks has lineage for cataloging and quality across native Databricks environments. So while data lineage may appear similar at first glance–spoiler alert: every platform’s graph will have boxes connected by lines–the real magic happens with the double click.
For example, with Databricks you can start with a high-level overview of the lineage and drill into a workflow. (Note: this would be only internal Databricks workflows, not external orchestrators.)
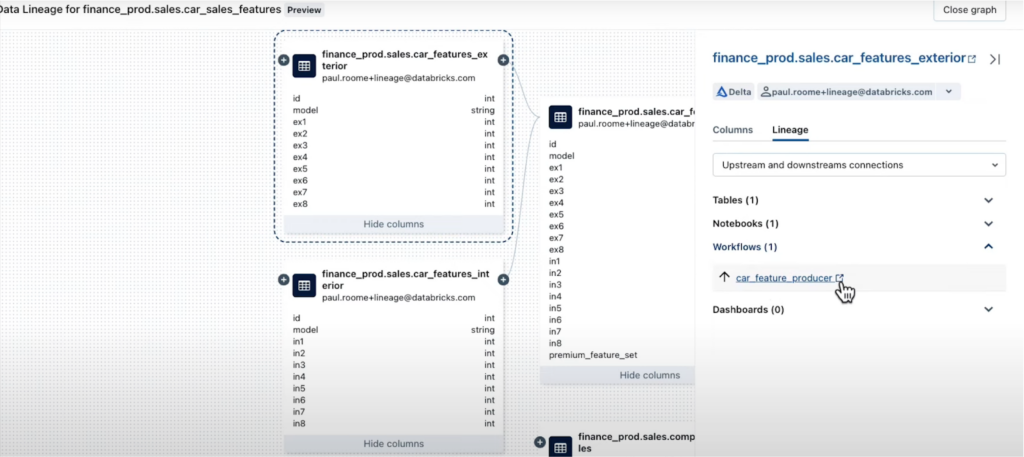
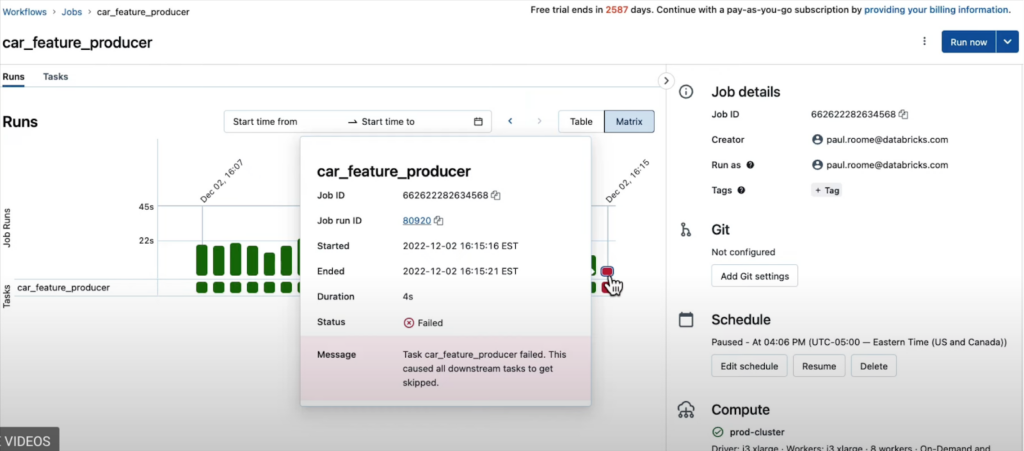
You could then see a failed run time and another click would take you into the code (not shown).
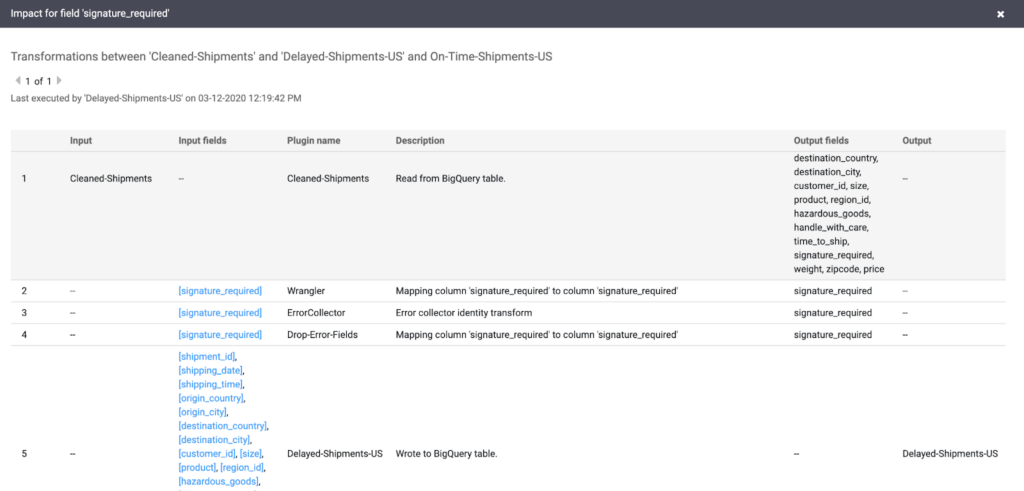
Dataplex data lineage is similar with a depiction showing the relationships between datasets (like Monte Carlo and Databricks, they too can go to the field-level):
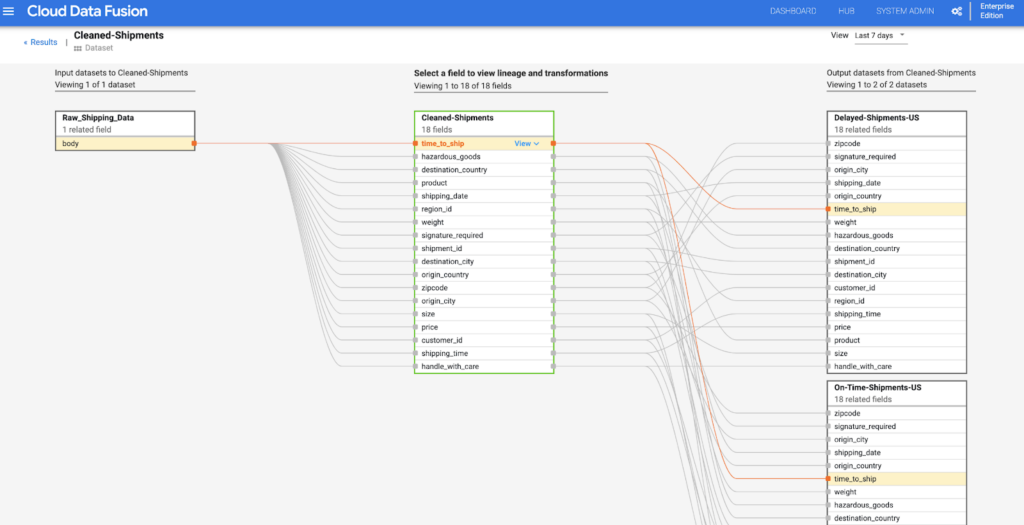
The subsequent drill down allowing you to run an impact analysis is helpful, but for a “reporting and governance” use case.
A data observability solution like Monte Carlo takes these high-level lineage diagrams a step further, down to the BI level, which as previously mentioned is critical for incident impact analysis.
On the drill down, Monte Carlo provides all of the information shown across both tools plus a full history of queries run on the table, their runtimes, and associated jobs from dbt. Key data insights as reads/writes, schema changes, users, and latest row count are surfaced as well.
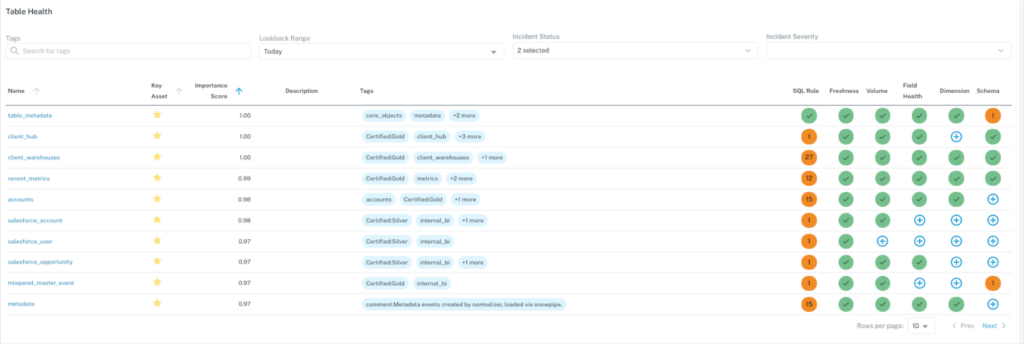
Additionally, tables can be tagged (perhaps to denote its reliability level) with descriptions perhaps (to include information on SLAs and other relevant information).
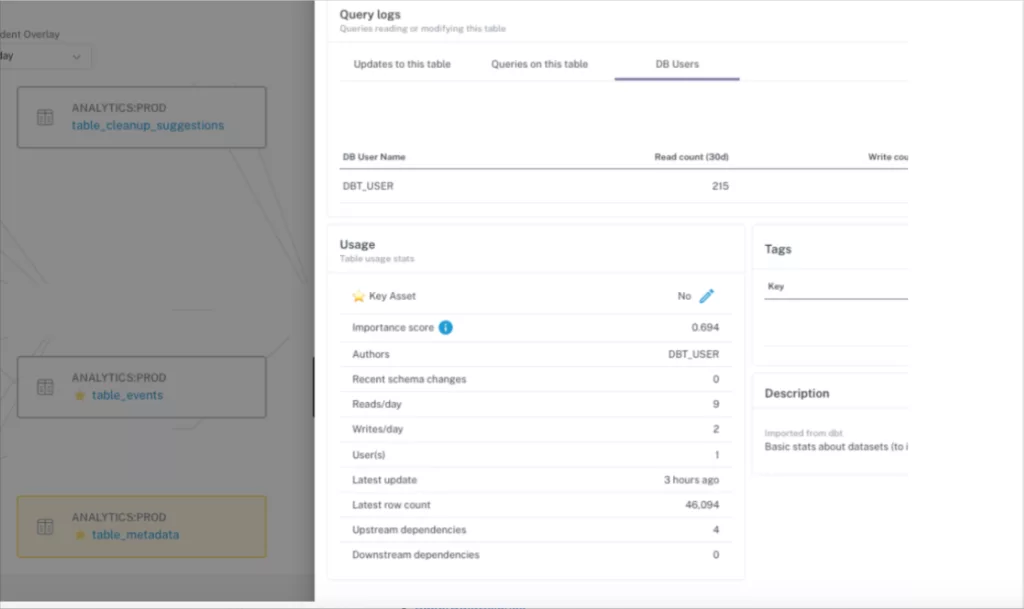
A left sidebar provides more context for data quality troubleshooting such as active monitors being run on the table, past incidents, dashboards impacted, owners, alert channels, users impacted (both at the warehouse and BI levels), and more.
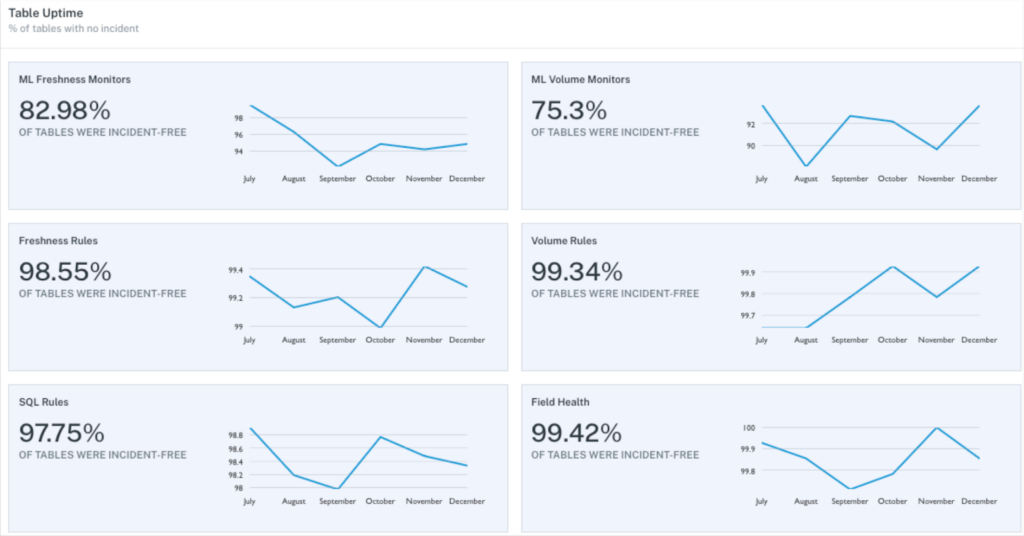
Taking a step beyond the lineage UI for a moment, it’s important to also realize that Monte Carlo’s data reliability dashboard–fueled by the same lineage metadata–can also go a step further by showing the data quality “hot spots” …
…uptime/SLA adherence
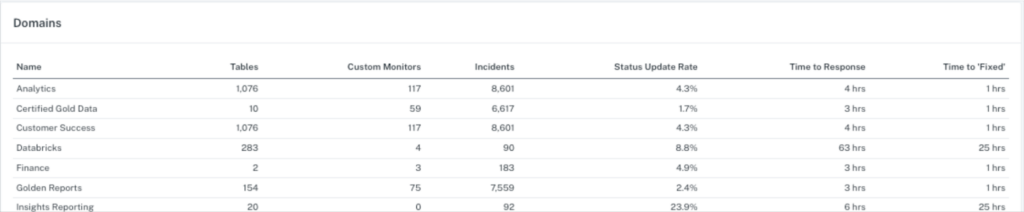
…and custom monitors, incidents, and time-to-fixed by domain (or any other category leveraged by tags).
Conclusion: Get The Sundae

As data has become more crucial to business operations, the data space has exploded with many awesome and diverse tools. There are now 31 flavors instead of your typical spread of vanilla, chocolate, and strawberry.
This can be as challenging for data engineers as it is exciting. Our best advice is to not get overwhelmed and let the use case drive the technology rather than vice versa. Ultimately, you will end up with an amazing, if sometimes messy, ice cream sundae with all of your favorite flavors perfectly balanced.
See how data lineage and data observability work together and get a demo of the Monte Carlo platform by selecting a time using the form below.
Our promise: we will show you the product.
Read more posts.