The Data Engineer & Scientist’s Guide To Root Cause Analysis for Data Quality Issues
Data pipelines can break for a million different reasons, and there isn’t a one-size-fits all approach to understanding how or why. Here are five critical steps data engineers must take to conduct engineering root cause analysis for data quality issues.
While I can’t know for sure, I’m confident many of us have been there.
I’m talking about the frantic late afternoon Slack message that looks like:

This exact scenario happened to me many times during my tenure at Segment. As the PM for Protocols, our data governance tool, I spent a lot of time thinking about and building dashboards to evaluate the quality of data our customers were sending to Segment.
As the owner of this product, any issues with these dashboards came directly to me. My approach to solving these issues boiled down to two steps:
- Frantically ping that one data engineer who had been on our team for 4+ years (decades of historical knowledge in engineering time) to ask for urgent help.
- If she wasn’t available, spending hours debugging this pipeline by spot-checking 1000s of tables 1:1.
You get the idea.
After talking to and working with dozens of data engineering teams over the years, I’ve learned that conducting root cause analysis (RCA) on a data quality issue can either be as simple as looking at the Airflow logs, or as complex as introspecting 5+ systems to determine that an upstream data vendor added a few trailing whitespace characters to a handful of record values.
In this article, I’ll summarize my learnings and walk through a five-step approach to make this process faster, a little less painless, and much more efficient the next time this happens to you.
What makes a successful engineering root cause analysis?
When data downtime strikes, the first step (well, after pausing your pipeline) is to identify what broke.
In theory, root causing sounds as easy as running a few SQL queries to segment the data, but in practice, this process can be quite challenging. Incidents can manifest in non-obvious ways across an entire pipeline and impact multiple, sometimes hundreds, of tables.
For instance, one common cause of data downtime is freshness – i.e. when data is unusually out-of-date. Such an incident can be a result of any number of causes, including a job stuck in a queue, a time out, a partner that did not deliver its dataset timely, an error, or an accidental scheduling change that removed jobs from your DAG.
In my experience, I’ve found that most data problems can be attributed to one or more of these events:
- An unexpected change in the data feeding into the job, pipeline or system
- A change in the logic (ETL, SQL, Spark jobs, etc.) transforming the data
- An operational issue, such as runtime errors, permission issues, infrastructure failures, schedule changes, etc.
Quickly pinpointing the issue at hand requires not just the proper tooling, but a holistic approach that takes into consideration how and why each of these three sources could break.
Here’s what you do.
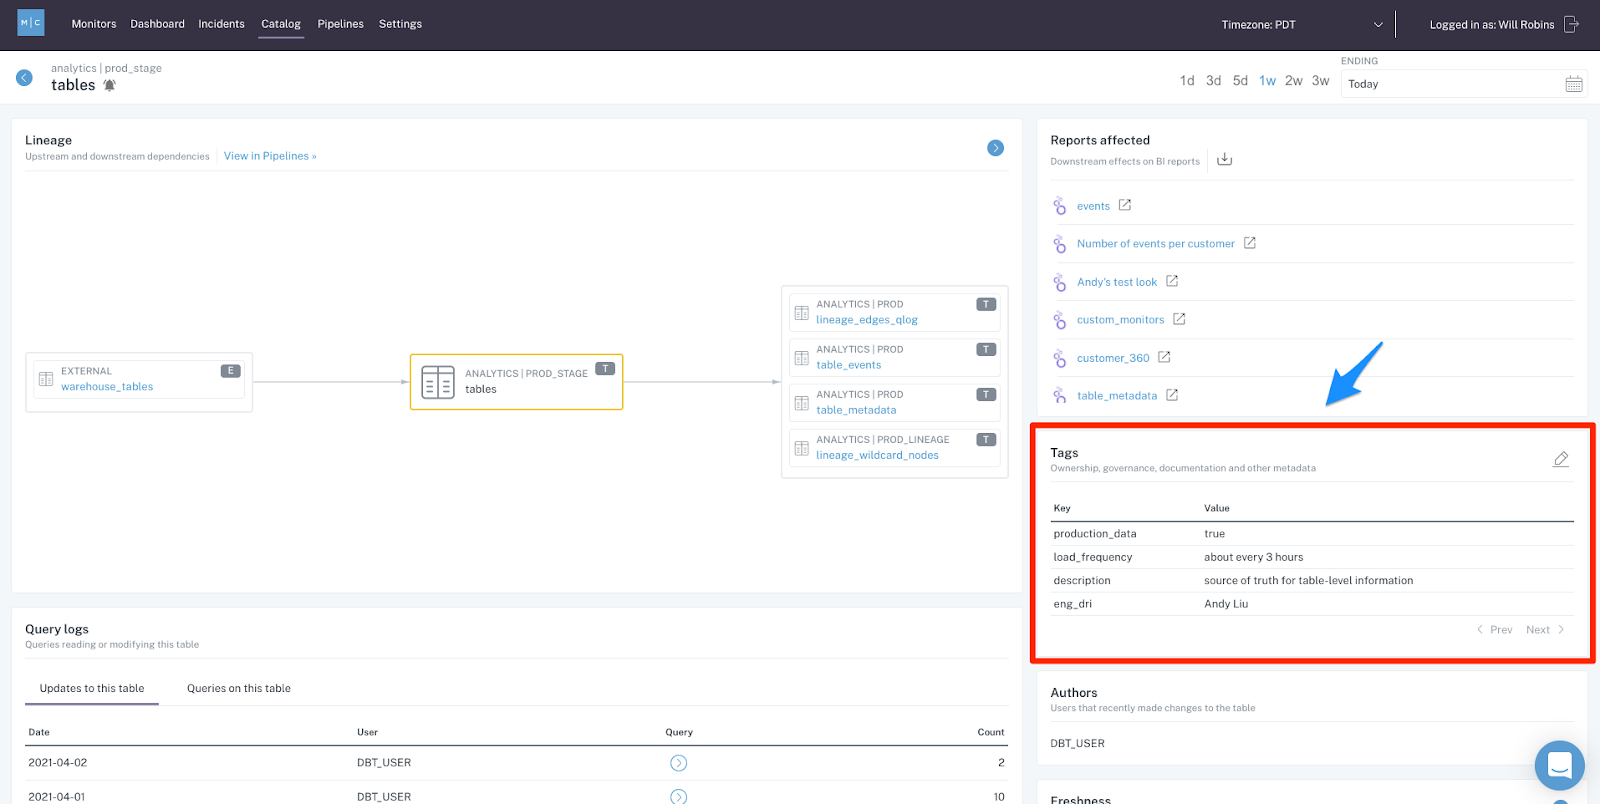
Step 1. Look at your lineage
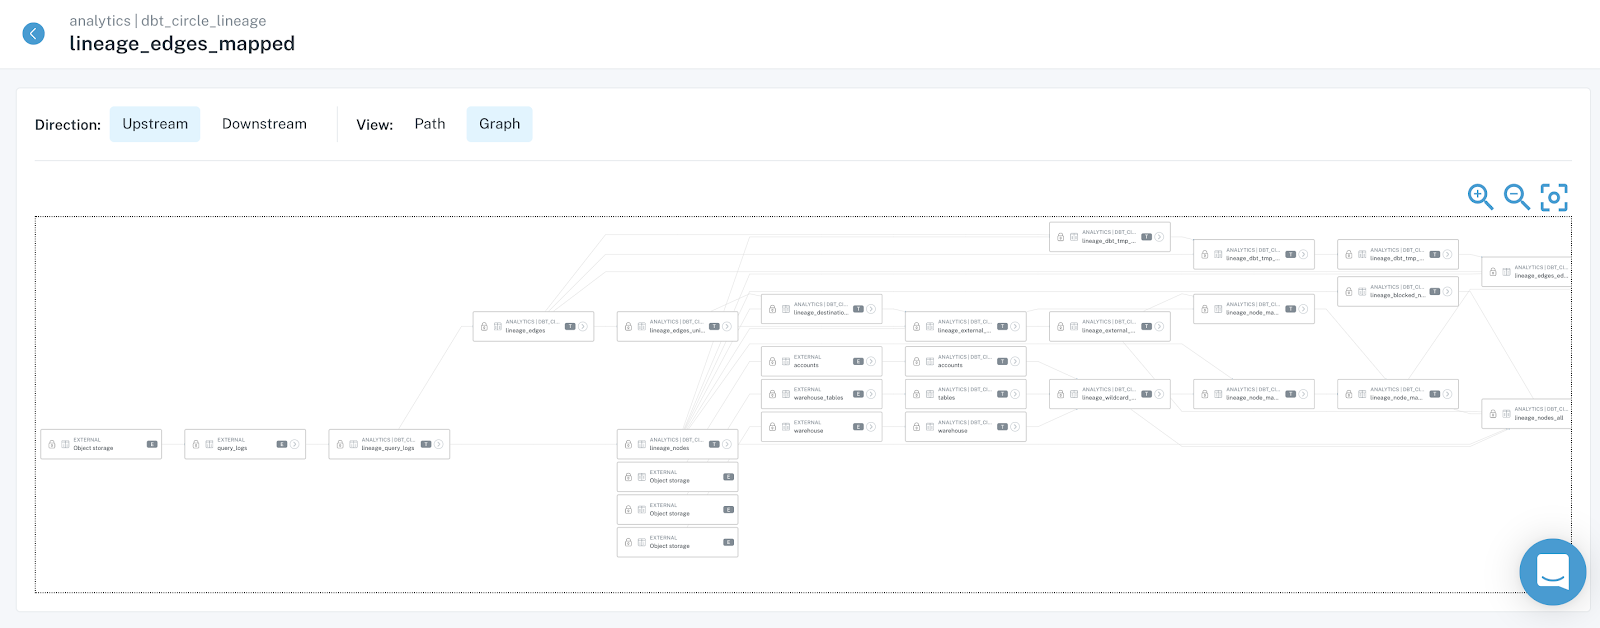
You know the customer dashboard is broken. You also know this dashboard is built on top of a long chain of transformations, feeding off of several (or maybe several dozen…) data sources.
To understand what’s broken, you will need to find the most upstream nodes of your system that exhibit the issue – that’s where things started and that’s where the answer lies… If you’re lucky, the root of all evil occurs in the dashboard in question and you will quickly identify the problem.
On a bad day, the problem happened in one of the most upstream sources of your system, many transformation steps away from the broken dashboard – which would require a long day of tracing the issue up the DAG, and then backfilling all broken data.
Takeaways. Make sure everyone (data engineers, data analysts, analytics engineers, and data scientists) troubleshooting data problems have access to the most up-to-date lineage. Your data lineage should include data products like BI reports, ML models or reverse ETL sinks to be useful. Field-level lineage is a plus.
Step 2. Look at the code
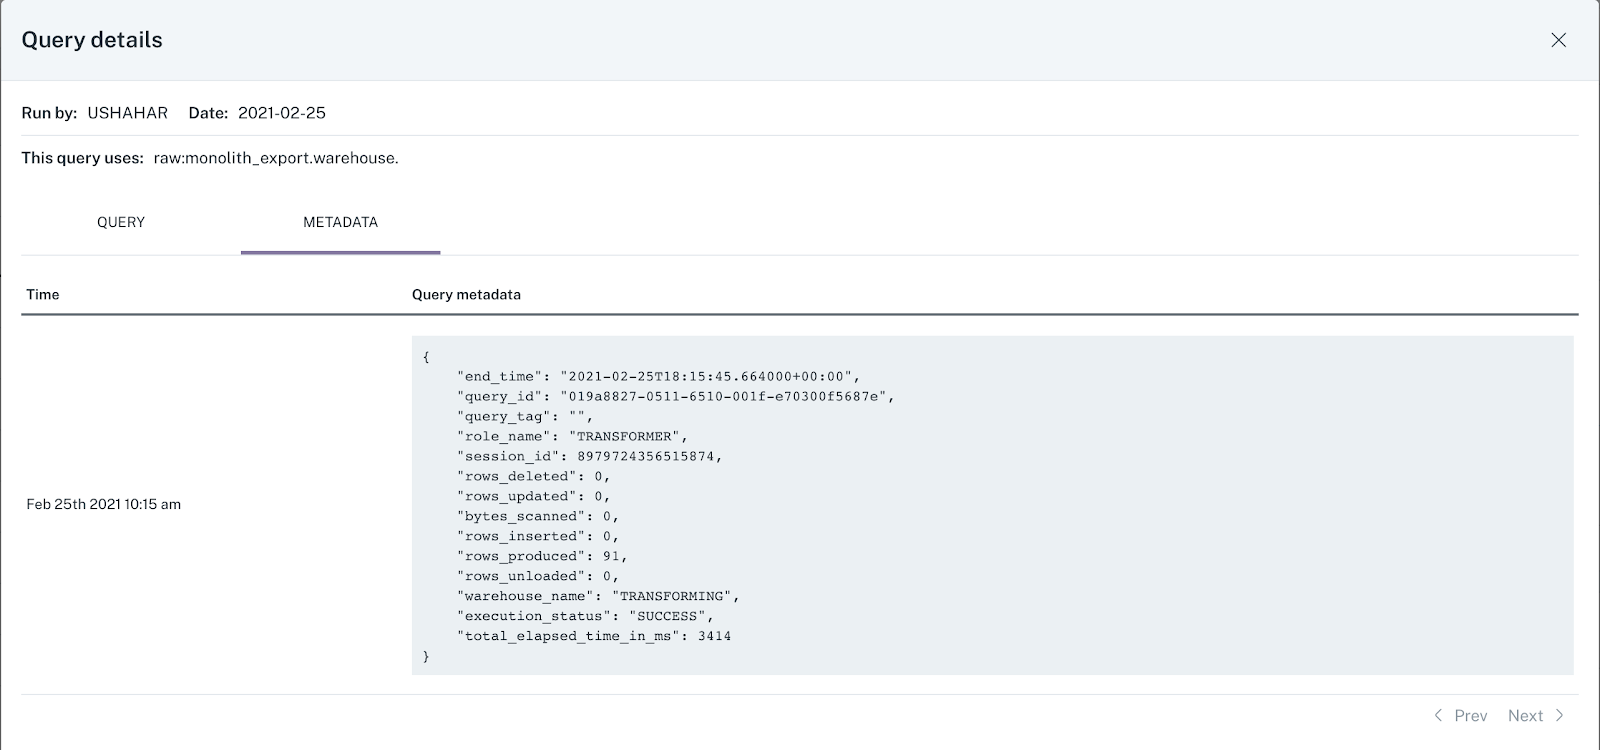
You found the most upstream table that’s experiencing the issue. Congratulations, you’re one step closer to understanding the root cause. Now, you need to understand how that particular table was generated by your ETL processes.
A peek into the logic that created the table, or even the particular field or fields that are impacting the incident, will help you come up with plausible hypotheses about what’s wrong. Ask yourself:
- What code most recently updated the table? And when?
- How are the relevant fields calculated? What could possibly have created the “wrong” data given this logic?
- Have there been any recent changes to the logic, potentially introducing an issue?
- Have there been any ad hoc writes to the table? Has it been backfilled recently?
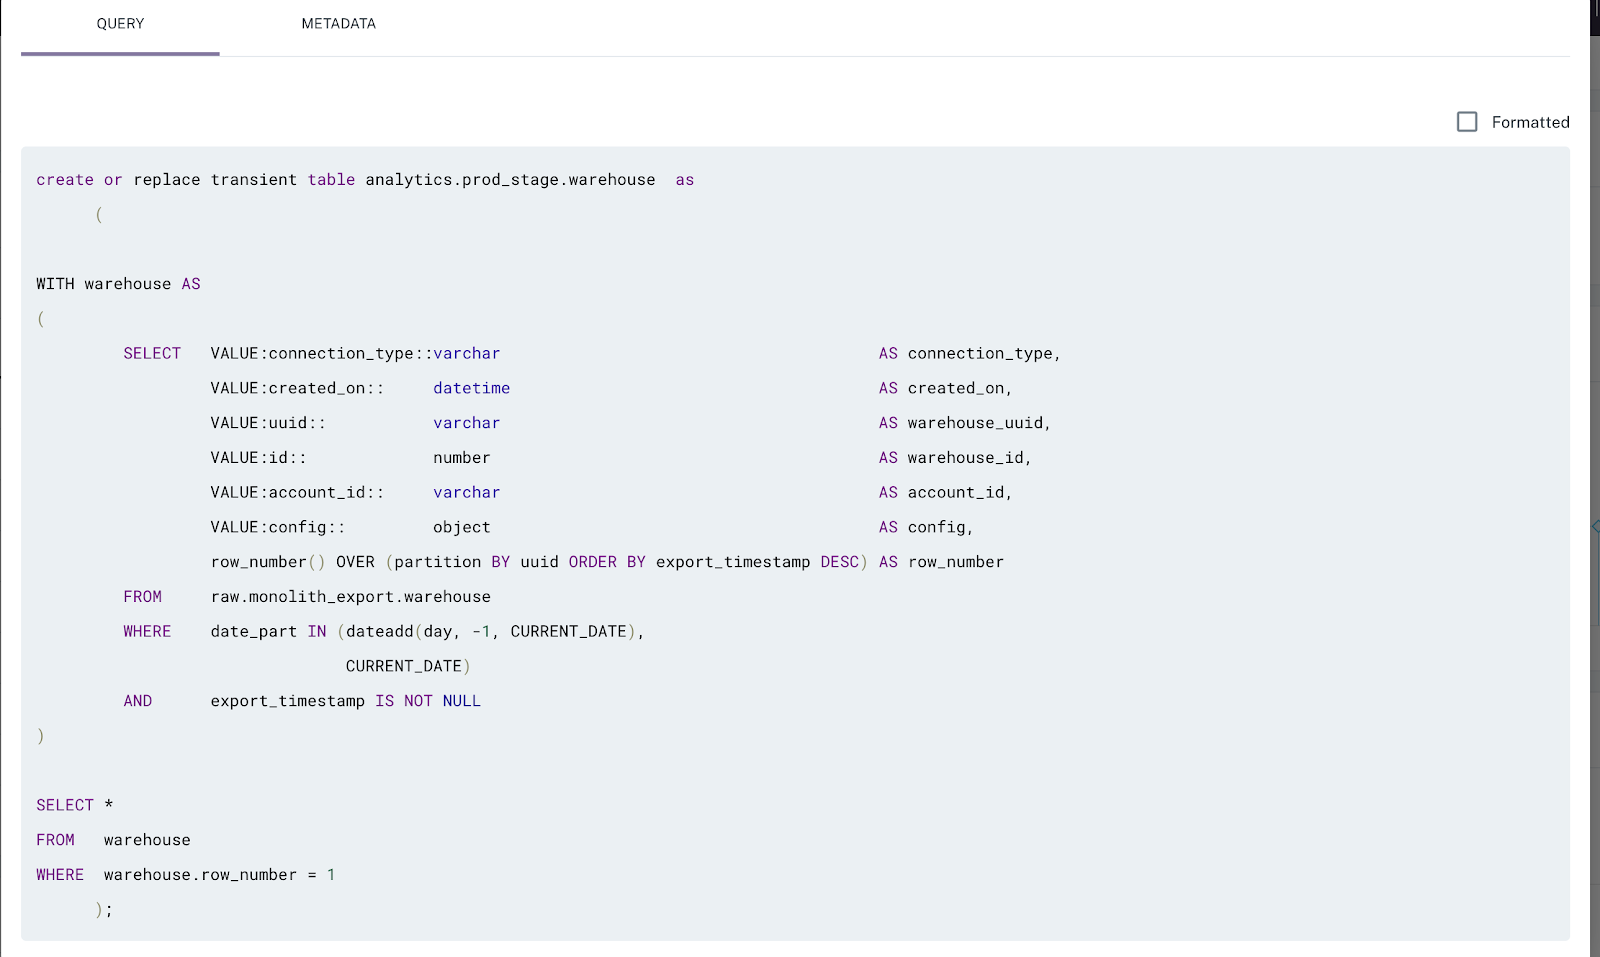
Takeaways. Make sure everyone troubleshooting data problems can quickly trace back tables to the logic (SQL, Spark, or otherwise) that created them. To get to the bottom of things, you need to know not only what the code currently looks like, but also what it looked like when the table was last updated and ideally when that happened. While we all try to avoid them, backfills and ad hoc writes should be accounted for.
Step 3. Look at your data
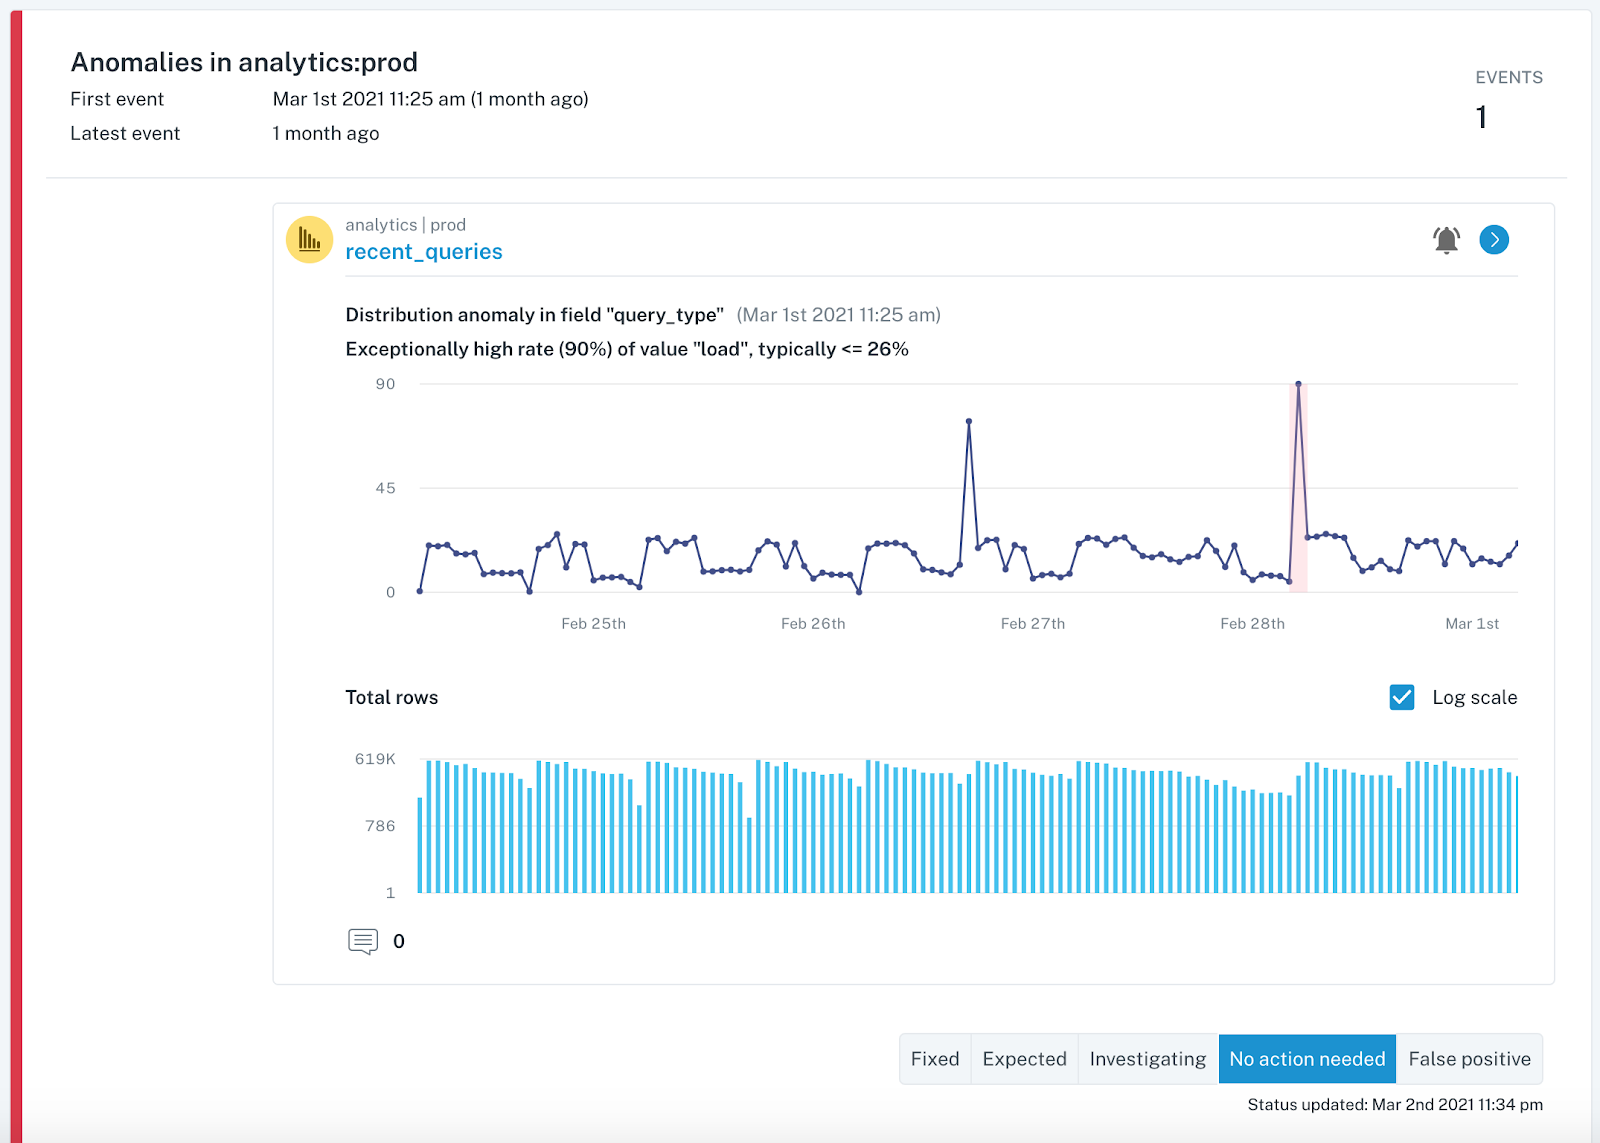
You now know how the data was calculated and how that might have contributed to the incident. If you still haven’t spotted the root cause, it’s time to look at the data in the table more closely for hints of what might be wrong.
Ask yourself:
- Is the data wrong for all records? For some records?
- Is the data wrong for a particular time period?
- Is the data wrong for a particular subset or segment of the data, e.g. only your android users or only orders from France?
- Are there new segments of the data (that your code doesn’t account for yet…) or missing segments (that your code relies on…)?
- Has the schema changed recently in a way that might explain the problem?
- Have your numbers changed from dollars to cents? Your timestamps from PST to EST?
And the list goes on.

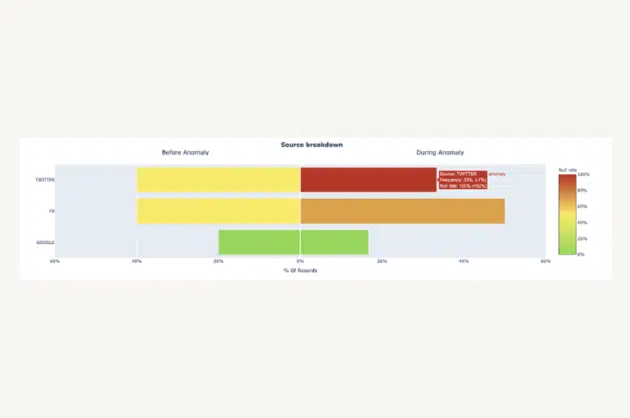
One promising approach here is to explore how other fields in a table with anomalous records may provide clues as to where the data anomaly is occurring. For example, my team recently surfaced that an important Users table for one of our customers experienced a jump in the null rate for the user_interests field. We looked at the source field (Twitter, FB, Google) to see if a relational pattern could point us in the right direction.
This type of analysis provides two key insights, both of which would explain the increase of null records, but ultimately drive very different actions.
- The proportion of records associated with source=”Twitter” increased significantly, which normally has more records where user_interests=”null” than other sources
- The proportion of records where user_interests=”null” increased for records with source=”Twitter”, while the proportion of records with source=”Twitter” did not change
For insight 1, we may just be experiencing a seasonality issue or the result of an effective marketing campaign. For insight 2, we likely have a data processing issue with user data coming from our Twitter source and can focus our investigation on the data coming from Twitter
Takeaways. Make sure everyone troubleshooting data problems can handily slice and dice data to find how the issue correlates with various segments, time periods and other cuts of the data. Visibility into recent changes to the data or its schema is a lifesaver. Keep in mind that while these statistical approaches are helpful, they are just one piece of the larger RCA process.
Step 4. Look at your operational environment
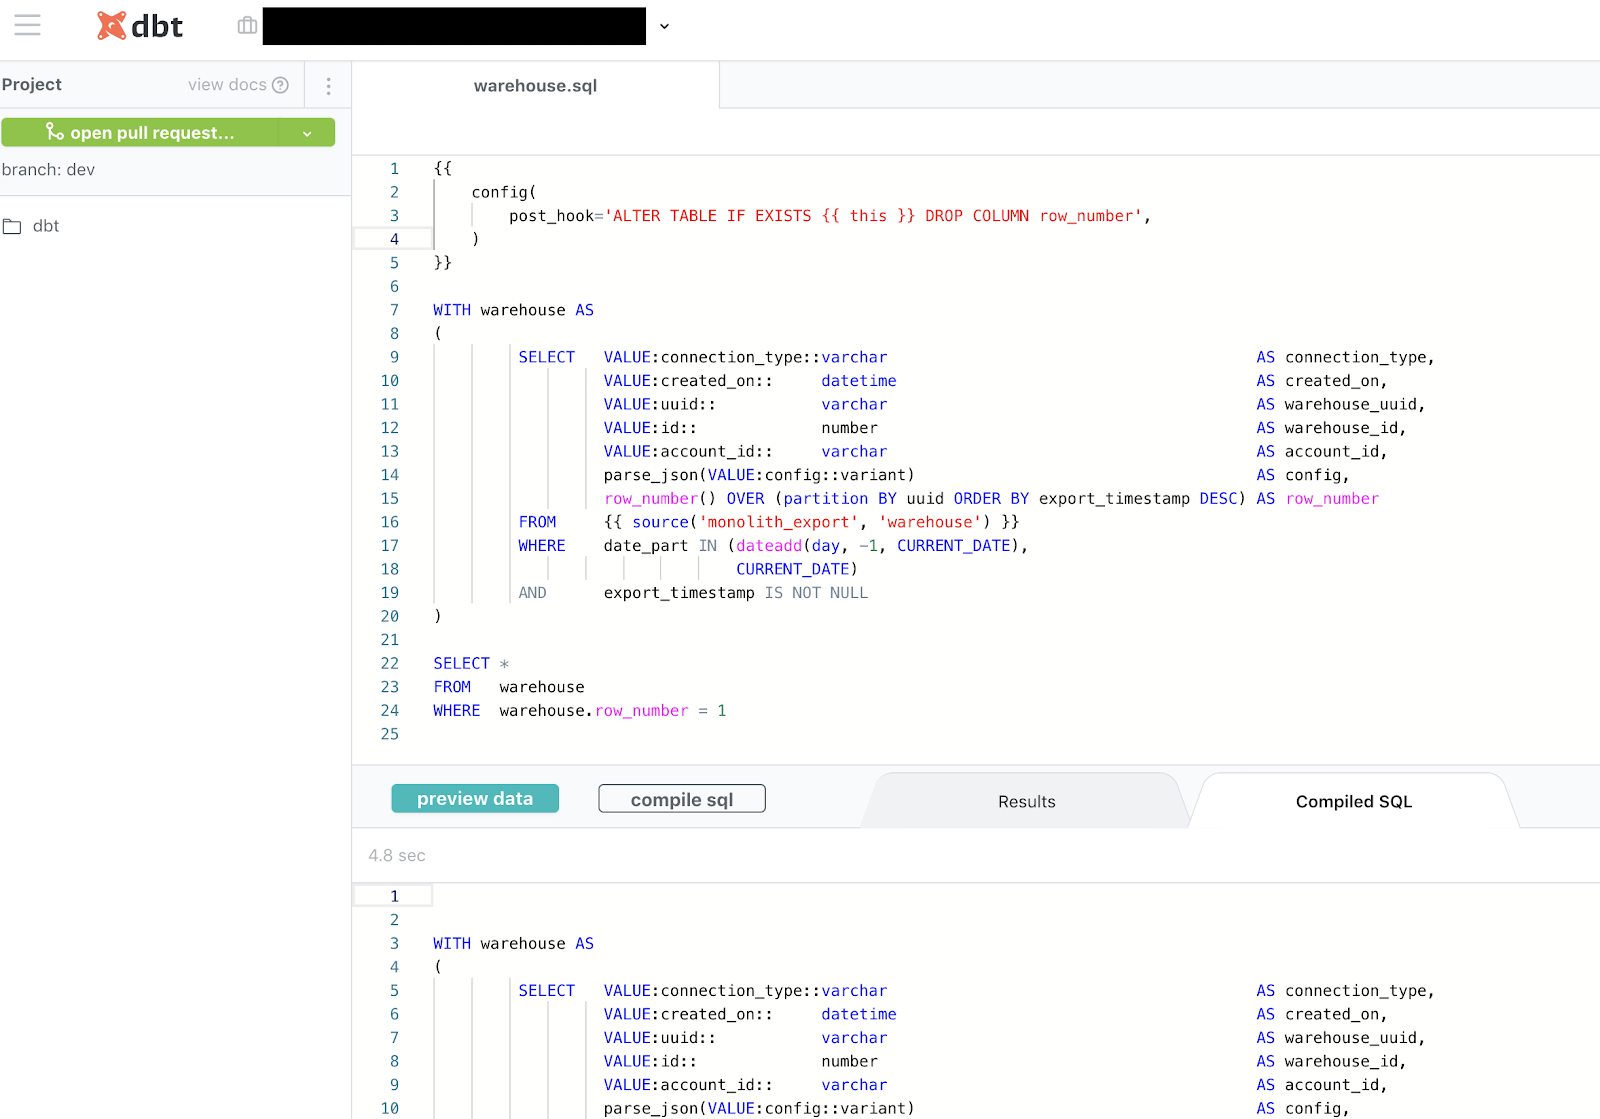
Okay, the data checks out. What now? Many data issues are a direct result of the operational environment that runs your ETL/ELT jobs.
A look at logs and error traces from your ETL engines can help answer some of the following questions:
- Have relevant jobs had any errors?
- Were there unusual delays in starting jobs?
- Have any long running queries or low performing jobs caused delays?
- Have there been any permissions, networking or infrastructure issues impacting execution? Have there been any changes made to these recently?
- Have there been any changes to the job schedule to accidentally drop a job or misplace it in the dependency tree?
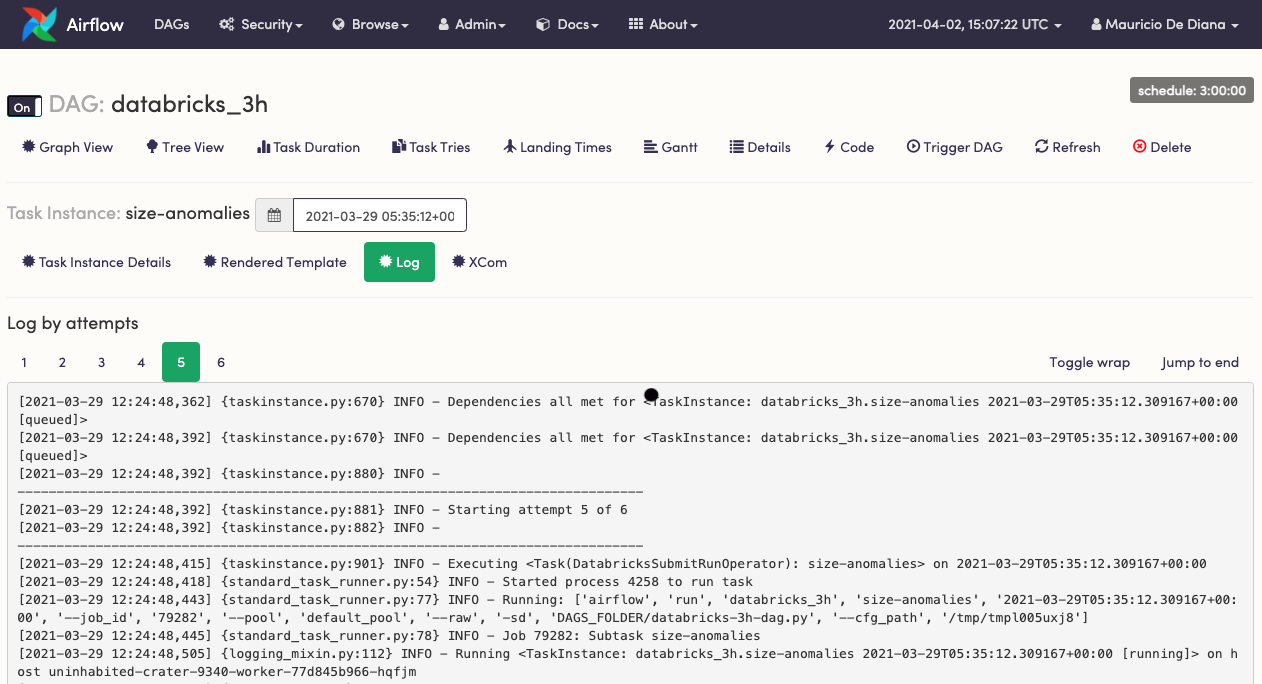
Takeaways. Make sure everyone troubleshooting data problems understands how ETL jobs are performed and have access to the relevant logs and scheduling configuration. Understanding infrastructure, security and networking can help as well.
Step 5. Leverage your peers
You did everything you can (or maybe you’re looking for shortcuts) – what’s next? You need to get guidance from your data team. Before you start bombarding Slack with questions, ask yourself:
- What similar issues have happened in the past with this dataset? What has the team done to investigate and then resolve those issues?
- Who owns the dataset that’s experiencing the issue right now? Who can I reach out to for more context?
- Who uses the dataset that’s experiencing the issue right now? Who can I reach out to for more context?
Takeaways. Make sure everyone troubleshooting data problems have access to metadata about dataset ownership and usage, so they know who to ask. A history of data incidents with helpful documentation can help as well.
Wrapping it all up
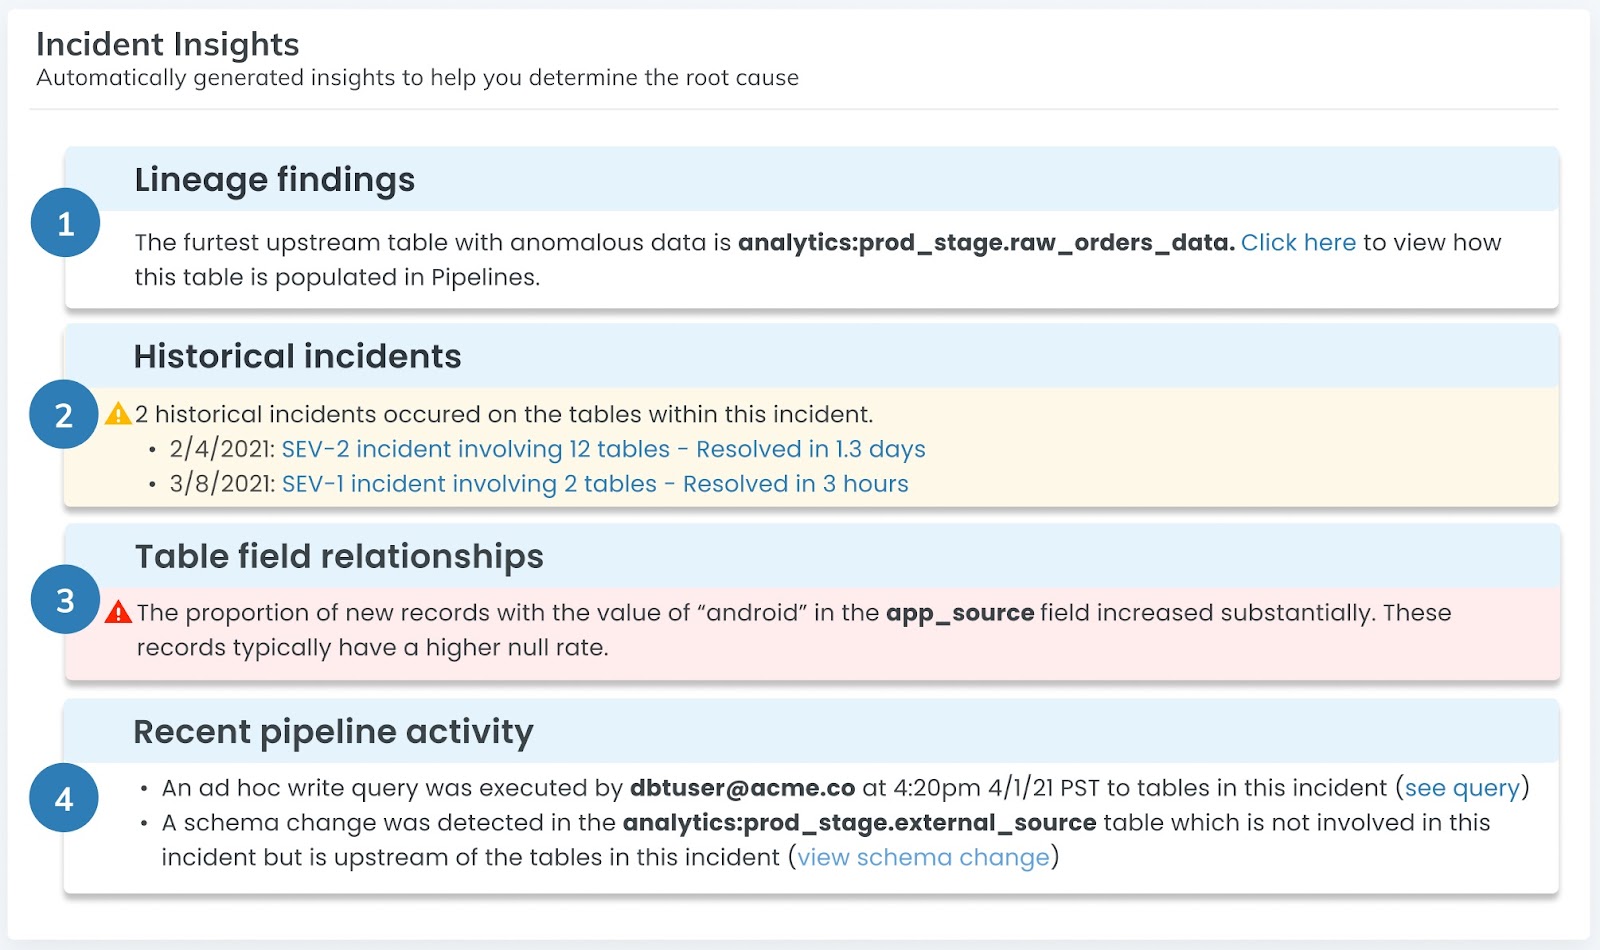
Caption: At the end of the day, your goal is to surface every insight you need to quickly complete your RCA in the least clicks possible. Approaches that automatically generate insights based on lineage, historical records, and metadata can make this process easy — and fast.
Engineering root cause analysis can be a powerful tool when it comes to addressing — and preventing — data quality issues in near-real time, but it’s important to remember a broken pipeline can rarely be traced to one specific issue. Like any distributed architecture, your data ecosystem is composed of a series of complex logic, events, and of course, pipelines that, like a science experiment, react in a multitude of ways.
That being said, we hope this framework helps you on your journey to better data quality, and as a result, more trustworthy and reliable data pipeline architecture. By leveraging this approach, you, too, can turn RCA from an stress-inducing wake-up call into a scalable and sustainable practice for your entire data organization.
And in the process, you’ll give that one data engineer (you know, the human data pipeline encyclopedia) a bit of a break…
Interested in learning more about how to conduct RCA on your data pipelines? Reach out to Francisco and book a time to speak with us using the form below.
Our promise: we will show you the product.
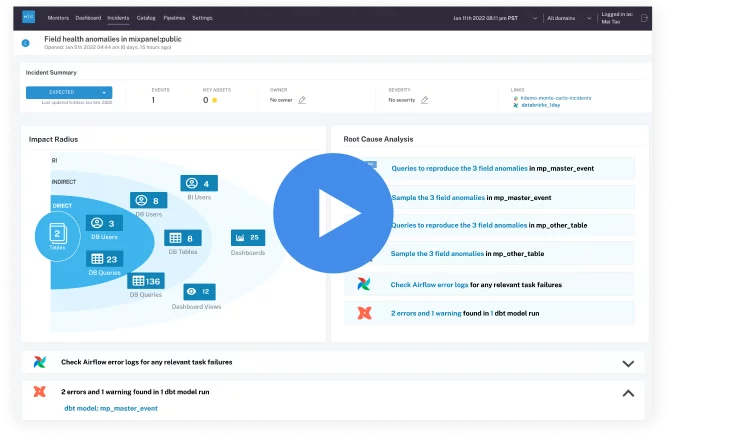 Product demo.
 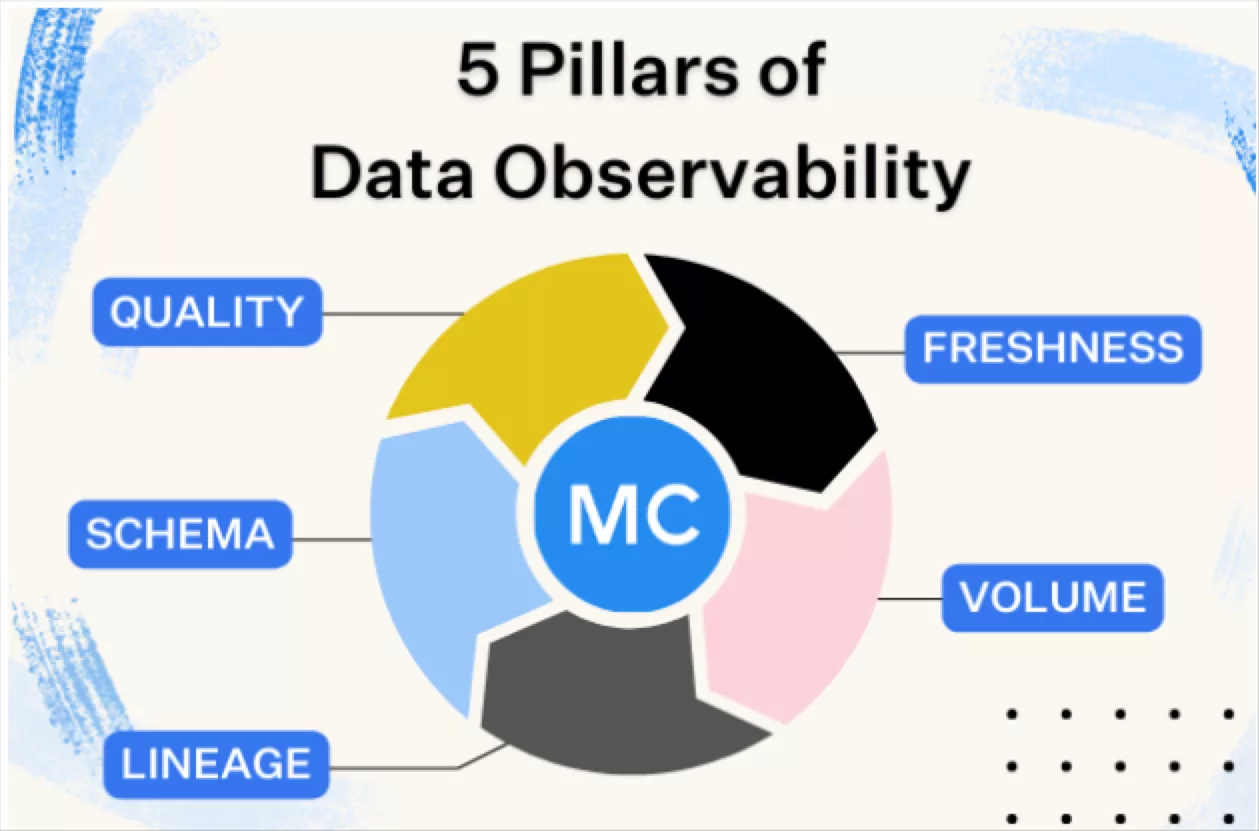 What is data observability?
  What is a data mesh--and how not to mesh it up
  The ULTIMATE Guide To Data Lineage


