Product demo.
  What is data observability?
  What is a data mesh--and how not to mesh it up
  The ULTIMATE Guide To Data Lineage
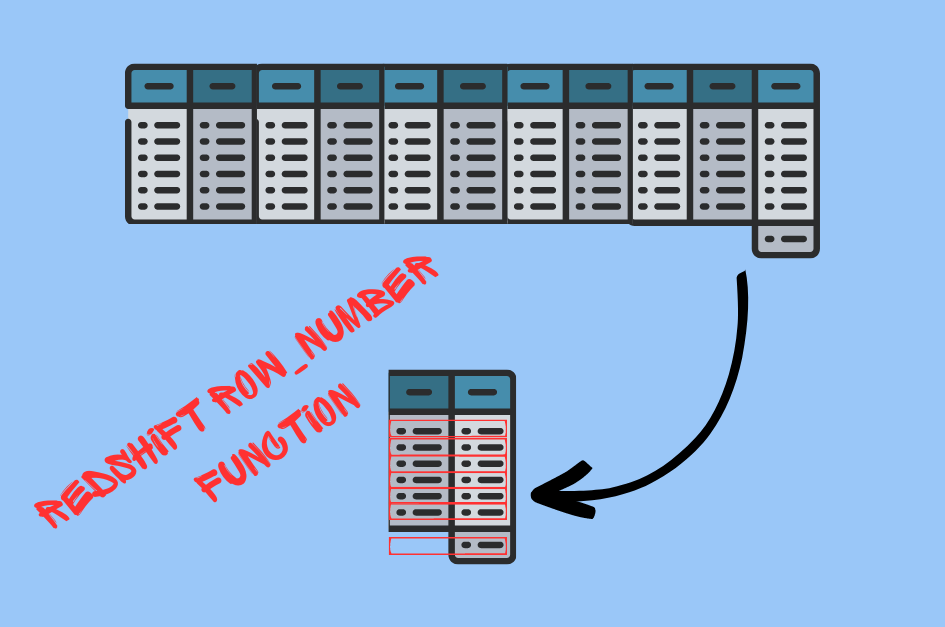
 5 Advanced Techniques with Redshift’s ROW_NUMBER

Michael Segner
Michael writes about data engineering, data quality, and data teams.
I know, I know, you’re probably thinking, “Row number? What could be so advanced about counting rows?” Ah, my dear reader, prepare to be delightfully surprised.
This little function, this humble numerical assigner, is about to become your best friend, your secret weapon, your go-to tool in the vast toolbox of Redshift. This is no mere counter of rows. Nay, it is a veritable Swiss Army knife, ready to slice through your data manipulation tasks with the precision of a sushi chef’s blade.
You’re going to learn five advanced techniques that will elevate your usage of ROW_NUMBER from mere ‘row enumerator’ to ‘master data manipulator.’ By the end, you won’t just be counting rows – you’ll be making them count!
First, what is ROW_NUMBER?
At its core, ROW_NUMBER is a window function. A ‘window’ is a set of rows that the function operates on. This ‘window’ can be the entire table, or it can be divided into smaller subsets, or ‘partitions,’ based on certain column values.
So, what does ROW_NUMBER do? As the name implies, it assigns a unique row number to each row in the window. It starts counting from 1, and the order of the counting is determined by the ORDER BY clause in the OVER clause of the function. If you want to count rows in the entire table, you can just use ORDER BY. If you want to count rows within specific partitions, you can use PARTITION BY along with ORDER BY.
But here’s where it gets interesting. If there are rows with equal values for the ORDER BY expression, Redshift doesn’t toss a coin or consult a magic 8 ball to assign row numbers. No, it goes ‘nondeterministic.’ That means it could assign any row number to those rows, and it might not be the same every time you run the query.
So, to sum up, ROW_NUMBER is like the director of a play, assigning each row a unique part to play in the grand drama of data analysis. But unlike a director, it doesn’t have favorites – it treats each row equally, unless you tell it otherwise with the ORDER BY clause. And that’s the beauty of ROW_NUMBER – it gives you the power to stage your data analysis performance exactly how you want it.
Technique 1: Handling duplicate rows
Duplicates in your dataset can lead to inaccurate results in your analysis. One way to identify duplicates is by using ROW_NUMBER.
For instance, let’s assume we have a ‘sales’ table and we want to identify duplicate rows based on ‘salesid’ and ‘sellerid’. Here’s a query that would do that:
WITH numbered_rows AS (
  SELECT salesid, sellerid, qty,
  ROW_NUMBER() OVER (PARTITION BY salesid, sellerid ORDER BY salesid) AS row_num
  FROM sales
)
SELECT * FROM numbered_rows WHERE row_num > 1;
This query partitions data by ‘salesid’ and ‘sellerid’, and assigns a row number to each row within the partition. Duplicate rows will have row numbers greater than 1, which we filter for in the final SELECT statement.
Technique 2: Row sampling for large datasets
Sampling is often used on large datasets to create smaller, more manageable subsets for preliminary analysis. With ROW_NUMBER, we can create a uniform random sample of rows.
SELECT * FROM (
  SELECT *, ROW_NUMBER() OVER (ORDER BY RANDOM()) AS row_num
  FROM sales
) WHERE MOD(row_num, 10) = 0;
This query assigns a random row number to each row in the ‘sales’ table and then selects every 10th row to create a 10% sample.
Technique 3: Top-N queries per group
You can use ROW_NUMBER to retrieve the top N rows per group. For example, if you want to find the top 3 selling products in each category from a ‘products’ table, you could use a query like this:
SELECT category, product, sales
FROM (
  SELECT category, product, sales,
  ROW_NUMBER() OVER (PARTITION BY category ORDER BY sales DESC) AS row_num
  FROM products
) WHERE row_num <= 3;
This partitions data by 'category' and orders it by 'sales' in descending order. It then selects the top 3 rows from each partition.
Technique 4: Data pagination
Pagination is a common requirement, especially when building APIs or web apps. ROW_NUMBER can be used to fetch a specific "page" of results.
SELECT * FROM (
  SELECT *, ROW_NUMBER() OVER (ORDER BY salesid) AS row_num
  FROM sales
) WHERE row_num BETWEEN 21 AND 40;
This query fetches the second page of results (rows 21-40) when the results are ordered by 'salesid'.
Technique 5: Calculating percentiles
Percentiles are often used in analytics to understand the distribution of data. You can use ROW_NUMBER, COUNT, and some basic arithmetic to calculate percentiles.
WITH ordered_rows AS (
  SELECT sales, ROW_NUMBER() OVER (ORDER BY sales) as row_num
  FROM sales
), total_rows AS (
  SELECT COUNT(*) as total_count FROM sales
)
SELECT sales,
100.0 * row_num / total_count AS percentile
FROM ordered_rows, total_rows
ORDER BY sales;
This query first assigns a row number to each row ordered by 'sales'. It then divides each row number by the total number of rows to calculate the percentile.
Performance considerations
Now, while our friend ROW_NUMBER has many talents, it's not exactly a lightweight when it comes to computational resources. It's a bit like a sumo wrestler – immensely powerful, but a tad heavy on the scales.
Therefore, it's best to use it on a filtered subset of your data, especially when working with large tables.
If you're using ROW_NUMBER with ORDER BY, consider indexing the columns you're ordering by to speed up the sort operation.
Additionally, when using PARTITION BY, remember that each partition generates its own set of row numbers, and large numbers of partitions may increase query execution times.
Lastly, be mindful of your disk space, as the ROW_NUMBER function can produce large intermediate result sets, especially when used on large tables or multiple partitions.
Take the helm
With the advanced ROW_NUMBER techniques learned here, you’ll be wielding this function with the flair of a sushi chef’s knife skills in no time, slicing through data manipulation tasks with ease and precision.
But remember, even the finest sushi chef is mindful of his tools and ingredients. A sushi knife may be incredibly precise and efficient, but it requires a steady hand and keen awareness. Overuse it, or use it without considering the performance implications, and you could end up with a messier kitchen than you started with.
And just as a sushi chef relies on more than just his knife, you must rely on more than just individual functions like ROW_NUMBER. To truly understand the story of your data, you need to observe it - to see its patterns, understand its quirks, and anticipate its trends. That's where a data observability tool like Monte Carlo comes in.
Monte Carlo enables you to monitor your data in real-time, understand its lineage, and spot any issues or anomalies that could affect your final dish - or in your case, the final analysis.
Now, my fellow data chefs, the kitchen is yours.
Want to learn more about data observability? Schedule a time to talk with us and see a demo using the form below.
Our promise: we will show you the product.
Read more posts.