Product demo.
  What is data observability?
  What is a data mesh--and how not to mesh it up
  The ULTIMATE Guide To Data Lineage
 11 PySpark Data Quality Checks to Keep Your Data Sparkling Clean


Tim Osborn
Tim is a content creator at Monte Carlo who writes about data quality, technology, and snacks—occasionally in that order.
Has your data been looking a little grimy lately? Data quality issues marring its once lustrous shine?
Well, before you throw out that dirty dataset, why not try to assess and improve its quality with PySpark data quality checks?
PySpark is the Python API used for Apache Spark, but you don’t need to have your data stored in Spark to use PySpark data quality checks.
The beauty of PySpark is its ability to read large datasets from a variety of sources, process it in-memory, and save the results back or elsewhere—and that includes running large-scale data quality checks against your datasets.
If you’re working in SQL, then say goodbye to data grime with these 11 PySpark data quality checks to add to your existing data quality program.
Table of Contents
But first, let’s take a look at how to set up PySpark for your data platform.
How to set up PySpark
If you haven’t installed PySpark already, you’ll need to do that first. In terminal, run this command:
!pip install pysparkNext, open up your Python IDE, start a new project, and write this code to start a SparkSession, which is the very first object you create to manipulate data with Spark:
from pyspark.sql import SparkSession

spark = SparkSession.builder \
    .appName("Data Quality Check") \
    .getOrCreate()
Now, for simplicity, let’s assume you have a CSV file. In that case, to load the data, you would write this code:
df = spark.read.csv('your_data_file.csv', header=True, inferSchema=True)To make sure your data is loaded correctly, you can also run a quick test to get a summary of basic data stats using the line:
df.describe().show()Now, on to the PySpark data quality checks!
1. Check for duplicates
Duplicate data causing volume issues in your pipelines? Discover duplicate data with these two lines of code:
duplicate_rows = df.count() - df.dropDuplicates().count()
print(f"Number of duplicate rows: {duplicate_rows}")
If you want to drop rows that have the same values across all columns, you can use the dropDuplicates() method without any arguments:
df.dropDuplicates()Depending on your needs, you might also want to explore additional configurations, such as handling duplicates within a window of time or using hashing for more efficient deduplication within larger datasets.
2. Check for unique values in columns
If you’re dealing with duplicate data in categorical columns, you might opt to use a unique values test instead. Here’s how you would do that in your columns using a PySpark data quality check:
for column in df.columns:
    print(f"{column}: {df.select(column).distinct().count()} distinct values")
3. Check for missing values
Null values—they affect us all. The code below will allow you to count the number of missing or null values in each column.
from pyspark.sql.functions import col, sum

df.select(*(sum(col(c).isNull().cast("int")).alias(c) for c in df.columns)).show()
4. Categorical value distributions
For categorical columns, you can also count the occurrences of each category.
df.groupBy("your_categorical_column").count().show()5. Find outliers
Using the approxQuantile method, you can identify potential outliers in your data.
quantiles = df.approxQuantile("your_numeric_column", [0.01, 0.99], 0.0)
lower_bound = quantiles[0]
upper_bound = quantiles[1]

outliers = df.filter((df["your_numeric_column"] < lower_bound) | (df["your_numeric_column"] > upper_bound))
outliers.show()
6. Schema validation
Want to ensure that the dataframe schema is as expected? Here’s what that looks like with a PySpark data quality check:
expected_schema = ["col1", "col2", "col3"]
if not all(col in df.columns for col in expected_schema):
    print("Schema mismatch!")
7. Correlations
For numeric columns, understanding how columns correlate can be helpful to understanding how to leverage your datasets effectively.
from pyspark.sql.functions import corr

df.select(corr("numeric_column1", "numeric_column2")).show()
8. Temporal consistency check
This check ensures that timestamps are consistent and sequential. It’s particularly relevant for time series data.
from pyspark.sql import functions as F

# Assuming df has a column 'timestamp' sorted in ascending order

df = df.withColumn("next_timestamp", F.lead("timestamp").over(Window.orderBy("timestamp")))

anomalies = df.filter(df.timestamp > df.next_timestamp)
If anomalies has any rows, it indicates that the timestamps aren’t sequential.
9. Cross-field validation
Ensuring values in one column are consistent with values in another is critical to validating the quality of your data for a given pipeline. Here’s an example of how you could perform a simple cross-field validation for age and date of birth consistency using PySpark:
# Assuming df has columns 'dob' as DateType and 'age' as IntegerType
df = df.withColumn("calculated_age", F.floor((F.current_date() - df.dob) / 365.25))
inconsistencies = df.filter(df.age != df.calculated_age)
inconsistencies will have rows where the age column doesn’t match the age calculated from dob.
10. Dependency check
This check ensures that if one column has a value, another related column shouldn’t be null.
# Assuming df has columns 'purchase_date' and 'purchase_amount'
missing_values = df.filter(df.purchase_date.isNotNull() & df.purchase_amount.isNull())
If missing_values has rows, it indicates records with a purchase date but no associated purchase amount.
11. Text pattern analysis
If you’re dealing with text data, you can use regular expressions to identify patterns and anomalies in fields like email addresses, URLs, and other free-text inputs.
Here’s an example of how you could use PySpark data quality checks to identify patterns and anomalies in email addresses using regular expressions:
# Assuming df has a column 'email'
email_pattern = "^[a-zA-Z0-9_.+-]+@[a-zA-Z0-9-]+\.[a-zA-Z0-9-.]+$"
invalid_emails = df.filter(~F.col("email").rlike(email_pattern))
invalid_emails will have rows where the email address does not match the typical pattern of valid email addresses.
The limitations of PySpark data quality checks
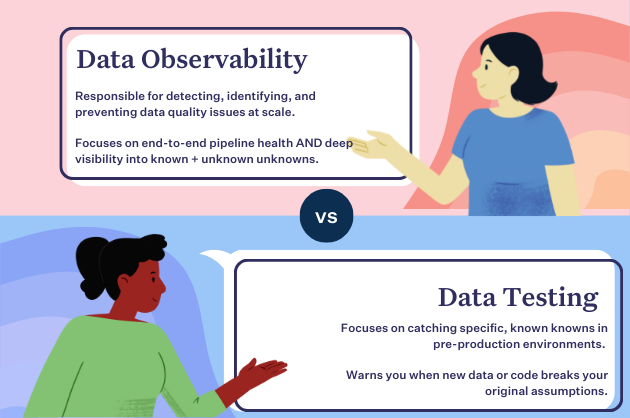
While PySpark data quality checks are no doubt helpful tools to have in your data quality tool belt, it’s also important to recognize the limitations of traditional data quality testing.
Like most traditional data quality tests, PySpark excels at helping data teams with minimal scale detect and resolve predictable data quality issues. The challenge comes when your scale isn’t minimal or your data quality issues aren’t predictable—and the worst one’s rarely are.
When that day inevitably comes, you need an end-to-end data observability solution that utilizes ML and out-of-the-box monitors to scale data quality for both your known and unknown issues.
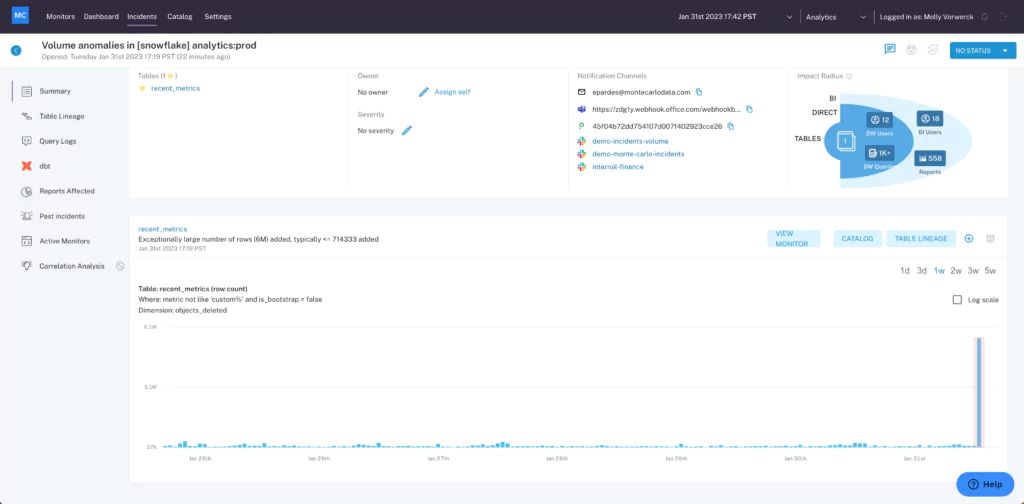
Data observability tools like Monte Carlo employ automated monitoring, root cause analysis, data lineage, and data health insights to proactively detect, resolve, and prevent data quality issues. So whether you’ve got 50 tables or 50,000, you’ll always have the data quality coverage you need, when and where you need it.
Ready to shift from a reactive approach to a proactive one? Talk to us by scheduling a time using the form below!
Our promise: we will show you the product.
Read more posts.