Product demo.
  What is data observability?
  What is a data mesh--and how not to mesh it up
  The ULTIMATE Guide To Data Lineage
 How Tenable Executes DataOps with Monte Carlo and Snowflake

Tom Milner
Tom is the Director of Engineering at Tenable and a Monte Carlo Reliability Pioneer.
In this article:
Unlocking the power of data for improved cyber security
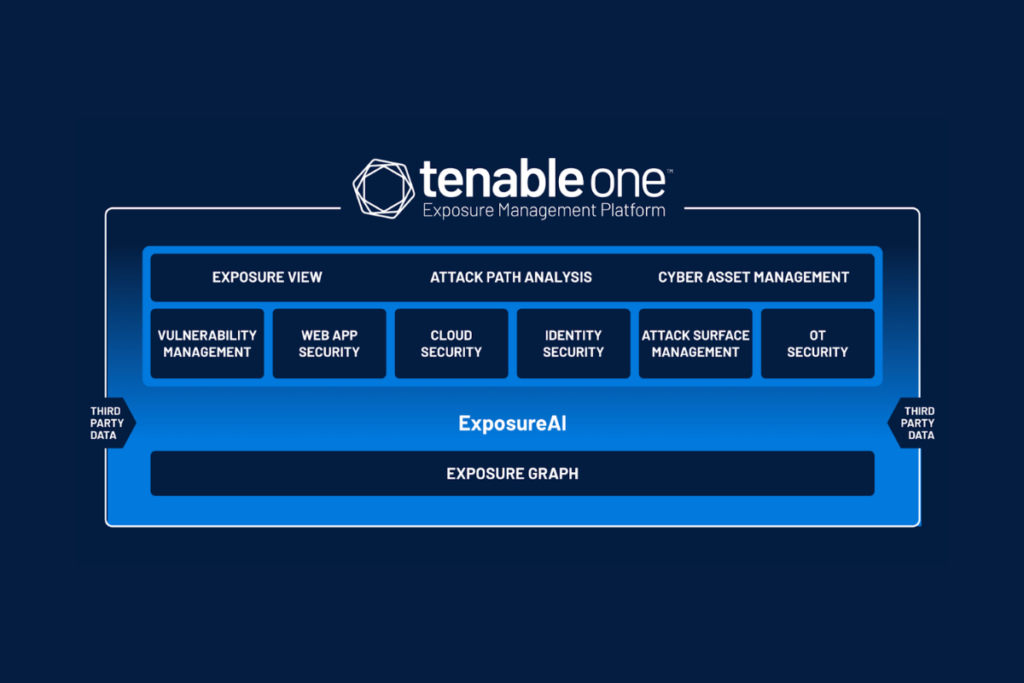
The Tenable One Exposure Management Platform allows organizations to gain a comprehensive view of their attack surface and vulnerabilities to prevent likely attacks and accurately communicate cyber risk.
It is driven by a data platform that uses data from all of Tenable’s vulnerability management, cloud security, identity exposure, web app scanning, and external attack surface management point products to provide cybersecurity leaders a comprehensive and contextual view of their attack surface.
Data quality and freshness is a must for our customers and we knew we needed a solution that could help monitor and track the quality of the data being used directly by our customers to manage their exposure. To read more about how we built this data platform on Snowflake, check out Tenable One Exposure Management Platform: Unlocking the Power of Data.
Monte Carlo is best known as a data observability platform, working to solve the issue of detecting, resolving, and preventing data quality issues. In practical terms, Monte Carlo integrates across your data systems and monitors the data coming into the tables in your database to alert you when something is out of the ordinary.
For example, if data stops coming into a table at the normal rate of frequency, Monte Carlo would send out an alert informing the table owners. If you have ever been in the situation where all your data jobs are running fine with no alerts but no data is getting into your table due to a problem upstream, Monte Carlo could be helpful. It monitors the state of the data, not just the pipelines.
The data engineering team in Tenable has been using Monte Carlo to help monitor the Snowflake data platform powering Tenable One Exposure Management and it has proven extremely valuable. The out of the box functionality has given us a very high level of confidence in the freshness and quality of the data.
This confidence feeds into our development cycle by acting as a safety net for production deployments. By monitoring the state of the data and not just their pipelines, our engineers can be more confident that any potential mistakes made will be highlighted quickly. As confidence has grown in the Tenable One data platform, more internal teams are looking to move or build new applications onto it.
In this post, we outline how we have used Monte Carlo’s custom monitors to build even more confidence in our data platform. Specifically,how we use these monitors to alert on query/task performance.
Custom monitors for operational checks
In addition to the automated monitoring that Monte Carlo provides, there is also the option to implement custom monitors. Custom monitors run any SQL query and evaluate the output of the query against a specified threshold.
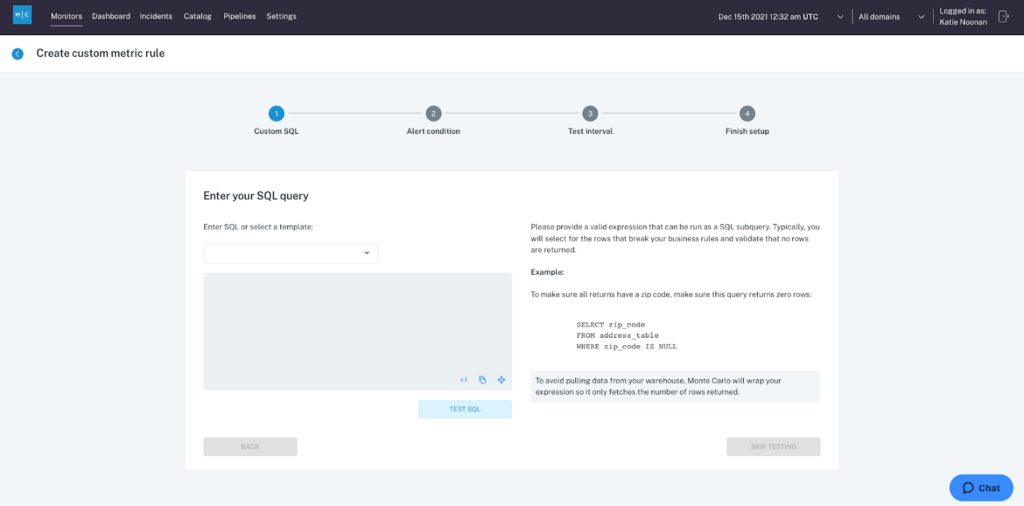
For monitoring database systems in production, there are a certain number of operational checks you may want to run against your database. These include:
- Display as code
- Failed queries
- Long running tasks
- Long running queries
Implementing these monitors has proven just as valuable as the automated monitors in some cases. Tracking for failed tasks and queries allows Tenable to not only monitor our pipelines, but also for application and user errors.
If a platform application has incorrect access or is having a generated query that fails, these monitors help keep our data engineering team informed and proactive in helping users of the platform.
The long running tasks and queries alerts are a good way to track inefficient and delayed processes. This is important because while the query and logic may succeed it could consume excess resources and costs by taking a longer time than necessary to execute.
If cost optimization is important to your organization, then these two custom monitor types can really highlight expensive processes before they spiral out of control. Tenable are early users of Monte Carlo’s Performance Dashboard and it complements our long running custom monitors to help engineers in the team to prioritize problem queries and solutions.
Monitors as Code
The Tenable One platform is a global application, powered by several globally distributed Snowflake accounts. Monte Carlo connects to each account as a separate integration and the team did not wish to have to set up a different custom monitor manually within the UI. In addition, it is important for Tenable to commit their monitors to source control and gain the ability to version control any changes.
Monte Carlo was able to support our requirements with their Monitors as Code feature. This feature wraps up our custom monitor configuration in a YAML file that can be deployed with the montecarlodata CLI.
Our current development flow is to:
- Save your code into GitHub. If you’re following a PR process, this is where you ask your team for feedback and/or to approve PR.
- Once you merge your PR, the integration with Jenkins picks up the changes.
- Jenkins then deploys the YAML file creating and/or updating monitors in your Monte Carlo account.
Get started with these examples
Here are some example yaml files that you could use to get started. We monitor them on an hourly schedule, but you could lengthen or shorten this time. The more often you run, the higher your Snowflake costs will be and one hour has been sufficient for our purposes.
The main logic is in the embedded SQL statement in each file. Therefore if you need to tailor these to your needs to filter out certain errors or user queries, that is easily achieved.
- Failed processes / tasks
- Failed queries
- Long running tasks
- Long running queries
These monitors are integrated into our on-call process with PagerDuty so that if a recurring issue needs to be examined, the engineer on-call will be informed.
Monitoring applications with Monte Carlo and Snowflake
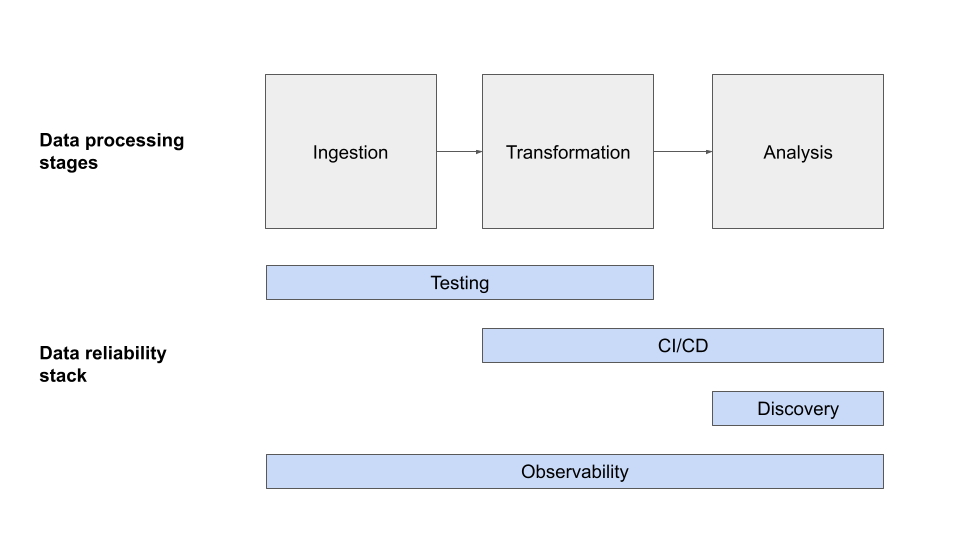
The Tenable product is essentially one big data pipeline. Customers send us their data in a standard format and it is then transformed, enriched and metricized into the insights that customers require.
The pipeline is long with various stages and branches, each controlled by separate microservices. A microservice architecture brings all the benefits of minimizing blast radii and faster CI/CD pipelines to production, but it can be hard to monitor.
The Monte Carlo custom monitors on top of Snowflake pattern drew a lot of interest from other teams in Tenable and we soon had requests to implement an end-to-end view of the Tenable data pipeline.
Essentially, the idea was to use Monte Carlo in a similar way as teams might use an application management performance tool. The advantage here would be the SQL based custom monitors providing increased flexibility and control while being more performative.
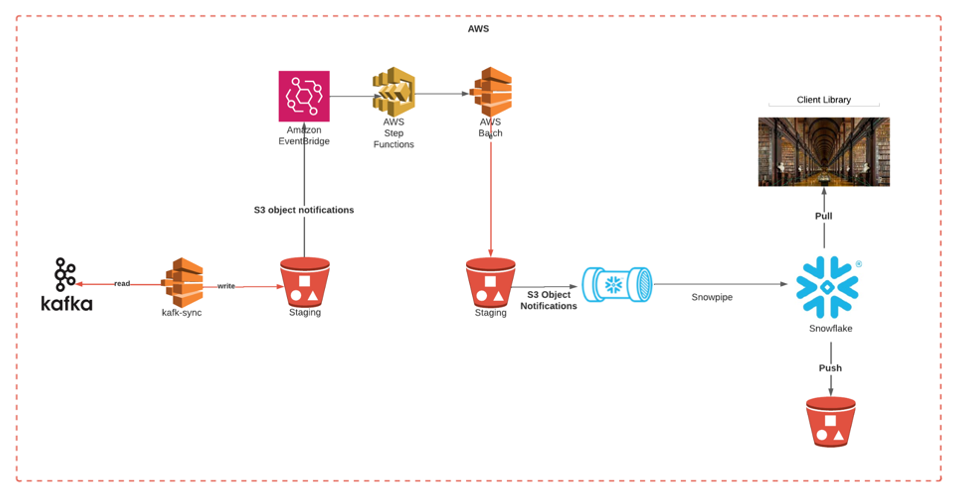
Luckily the pipeline is well instrumented with start and end times of each stage saved to a central Kafka topic. Our custom Kafka to Snowflake service which we describe in the Delivering Comprehensive Cybersecurity Insights with Tenable One Data Platform on AWS blog post makes it extremely quick to add new Kafka topics to Snowflake.
Snowflake enables the ingestion of large volumes of data with latency of seconds at a storage cost comparable to parquet format on S3. Once the data has been ingested and modeled, it is extremely easy to run any SQL query you wish against it via a Monte Carlo custom monitor. Our custom monitor alerts when average throughput time goes above a certain threshold. Once this threshold is breached, an alert is sent to a specific Slack channel and PagerDuty.
The team responsible for the pipeline can then access the data in Snowflake to investigate and remedy the issue. The historical data is also accessible in the same table for deeper analysis across an unlimited timeframe if needed.
The combination of our Kafka to Snowflake service and Snowflake with Monte Carlo custom monitors has made the cost of experimentation extremely low. As it was an internal use case we could react quickly to immediate feedback from our internal customers to build a solution that worked for them.
Through the implementation of this custom monitor and other associated actions, the average throughput of data in the pipeline has reduced by 33% within the first 3 months. This is a great win for our customers and also engineers with reduced data latency and greater stability.
Interested in how you can use Monte Carlo to improve your data quality and overall performance? Schedule a time using the form below!
Our promise: we will show you the product.
Read more posts.