Product demo.
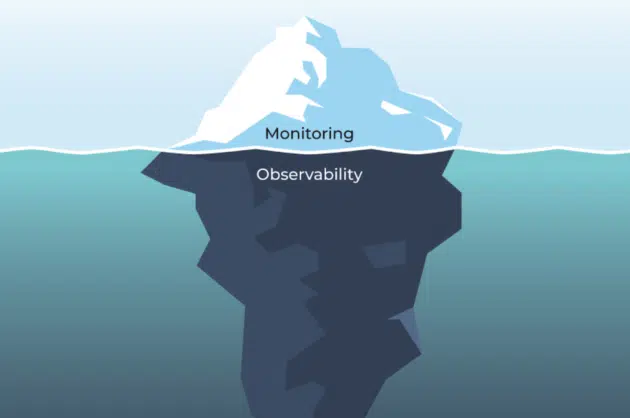
  What is data observability?
  What is a data mesh--and how not to mesh it up
  The ULTIMATE Guide To Data Lineage
 Monte Carlo’s New Fivetran Integration Accelerates Data Incident Detection, Resolution

Michael Segner
Michael writes about data engineering, data quality, and data teams.
The modern data stack consists of multiple interdependent data systems all working together. Data anomalies and incidents can be introduced across any point of this pipeline, which can make root cause analysis a fragmented and frustrating multi-tab process.
Was it a query changed within Snowflake? A modified dbt model? Failed Airflow job? None of the above?
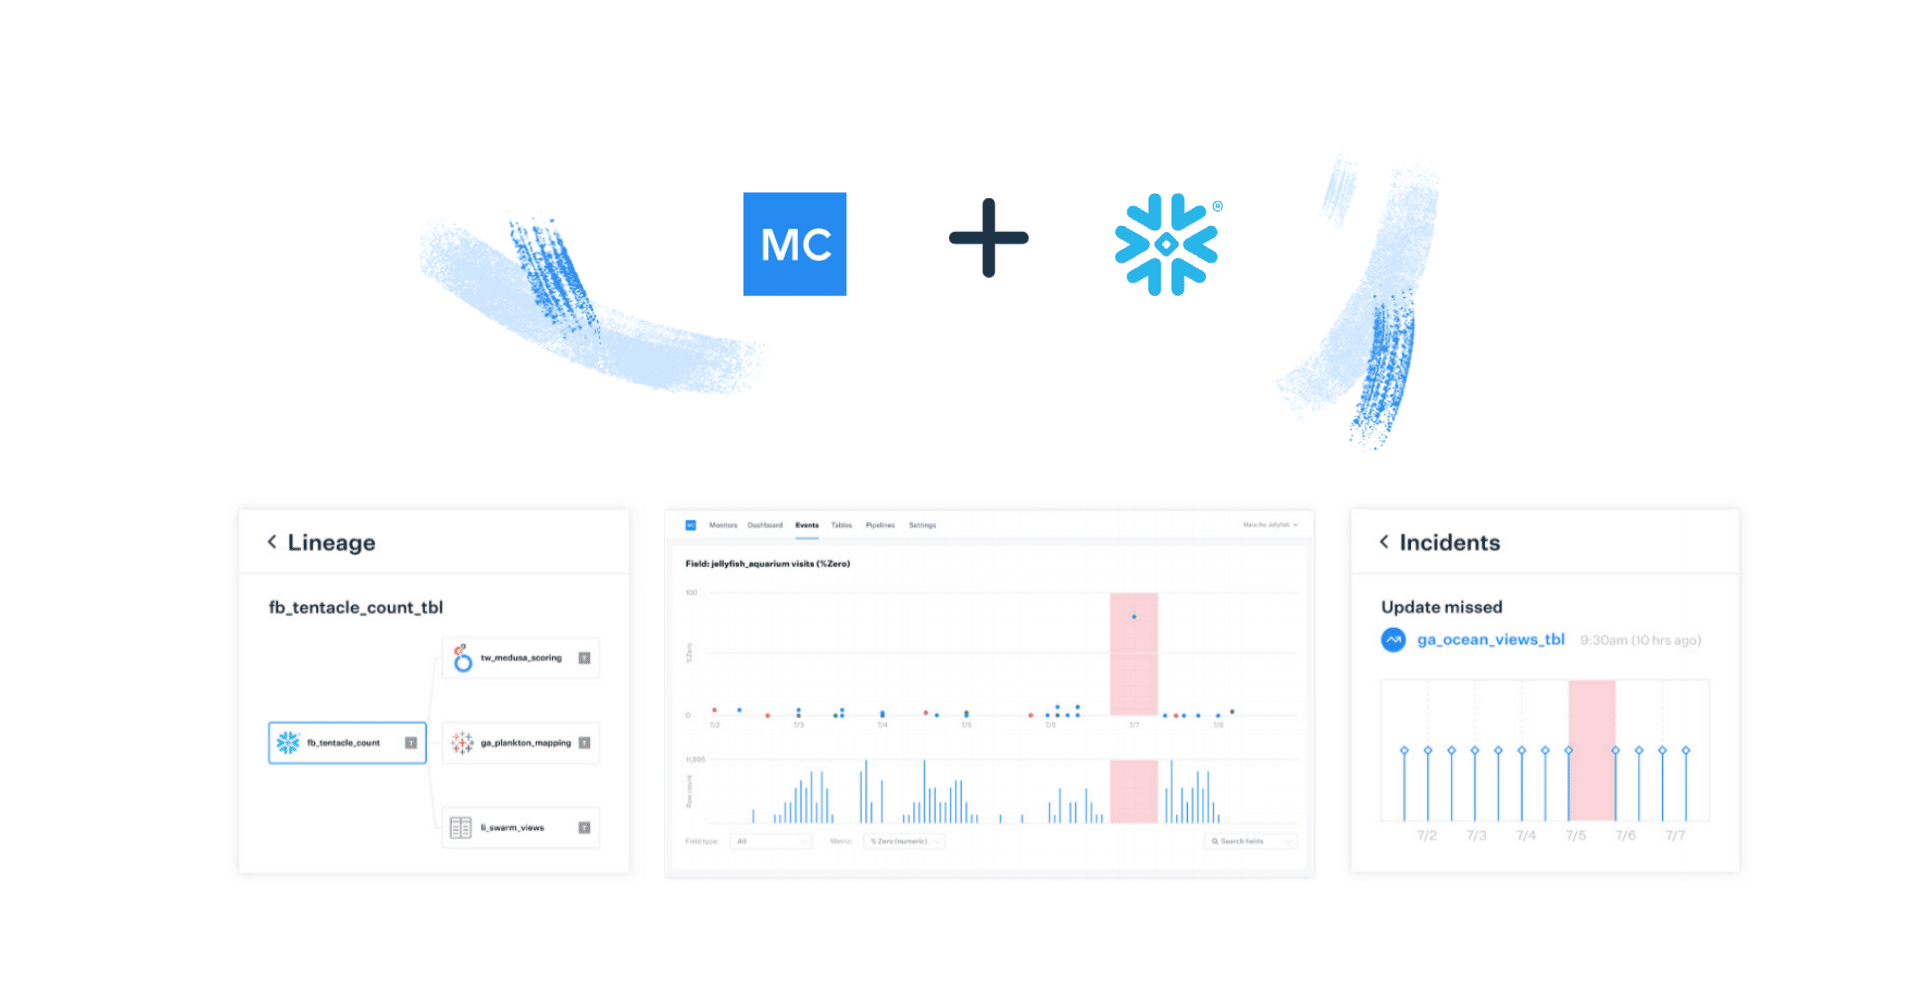
That’s why, in addition to integrating with your central data warehouse, lake, and lakehouse, Monte Carlo also integrates with transformation, orchestration, and now data ingestion tools. Now teams can instantly get full visibility into how these systems may be impacting their data assets, all in a single pane of glass.
System level root cause analysis at a glance leveraging Monte Carlo.
How does the Fivetran integration work?
Fivetran automates the building and management of data pipelines, helping data teams scale.
Rather than needing to write code every time you want to bring data from source to target system, you can simply point and click to leverage a Fivetran connector. It’s a huge benefit to offload and automate ingestion pipeline management.
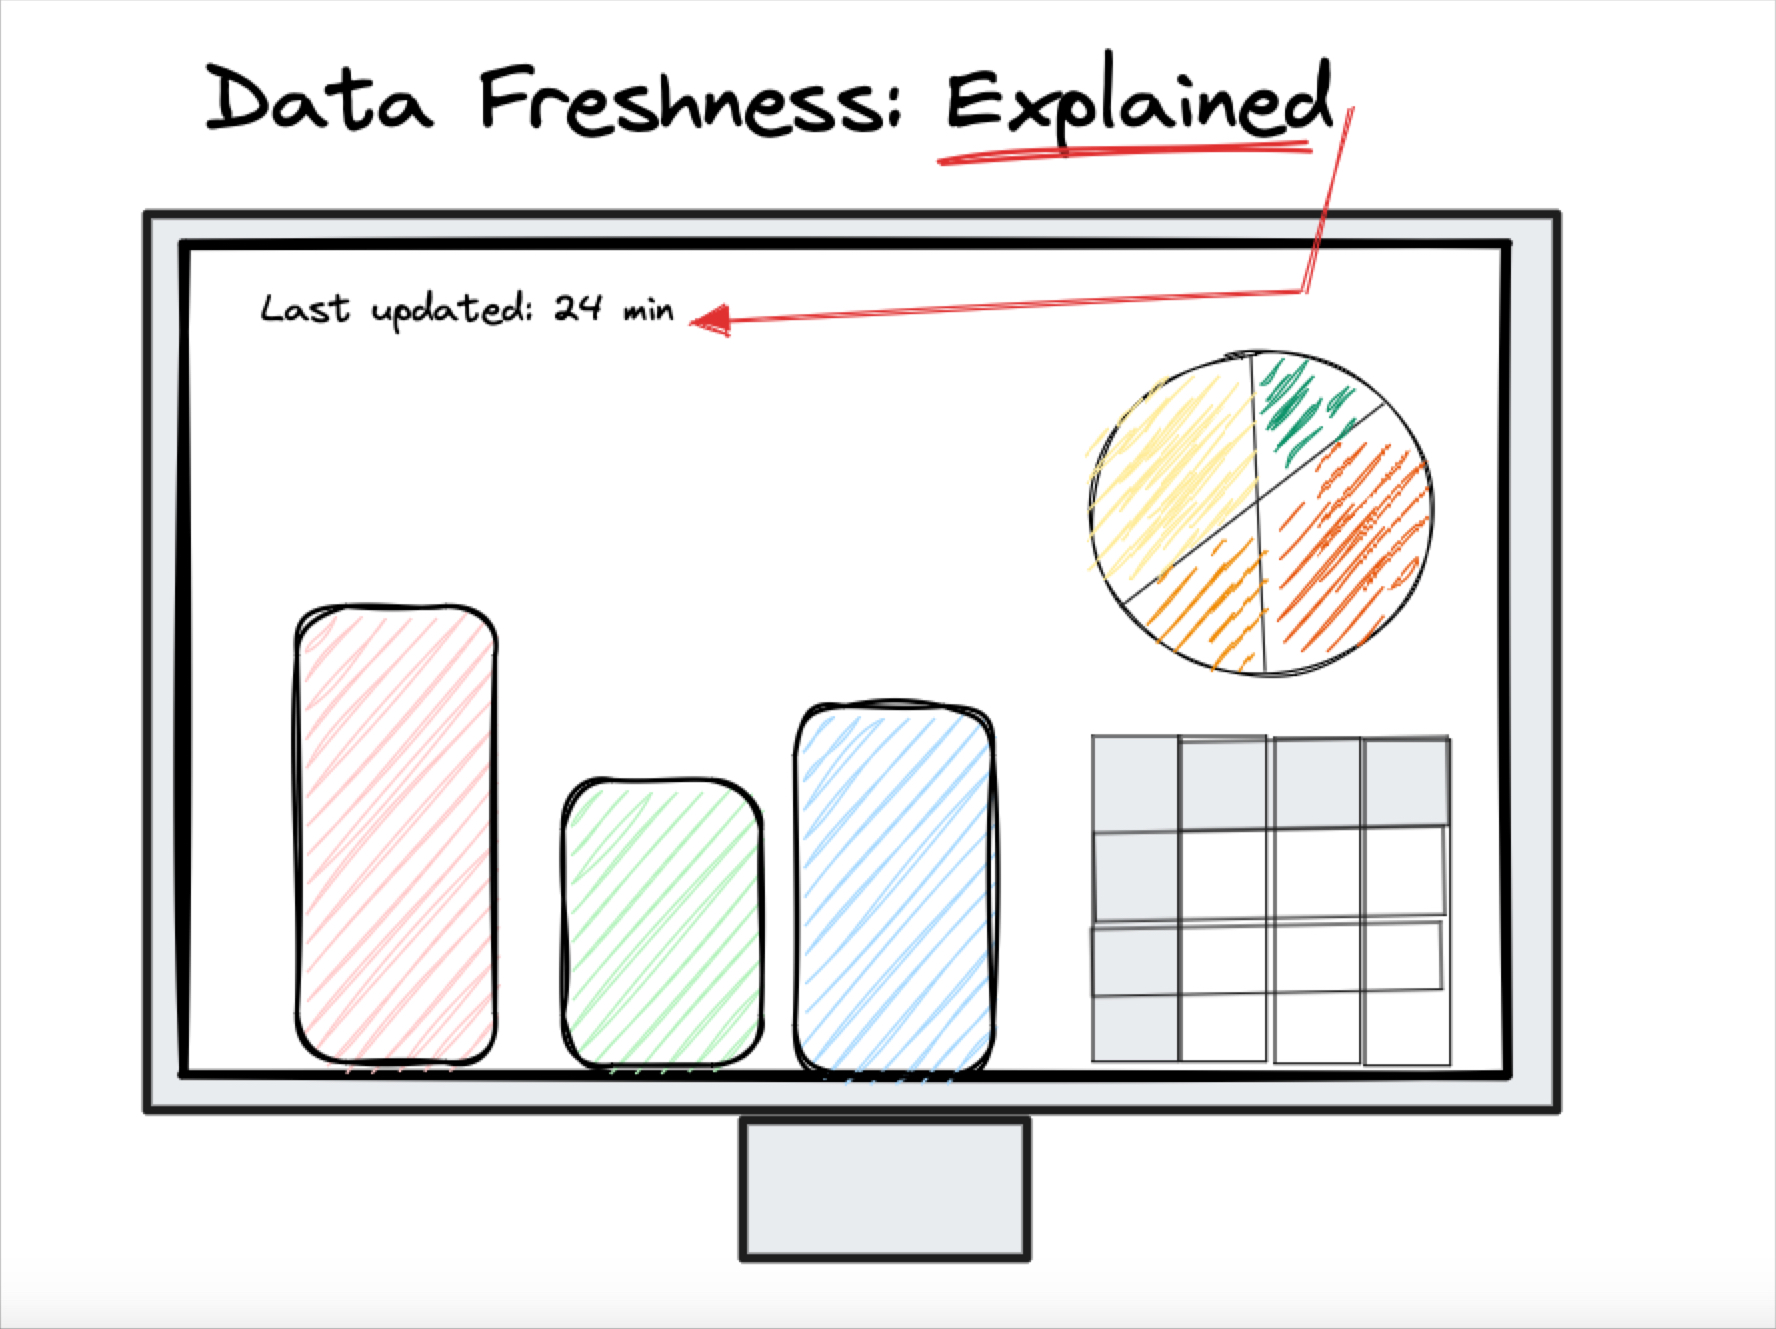
But, as anyone familiar with building pipelines knows, any number of issues can cause an unexpected interruption to your data pipeline, and as a result, create stale dashboards or underperforming machine learning models. These unexpected events may originate from a temporary source API outage, or even a schema change introduced by a Salesforce admin upstream when adding new custom objects.
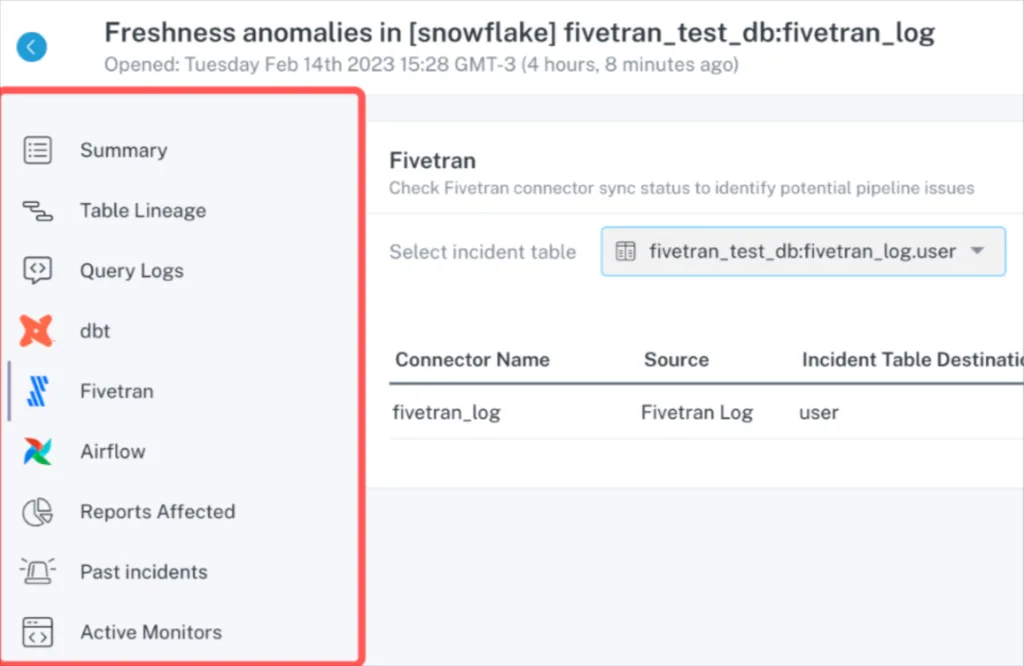
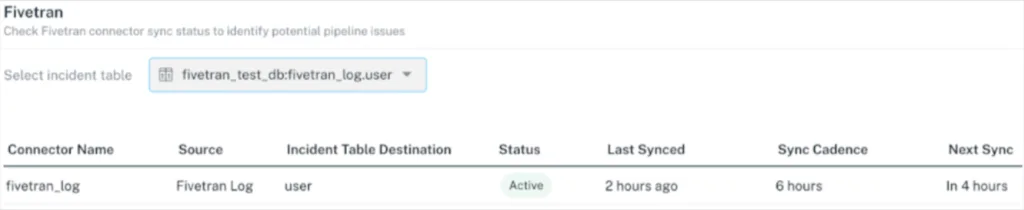
With the Monte Carlo Fivetran integration, monitoring coverage is automatically integrated the moment the pipeline is built. When an issue occurs with your Fivetran connector, Monte Carlo is able to show these issues in the context of your data pipeline and notify you of the downstream impact in your communication tool of choice (email, Microsoft Teams, Slack, PagerDuty, etc).
You can opt to build notifications yourself by leveraging the Fivetran metadata API, or create a SQL based alert with your log connector, but you’ll need to manually build alerts for every new connector, and won’t be able to visually understand where incidents downstream originated from connector outages upstream. Speaking of…
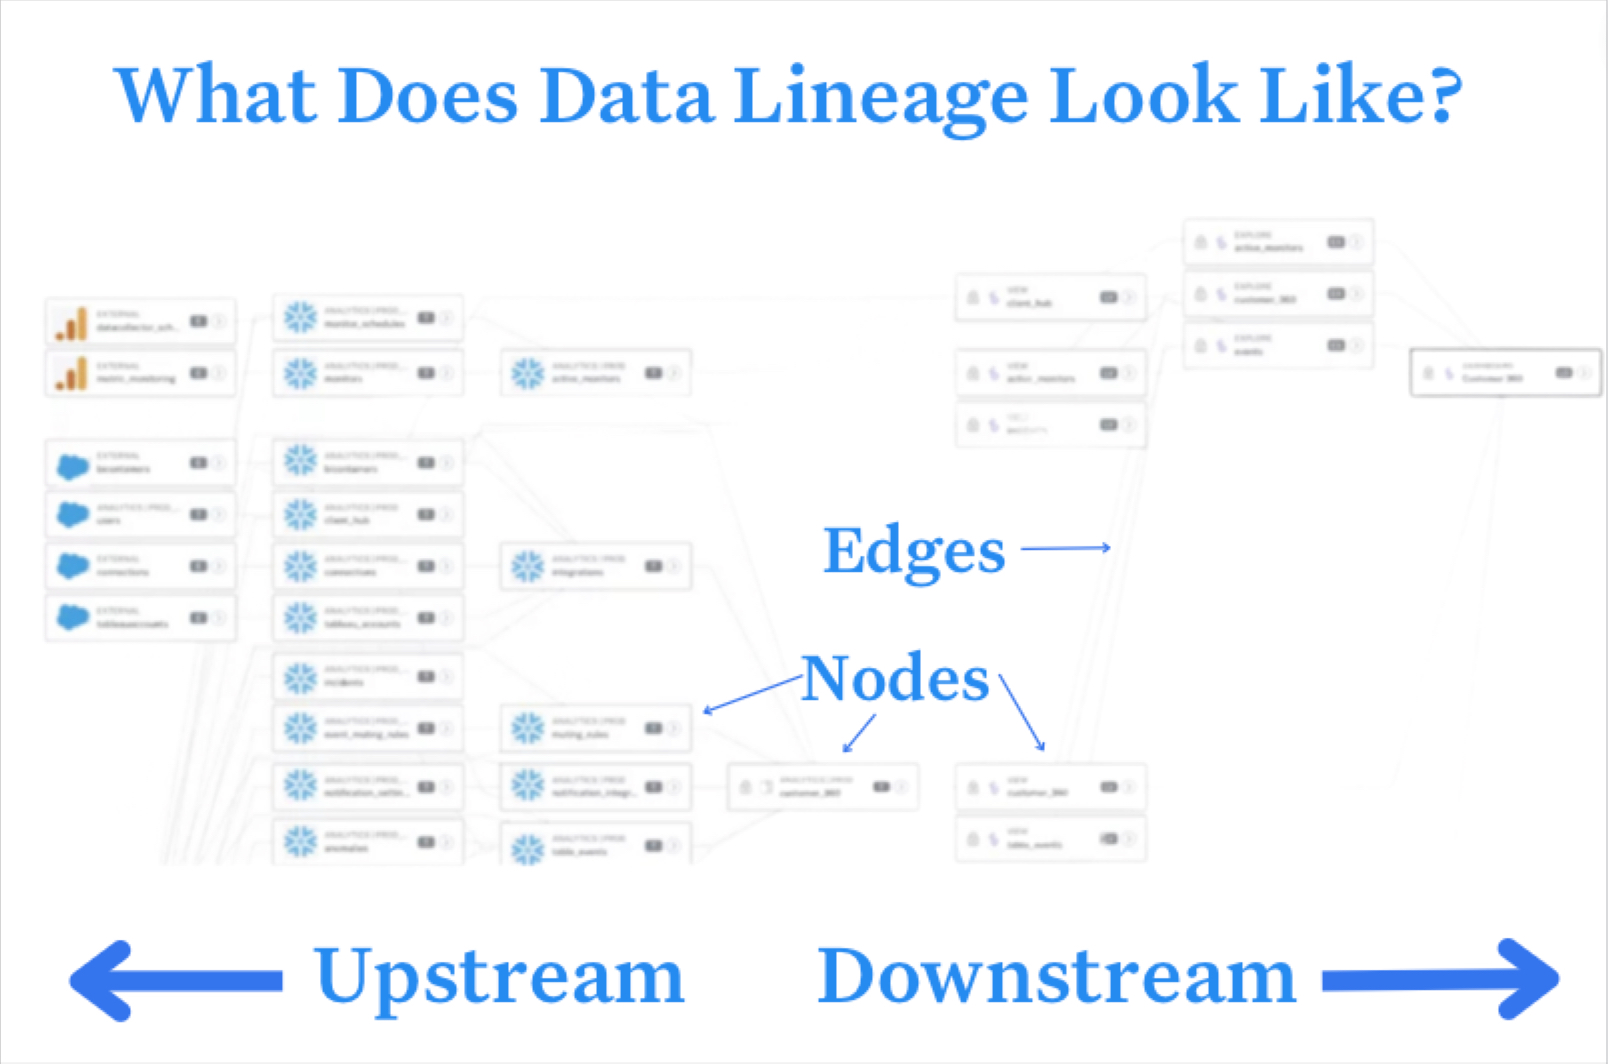
Data lineage from pipeline to BI
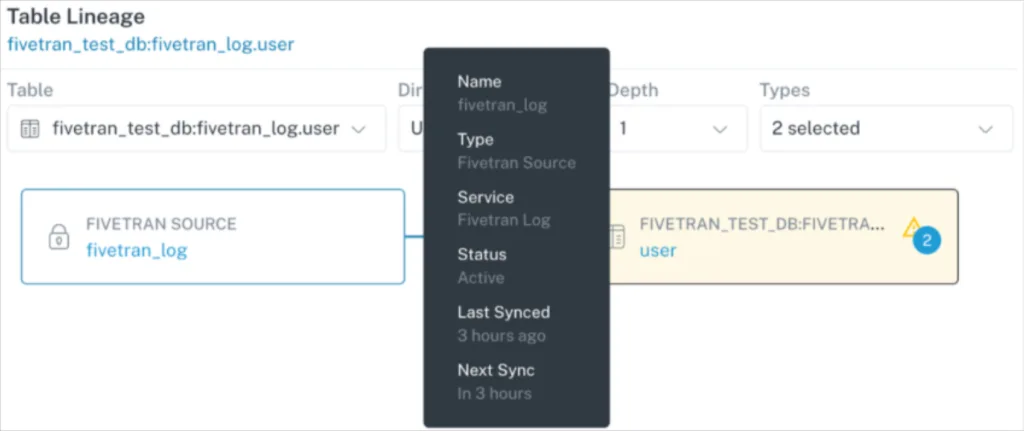
With the new integration, users can quickly understand the exact Fivetran connector experiencing an outage or any interruptions to your typical Fivetran scheduled loads. Users will also have full visibility into data lineage from pipeline to BI.
This allows you to visually trace an issue from a reporting table many levels downstream up to the raw table(s) loaded by Fivetran, saving valuable data engineering resources that would otherwise be spent manually tracing through queries and sampling tables.
How do I do this?
If you have a Monte Carlo account, you can add your Fivetran integration through your Integration Settings, following these steps:
- Install the Monte Carlo CLI
- Check if the Data Collector version you have supports Fivetran
- Obtain a Fivetran API key and secret
- Create a Fivetran integration with the Monte Carlo CLI
More details are outlined in our documentation.
Want to get started with Fivetran? Set up your free trial today, or speak to one of their experts!
Interested in full data observability from pipeline to BI? Schedule a time to talk to us using the form below!
Our promise: we will show you the product.
Read more posts.