Product demo.
  What is data observability?
  What is a data mesh--and how not to mesh it up
  The ULTIMATE Guide To Data Lineage
 All I Want To Know Is What’s Different – But Also Why and Can You Fix It ASAP?


Barr Moses
CEO and Co-founder, Monte Carlo. Proponent of data reliability and action movies.
I link to Benn Stancil in my posts more than any other data thought leader. I might not always agree with his answers, but I almost always agree with his questions.
True to form, last week he tackled one of the most important questions data leaders need to ask which is, “How do we empower data consumers to assess the credibility of MDS-generated data products?”
The question and discussion originated from dbt co-founder Tristan Hardy’s article–who also provided some interesting insights you should read–but to keep this simple I’m going to focus on Benn’s arguments as they are a bit more direct on the topic of data quality and data trust.
Benn answers the data trust question by suggesting data teams shift from focusing on monitoring data during the ingestion and transformation stages, and focus more on monitoring the consistency of the final outputs (although to be fair, he does hedge with a “monitor inputs too!”).
In other words, data teams and their data consumers can tell something is wrong if there is an anomaly or outlier with a previously consistent metric. In that spirit, he proposes some creative solutions around how to help surface issues of data/metric inconsistency to business stakeholders as they evaluate a data product.

I always enjoy reading new perspectives on data quality. It’s a topic I’ve been thinking about extensively for a long time. I’ve been especially immersed in this space the last four years; every month I speak with dozens of data leaders about their specific implementation challenges.
Based on these conversations, I’d say Benn isn’t wrong about the importance of data consistency and monitoring outputs. Nor are his creative suggestions counterproductive.
What I would say is that in his enthusiasm to reimagine the world of data quality and trust, he overlooks some key points that explain why so many data teams unit test, and why so many data teams have invested in data observability as a better way to achieve data trust.
In this post, I’ll separate insight from fallacy as well as take my own stab at answering how we as data leaders can better imbue trust not just in our pipelines, but in the final output they provide.
Potholes Don’t Go Away If You Change Lanes
Benn mentions something I’ve also highlighted, which is you can’t outsmart or out-architect bad data. He writes:
“I’d contend that we’ve struggled to get people to trust our work because our approach to earning that trust—Method 1—is fatally flawed. The road from raw data to reliable metric has a limitless variety of potholes; there can be no system, no matter how complete or comprehensive, that can tell us we’ve patched all of them. Contracts, observability tools, data tests—these are mallets for playing whack-a-mole against an infinite number of moles.”
It’s true. Data breaks – it’s a tale as old as time. However, our conclusions to this same observation are radically different.
Benn seems to be throwing the baby out with the bathwater. No, we will never be able to fully eliminate data downtime, but making the effort has critically positive benefits.
Our software engineering brethren have achieved an impressive 5 9s of availability with help from observability. And while that level is not required for most data product use cases today, as services become increasingly reliable more valuable things are built from them. This allows data teams to unlock more value for their organizations.
Cutting corners on data quality efforts can have equally critically negative impacts as Unity Technologies and Equifax can attest.
So if we can agree that “the limitless variety of potholes” is not a reason to give up on our collective reliability journey, let’s discuss why monitoring data from ingestion through transformation matters just as much as monitoring your outputs or even more.
The Next Chapter of the Data Quality Story: Incident Resolution
In a nutshell, monitoring across pipelines and systems allows you to fix problems – not just detect them.
Let’s continue Benn’s thought experiment of putting in place a system that just monitored and surfaced the discrepancy of the latest, final metric to its historical value. This system highlights an anomaly for the business user or data team…what happens next? The best case scenario is they ask why, but usually it’s with a colorfully worded demand that it gets fixed ASAP.
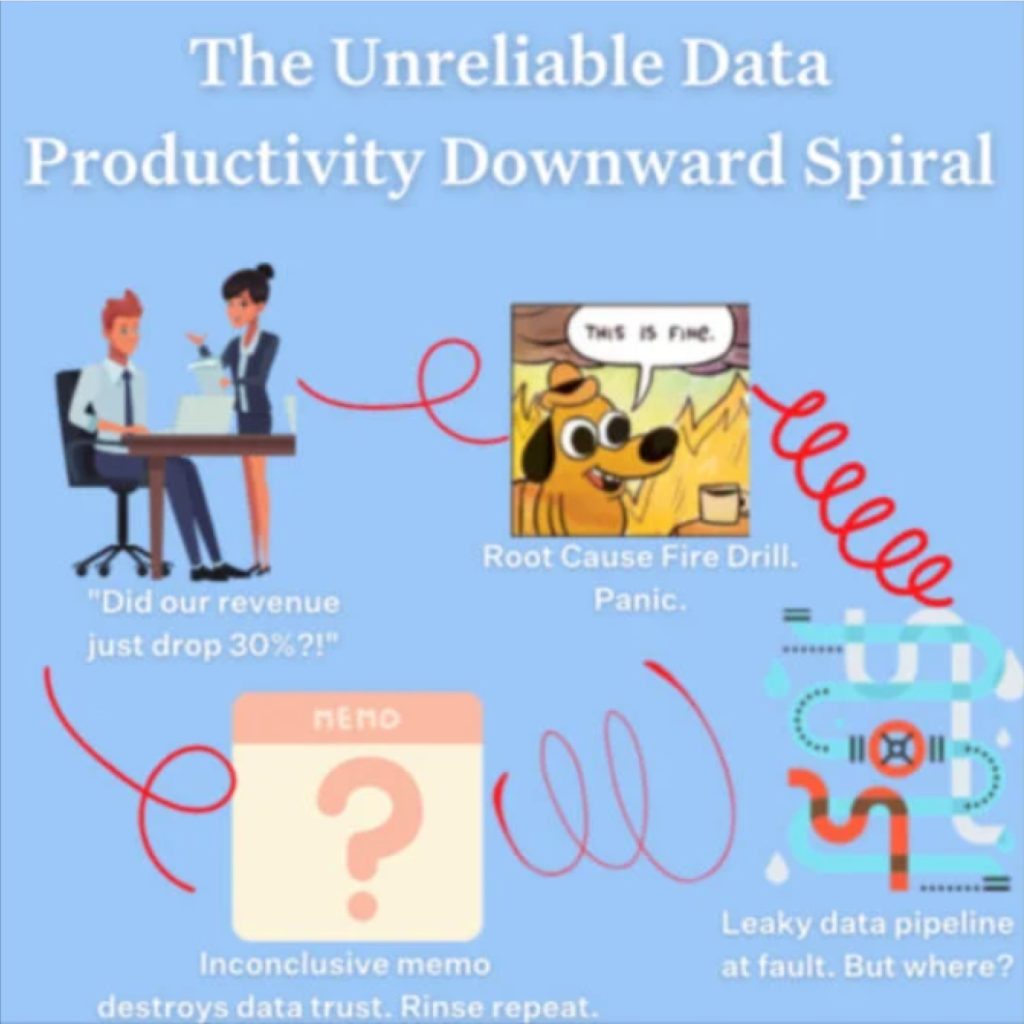
It’s a story I’ve heard countless times: fire drill time! The C-Suite wants all hands on deck to figure out if the anomaly is real or a technical glitch before they report this number to the board. Now you have members of the data team checking system permissions, combing through code, and checking input data to find a needle in a haystack.
Or, your data observability platform could do this automatically, saving your team time, money, and headaches so they can focus on what actually matters. Here’s where data observability comes in – monitoring business logic tells you that something broke, but how can you tell it was an empty query not a dbt job failure.
As someone who is intimately familiar with data team’s reliability workflows and incident resolution (as well as having managed data systems AND stakeholder reactions to data downtime myself in a prior life), I can tell you this is a significant omission.
The average team notices an incident in about 4 hours, but takes 15 hours to resolve it once detected (a 50% increase from just the year before). As stacks have gotten more complicated, incidents become more difficult to detect effectively without monitoring data across the pipeline.
Finally, I would be remiss if I didn’t call out that monitoring the data from ingestion and as it hops from transformation to transformation does have some detection benefits as well such as:
- Looking at outputs only, you can miss issues which initially have a small impact on the outputs but that grow over time. This slow time to detection can be costly when data teams have to backfill and data consumers furrow their eyeballs. Choozle’s CEO talks about this advantage, “Without a tool [monitoring data from ingestion through transformation], we might have monitoring coverage on final resulting tables, but that can hide a lot of issues,” he said. “You might not see something pertaining to a small fraction of the tens of thousands campaigns in that table, but the advertiser running that campaign is going to see it.”
- It can actually be more efficient to monitor certain key datasets well than to check all of the downstream outputs. For example, your users table is probably a key component in many critical outputs – it makes sense to observe it.
- Organizationally, data teams oftentimes struggle in identifying their most important outputs. It changes over time and they lack visibility into who uses which datasets for what purposes. So pragmatically, focusing on outputs has been historically tricky for many teams.
Rediscovering Data Observability
It’s important to point out Benn’s thesis is built from a powerful insight: data consistency doesn’t always guarantee correctness, but it’s a strong indicator. Or as he puts it:
“Of course, you could be wrong both times; matching numbers aren’t necessarily right numbers. But as far as rough and easily accessible heuristics go, it’s pretty good. And the more iterations that match—if a metric’s historical charts have been consistent for eight quarterly reports in a row—the more trust that it inspires.”
In this way, he has discovered the need for data observability. We get asked all the time by data teams, “how do you know our data is right?” Our answer is, “we don’t, we just know when it’s behaving differently.”
In fact, one of the main differences between data observability and unit testing is that machine learning algorithms are more efficient at setting and maintaining thresholds for what is anomalous.
That is true for monitoring the data itself, what Benn calls outputs, as well as for the data pipelines, or what Benn refers to as inputs. In other words, data observability does exactly what Benn prescribes: monitoring output consistency as a proxy to correctness (in addition to monitoring data from ingestion through transformation as described earlier).
We should take a moment to highlight (as Benn does) that consistency does not ALWAYS ensure correctness.
- There could be a business reason for metric inconsistency (like a pandemic);
- You can be consistently wrong; or
- You can experience data drift over time.
In speaking with data leaders, all of these scenarios are more important to account for than the weight Benn gives them in the quote above.
For example, a key machine learning algorithm that generated millions of dollars for an e-commerce company was inaccurate for more than six months. It was finally caught when a data freshness detector called attention to the issue, in other words, by monitoring data in the pipeline! This was an anomaly even a team of dozens of analysts wasn’t able to gut check.
Where We Agree: Solving Communication Gaps
As the co-founder of the BI tool Mode, Benn brings a helpful perspective to a critical gap that exists in building data trust across an organization. Specifically, that there needs to be better communication of the quality of a data product within the dashboards where business stakeholders go to consume data. He writes:
“For time series, automatically compare the current values on the dashboard with those from a prior few days, and show people when the two have drifted apart. Dashboard consumers are doing this already; we might as well do it for them. Better to proactively tell people when something has gone awry rather than have them find out in the middle of a testy board meeting.”
I couldn’t agree more – this is why we firmly believe that data observability should be integral to data analytics workflows, from end to end. The only way to tell them that something has gone awry is if you catch it quickly and understand the reliability of the source system. By serving as a central source of truth that integrates with your other modern data stack tooling, data observability does just that. It’s important to have tight integrations at the BI level.
Benn also points to how a semantic layer can help ensure that when a metric is referenced, everyone can be sure they are talking about the same metric that is calculated in the same way. I agree, and while my observation is that semantic layer adoption has been slow, I suspect it will accelerate as the data world turns their attention to how generative AI can help their users query data in natural language.
My Answer for Building Data Trust
My answer to how we get data consumers to trust the data products we build is multifaceted.
Data consumers care about metric consistency, but they also care about the underlying systems powering them, too. Their jobs depend on it.
They also care about how quickly the data team supporting the product detects and fixes issues. Stakeholders can only gain trust in the “consistency” of the data if they trust the team who’s generating it.
In software engineering, post-mortems provide valuable information for internal stakeholders and customers alike when things break, offering suggestions for how to improve to prevent future issues. If Slack goes down and it tells customers “Hey, the site is broken but we don’t know why, how, or when it broke,” that helps no one. In fact, it erodes trust.
If we’re going to treat data like a product, let’s strive to provide the level of detail and specifics of an Amazon.com product listing.

In addition to details, data consumers care about consistency and explainability. It’s hard to trust something if you don’t know how it works.
Explainability needs to be as central a concept to data platforms as it is to machine learning models. If a metric moves suddenly the quicker you can explain the underlying factors (whether technical or operational), the more confidence you will instill. This can be achieved through a combination of semantic layers, old-school data modeling, and data observability – monitoring pipelines and data itself.
In closing, I’d like to again thank Benn for sharing his perspectives as these dialogues can help move all of us who work in data to our common goals: less data downtime, more data value.
Interested in how data observability can level up your data quality strategy? Schedule time with us by filling out the form below.
Our promise: we will show you the product.
Read more posts.