Product demo.
  What is data observability?
  What is a data mesh--and how not to mesh it up
  The ULTIMATE Guide To Data Lineage
 Scaling Data Quality for Innovation and Growth: Aircall’s Data Observability Journey


Sydney Nielsen
Sydney is Monte Carlo's customer marketing manager. When she's not obsessing over customer happiness, she's playing with her cat, Frieda, sewing, or chasing after her daughter.
In less than a decade, Customer Communications and Intelligence Platform Aircall has become an integral part of business operations for more than 18,000 small and medium-sized businesses. Customer support and sales teams at these companies use Aircall all day, every day, generating an enormous amount of data.
And with about 700 Aircall employees working from six offices around the world, all that internal data needs to be readily available and reliable.
Remarkably, Aircall makes it happen — with its data engineering team.
What’s the secret to their success? That’s what we set out to learn from Tanguy d’Hérouville, Aircall’s lead data engineer. He shared his team’s approach to designing a data stack that supports autonomy and builds data trust across the organization — and shares what he wishes he knew at the beginning of Aircall’s data observability journey.
Table of Contents
Aircall’s diverse data landscape
Aircall specifically targets the SMB market, which means their customer base is broad and incredibly diverse. They support companies across industries, from legal and financial services to retail and consumer goods to SaaS and IT consultants. With so many data use cases and needs across the org, self-serve analytics quickly became the clear path forward.
“We have a high number of customers with a lot of diversity,” says Tanguy. “Because of that, processes have to be automated as much as possible through the use of the data.”
Within Aircall, data ownership is divided in two: Tanguy’s data team handles all internal-facing data, while the broader tech team handles customer-facing analytics for clients and AI features.
The data team structure
Since the data team is responsible for serving up internal data across the organization, their team is structured according to each vertical:
- Product Analytics helps product teams leverage data around application usage
- Customer Analytics transforms customer data into reusable knowledge for support, success, and onboarding teams
- GTM Analytics helps marketing, sales, and finance teams leverage data to improve revenue and profitability
- Data Engineering builds and maintains the data infrastructure platform and processes
Let’s double-check the math: as of late 2023, Aircall has a ratio of 1 data engineer to 6 data analysts. That lean engineering team is possible because of the intentional design of Aircall’s data stack.
The self-serve data stack
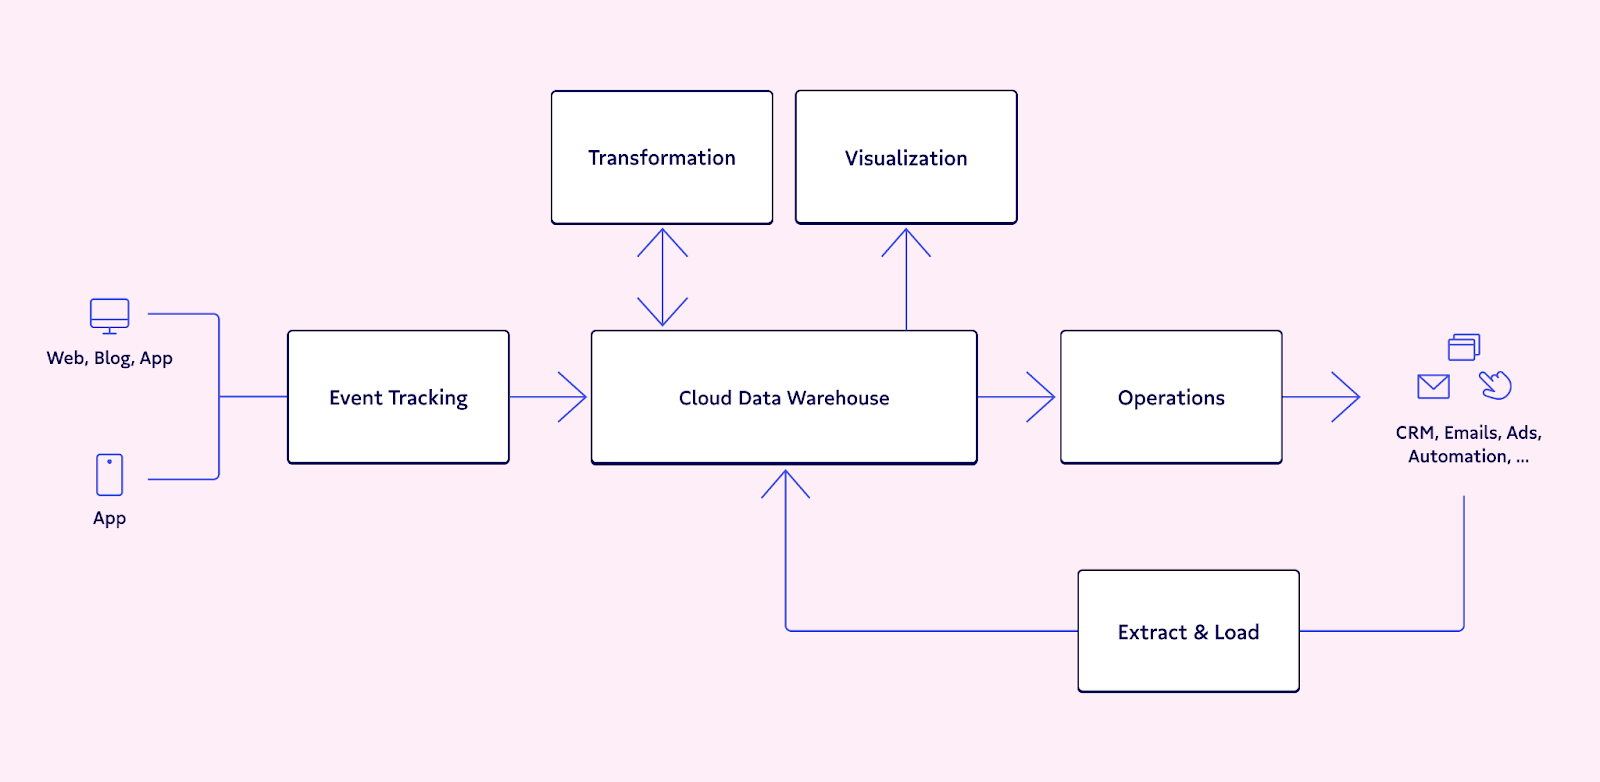
Since its inception, Aircall’s modern data stack has been built around the same core components: a central warehouse (Redshift) and a scheduler (Airflow), with additional tools supporting functions like ingestion and reporting.

But in the five years since Tanguy joined the team, the stack has evolved to meet three primary criteria: common and easy to use solutions, designed for batch over streaming data, and centered around SQL and dbt.
By prioritizing common technologies with robust integrations and large user bases, the data engineering team can readily access the information they need to make decisions, implement and integrate, and maintain the stack with relative ease. And since they have very few use cases that require real-time data, they’re able to simplify ingestion and transformations by treating almost all data in batch on an hourly or daily basis. Once the team replaced in-house ingestion solutions with Fivetran and started using dbt for transformation, everything got simpler.
“Our data stack changed massively the day we decided to use dbt as a framework for our data transformations, and got rid of a great deal of complexity on our transformation layer,” says Tanguy. “Through using dbt, ingestion tools, and monitoring and observability, it allows us to give a lot of autonomy to analysts and require less investment in terms of data engineering.”
Today, Aircall’s analysts are in charge of the entirety of their data pipelines, from ingestion with Fivetran or Rudderstack to transformations in dbt to reporting in Looker.
“The data engineers only have the stack to manage,” says Tanguy, “as well as putting processes in place to ensure high standards in code and data quality.”
Aircall’s journey to data observability
Tanguy and his team had monitoring in place to let them know when SQL errors or infrastructure issues occurred, but nothing to monitor the quality of the data itself. That led to stakeholders second-guessing the data they provided.
The challenge: growing distrust in data
“Over time we’ve encountered issues regarding data quality, and the one of the ways to know when they were occuring was to rely on our stakeholders to warn us when something comes up,” says Tanguy. “Because our stakeholders were the ones pointing out that something was wrong, we had an issue with trust in the data being provided by the data team.”
Their first line of defense was implementing dbt tests. But testing alone wasn’t scalable, and Tanguy saw a lot of irrelevant tests being put into place. They knew a better solution was needed when Tanguy’s team discovered that one of their main customer satisfaction metrics was inaccurately calculated and skewed due to dependency issues.
“It took us weeks to notice that something was wrong,” says Tanguy, “and time to figure out the root cause of the problem. It became clear we needed to both find a way to limit the number of issues we were seeing, as well as being informed ASAP when they did occur — so we could be as proactive as possible.”
Tanguy and his team began investigating a new solution: data observability.
The solution: data observability
The Aircall data team began exploring data observability solutions, and benchmarked and tested several solutions in the space. Ultimately, they went with Monte Carlo’s data observability platform.
“In the relatively new field that was data observability, Monte Carlo was the one showing a lot of maturity in terms of product and features,” says Tanguy. “They also offered integrations with many of the tools we use, including dbt and Looker.”
Tanguy and his team implemented Monte Carlo across their data stack, leveraging its automated monitoring and alerting to become the first to know when issues occurred. In most cases, they use the out-of-the-box monitoring options, such as freshness or volume anomalies. But for critical assets, they set up custom monitors to track specific KPIs and business use cases.
To maintain the data team’s autonomy, the data engineers set up domains in Monte Carlo to match the verticalization of their data team structure. Each data subteam (Product, Customer, GTM, and Engineering) now receives alerts for incidents only related to their specific scopes.
“This allows for a clear ownership of incidents,” says Tanguy. “They are assigned to people who know the pipelines the best and are able to quickly understand the business impact of an incident to determine how they need to prioritize it.”
With the analysts closest to the data alerted when a pipeline breaks or data quality issue occurs, they can proactively respond and swiftly resolve issues.
Finally, Tanguy set up a separate domain in Monte Carlo dedicated to critical, cross-functional tables and data pipelines. This allows his team to pay extra attention to the most vital data assets — such as the NPS metric that instigated the adoption of observability tooling in the first place.
Outcome: reducing the impact of data downtime
With data observability layered across their stack, Tanguy and his team have been able to increase reliability and trust in several ways.
First, they detect errors and incidents sooner, allowing them to react faster and intervene before issues have time to propagate through the different layers of transformations and reporting — in other words, before stakeholders have the time to realize anything is wrong.
“We reduce the number of real incidents from our stakeholder perspective, which is good for trust” says Tanguy.
Outcome: proactively communicating when issues occur
Second, when incidents do manage to affect stakeholder-facing reporting, the data team is still able to detect those issues sooner, use lineage to identify downstream consumers, and proactively communicate any impacts.
“Our stakeholders learning about an issue with data from us, rather than finding out by themselves, helps increase their data trust,” says Tanguy. “We can show that even though incidents do happen, we are more aware and in control of the situation than we once were.”
Outcome: tracking and reporting on data quality metrics
Finally, Tanguy and his team are able to use the reporting features within Monte Carlo to track their own performance and be more transparent about data quality across the organization.
“Another differentiating factor for Monte Carlo was the strong emphasis on providing metrics and reporting on our data quality performance,” says Tanguy. “We wanted to track our progress and share internally to the rest of the company, which shows we take data quality seriously to the rest of the organization.”
Today, the Aircall data team tracks and reports on three primary data quality metrics:
- The percentage of incidents with a status in Monte Carlo — ensuring that every incident flagged is reviewed and addressed when necessary
- Time to first response and time to resolution — reflecting that issues are worked out and resolved in a timely manner
- The total number of incidents — to make sure that the data team is reducing the number of incidents, which is the end goal of observability
By implementing strong monitoring tools, Tanguy and his team are able to maintain their focus on self-serve infrastructure without compromising on data quality. This means they can strike the right balance between delivering insights quickly and upholding data quality.
Aircall’s tips for data observability
Ultimately, Aircall’s investment in data observability has improved reliability and trust in data across the organization. To complement Monte Carlo, Tanguy’s team also uses a robust series of tests and CI jobs that enforce rules and standards that need to be met before pushing new code — creating reciprocal responsibility for data quality.
But if Tanguy could go back and do it all over again, he’d approach the implementation of data observability a little differently.
“If you try to resolve everything at once, you’ll be spread too thin,” he says. “It’s better to focus on critical assets first, and make them as reliable as possible before moving on to the rest of your data. That’s something we failed to see at first.”
Tanguy advises newcomers to data observability to identify and focus on assets that have a major impact on the credibility of the team, whether that’s customer-facing data, widely shared internal data, or key metrics (like their own NPS).
Getting started with your own data observability journey
If your stakeholders take your data with a grain of salt, it might be time to learn how observability can help your team improve trust in data. Reach out to our team of data quality experts, or check out our handy Data Pipeline Monitoring 101 guide.
Our promise: we will show you the product.
Read more posts.
![[VIDEO] How Yotpo Drives Data Observability with Monte Carlo](https://www.montecarlodata.com/wp-content/uploads/2021/01/Screen-Shot-2021-01-29-at-9.35.32-AM.png)