 Product demo.
  What is data observability?
  What is a data mesh--and how not to mesh it up
  The ULTIMATE Guide To Data Lineage
 Open Source Business Intelligence Tools


Michael Segner
Michael writes about data engineering, data quality, and data teams.
Business intelligence tools provide the analytical and visualization capabilities that allow end users to analyze their data. They can range in terms of complexity, ease of use, and feature sets, but all are designed to help uncover insights through visualization.
Open-source BI tools are like the Robin Hoods here — robbing the rich features from proprietary software to give to the poor… or at least to those unwilling to pay exorbitant licensing fees.
These open-source crusaders come in two flavors: those developed and maintained by a community, thriving on collaboration and innovation, and those launched by companies, often as open-source versions of their proprietary solutions. These company-backed tools might offer a basic free version with the option to upgrade for advanced features or support.
To guide you through the landscape of open-source BI tools, here’s a curated list of twelve popular options available today (listed in no particular order).
- Eclipse BIRT
- Apache Superset
- Seal Report & ETL
- Jaspersoft Business Intelligence Suite Community Edition
- Metabase Open Source Edition
- ReportServer Community Edition
- KNIME Analytics Platform
- Helical Insight Community Edition
- Preset Cloud
- FineReport
- SQL Power Wabit
- Pentaho Community Edition
- An open source BI tool is only as good as the data it pulls
Eclipse BIRT
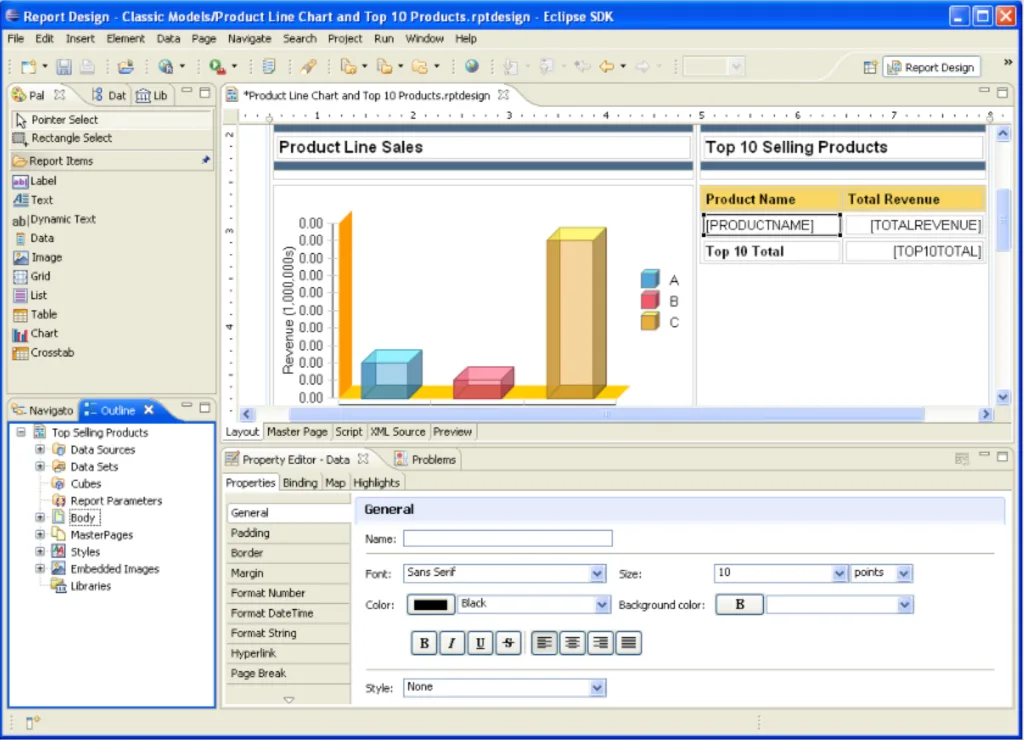
Eclipse Business Intelligence Reporting Tool (BIRT) is an open-source software project to provide a platform for reporting functionality and data visualizations. It includes a visual report designer and a charting engine. The designs you create can be used across many data sources.
Apache Superset
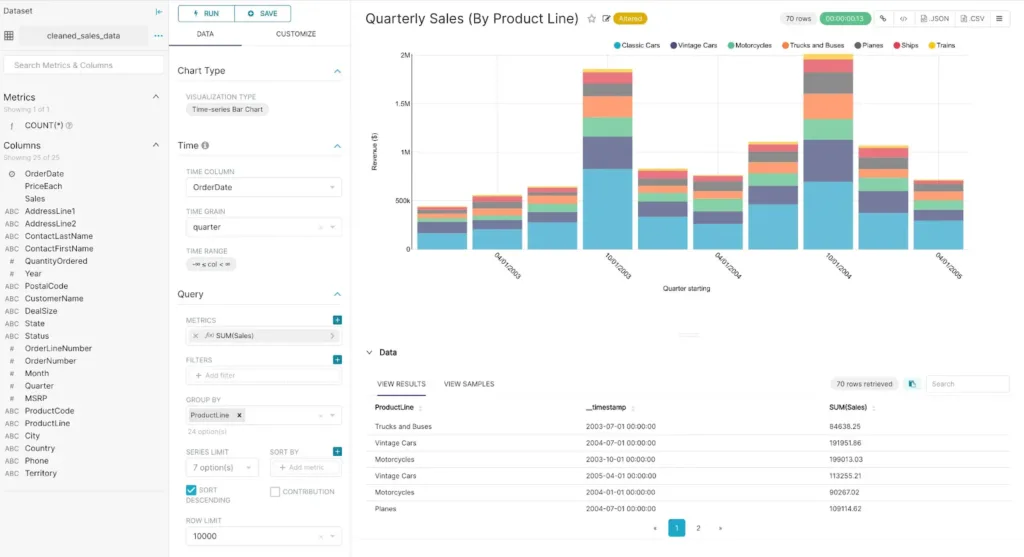
Apache Superset is a “modern data exploration and visualization platform.” This is an open source project with options including built-in visualizations, charts, and interactive dashboards. It is lightweight, flexible to connect to any SQL-based datasource, and is highly scalable.
Seal Report & ETL
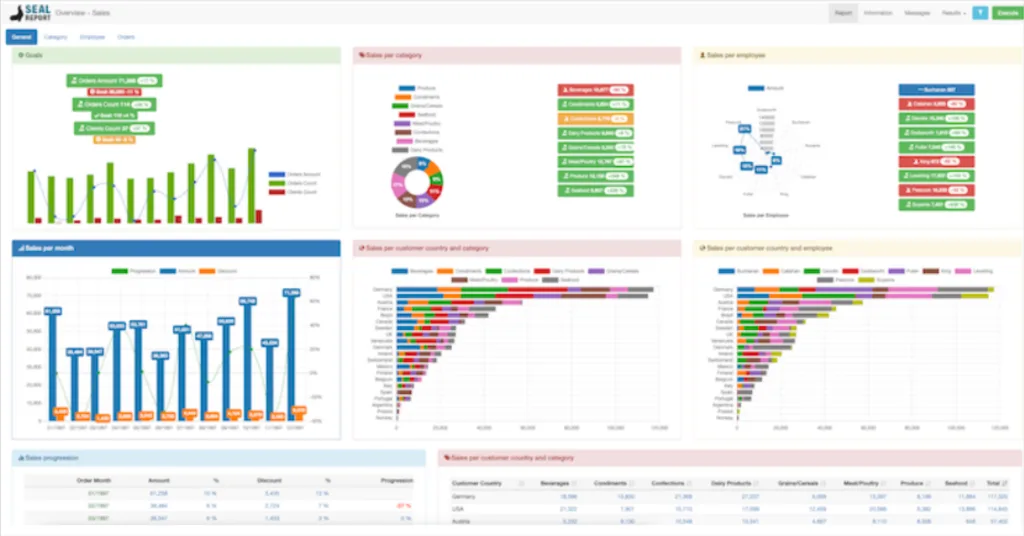
Seal Report is an open source project framework for daily reporting from any database, providing basic querying, charts, and web reports. It differs from other tools in that it was developed for the Microsoft .Net Framework.
Jaspersoft Business Intelligence Suite Community Edition
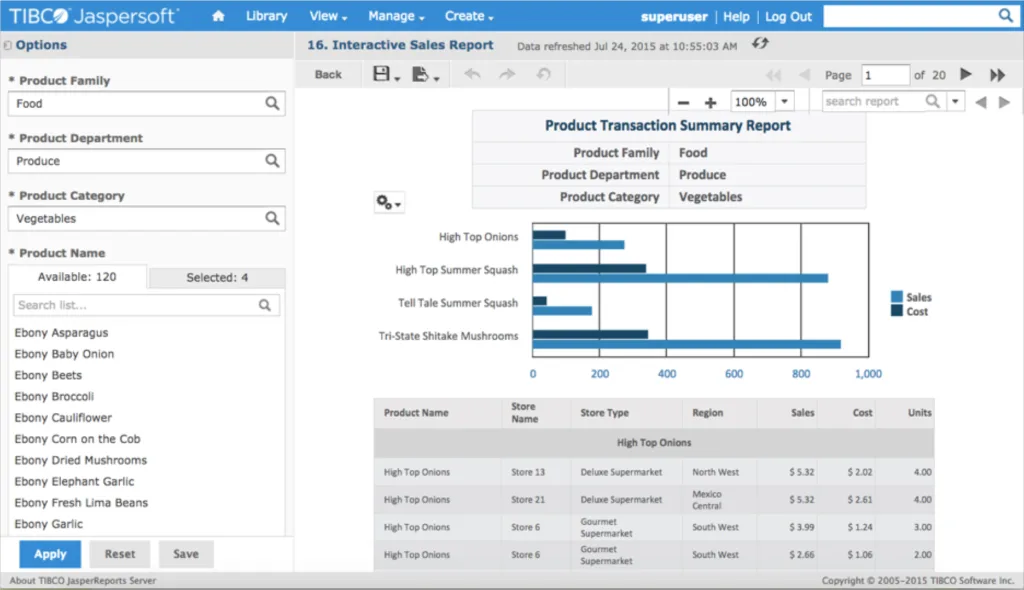
The Jaspersoft Business Intelligence Suite Community Edition is a platform consisting of different components. JasperReports is the reporting server, which can create analytics to be embedded or otherwise shared. The BI Suite also includes Jaspersoft Studio, which is an Eclipse-based report designer that features a report editing interface for visual report design that allows you to create complex layouts and preview your data. The Jaspersoft BI Suite Commercial Edition includes additional functionality, including ad hoc and dashboard design.
Metabase Open Source Edition
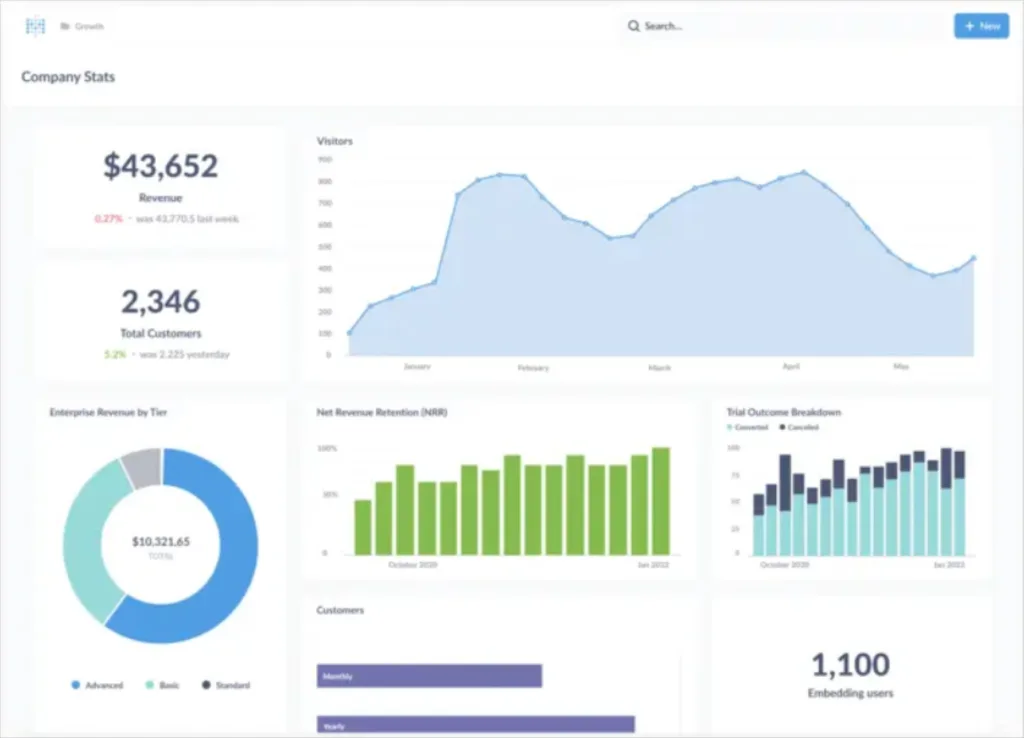
Metabase is a software vendor that offers a pared-down, free open-source edition of its intuitive, user friendly software with charts, dashboards, visualizations, and scheduling. They also offer a variety of paid tiers that can be utilized from the cloud or on premises with additional functionality..
ReportServer Community Edition
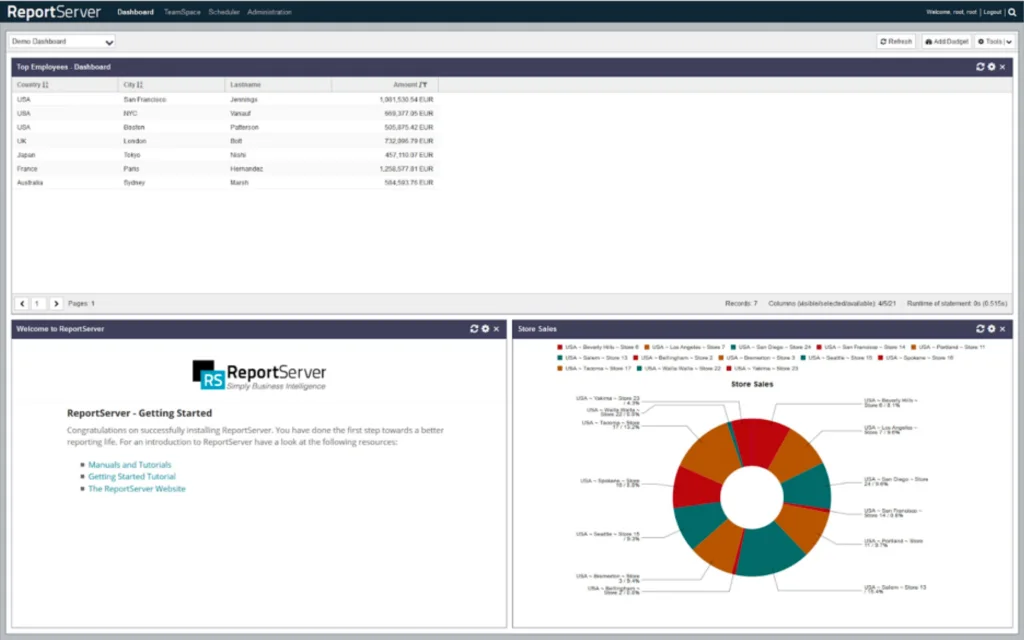
ReportServer Community allows you access to a variety of tools within a single platform interface. From within ReportServer, you can utilize some of the different reporting tools listed above, such as Eclipse BIRT or JasperReport, as well as other reporting tools and an OLAP server. The ReportServer Enterprise edition provides additional functionality for a fee.
KNIME Analytics Platform
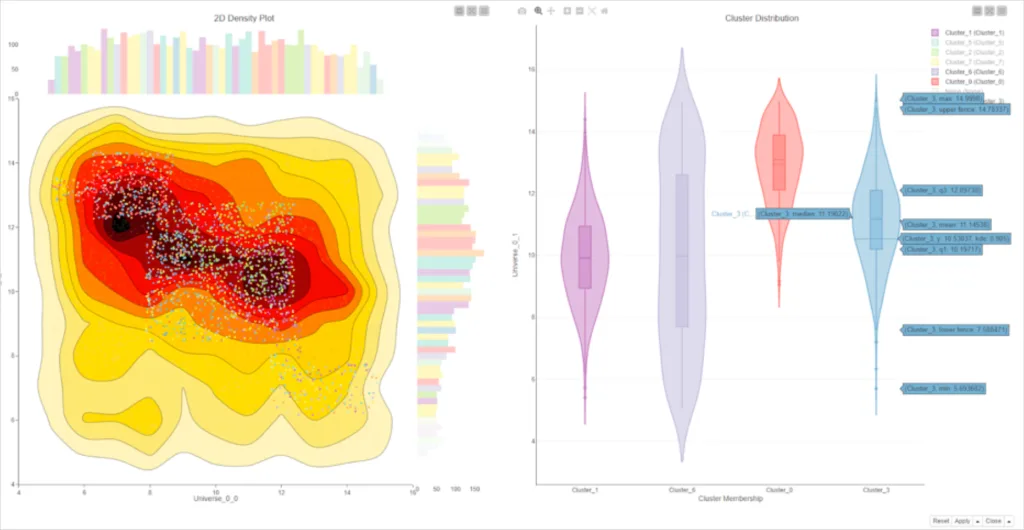
KNIME Analytics Platform is an intuitive platform that provides ease of use for beginners and robust tools for more experienced analysts. It utilizes visual workflows and a low-code/no-code interface while offering the possibility for coding or using ML libraries for advanced analysts. KNIME Hub is commercial software that can be added on for additional capabilities.
Helical Insight Community Edition
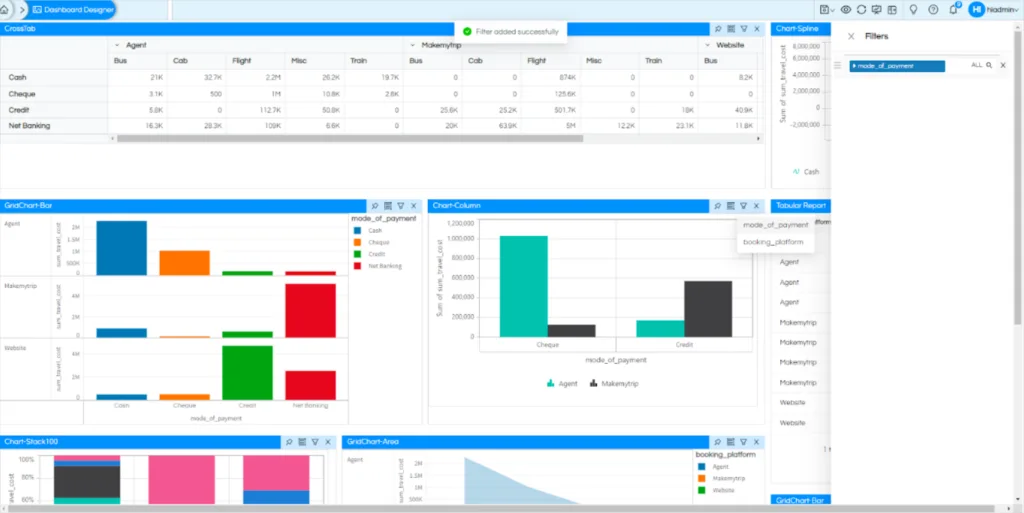
Helical Insight Community Edition is a simplified version of their BI platform, with basic reporting and scheduling. The premium Enterprise version provides access to the UI driven designers, search driven analytics, and ad hoc reporting.
Preset Cloud
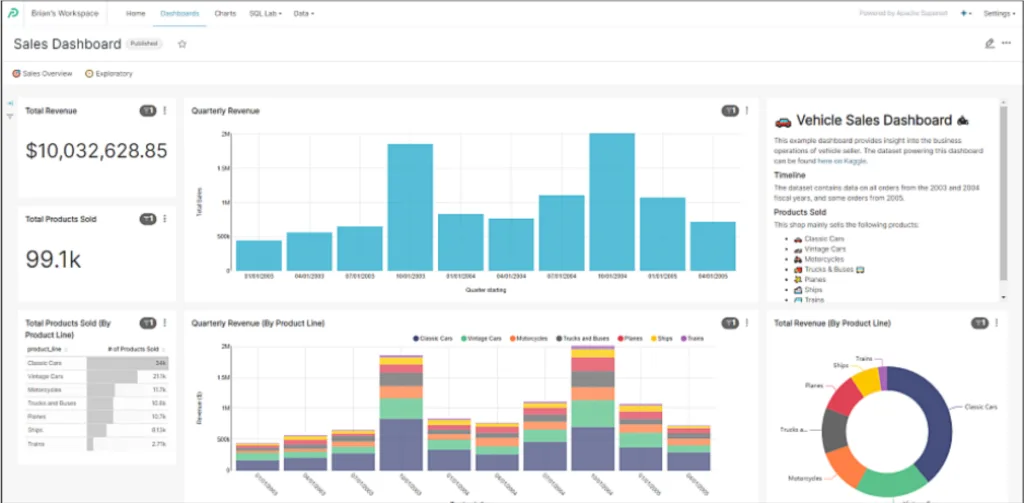
Powered by Apache Superset, Preset Cloud is a fully managed service to create custom, interactive analytics, with visual or SQL-based queries, dashboards, and visualizations. The free version allows up to 5 users.
FineReport
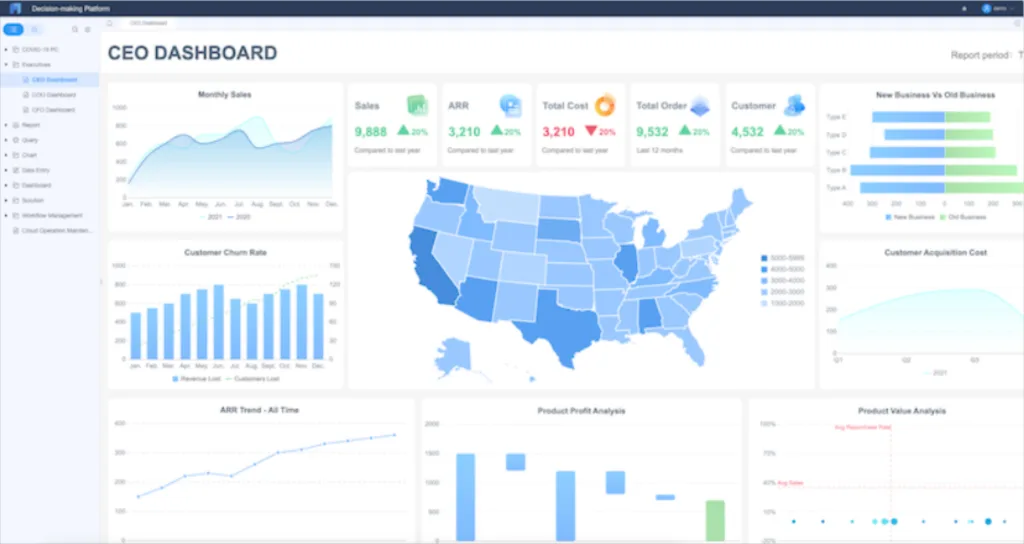
FineReport is a reporting tool that allows users to design and generate reports and publish them to a report server to be viewed on a variety of devices, including mobile apps or large presentation screens. The fully functional application is free for personal use; pricing is available for commercial use.
SQL Power Wabit
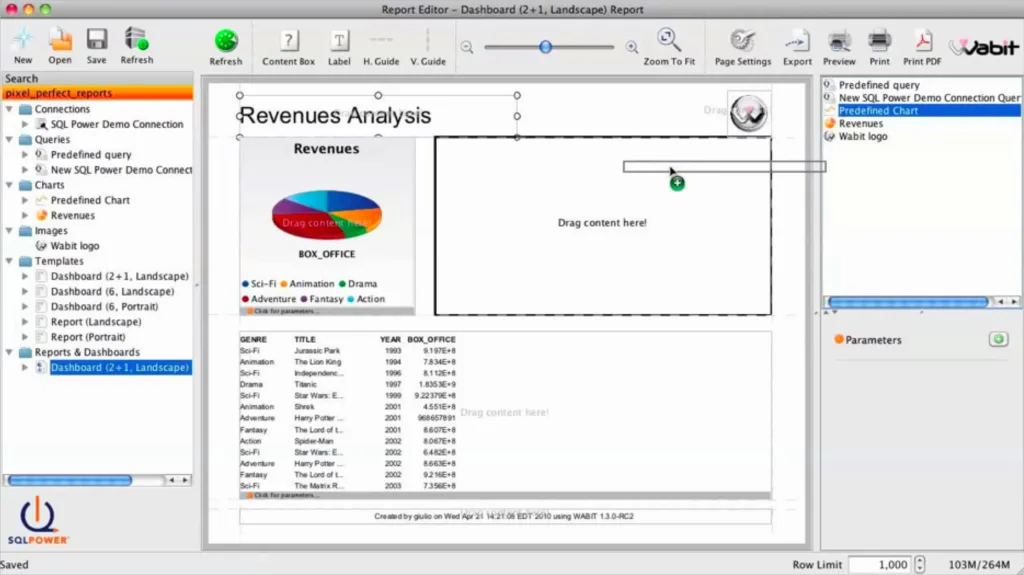
SQL Power Wabit prioritizes simplicity and ease of use, while providing a tool that satisfies the needs for everyday analysis: reports, custom dashboards, ad hoc queries. Users do not need SQL knowledge and can use the drag and drop interface instead.
Pentaho Community Edition
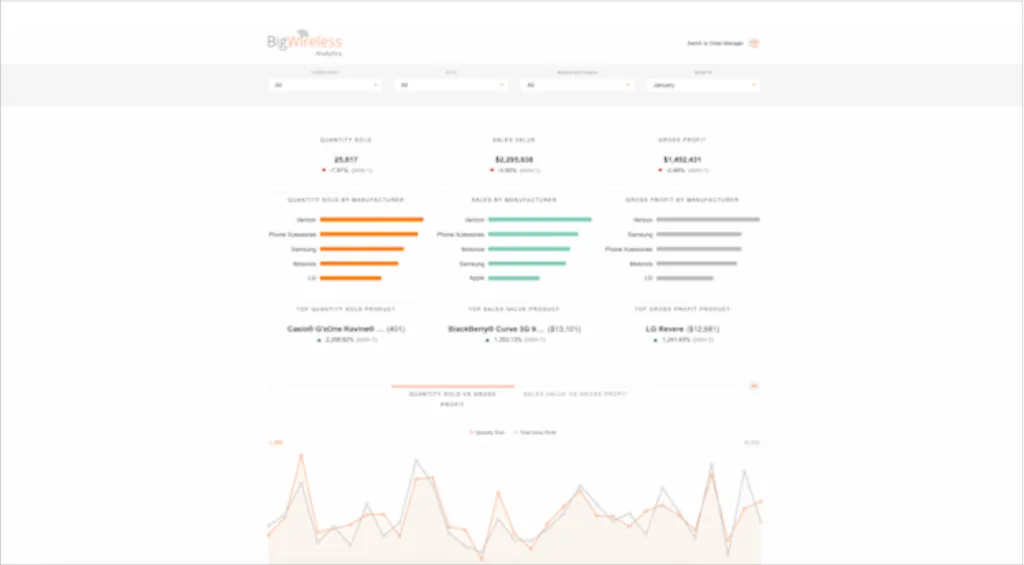
Pentaho Community Edition is a pared down version of Hitachi Vantara’s Pentaho Enterprise Edition. The Community Edition allows you to create a variety of data visualizations using their report designer.
An open source BI tool is only as good as the data it pulls
Some of the best data teams are investing in data observability before deploying an open source BI tool. Data comes in fast and messy and it only takes one instance of conflicting or stale data to lose trust in your BI reports.
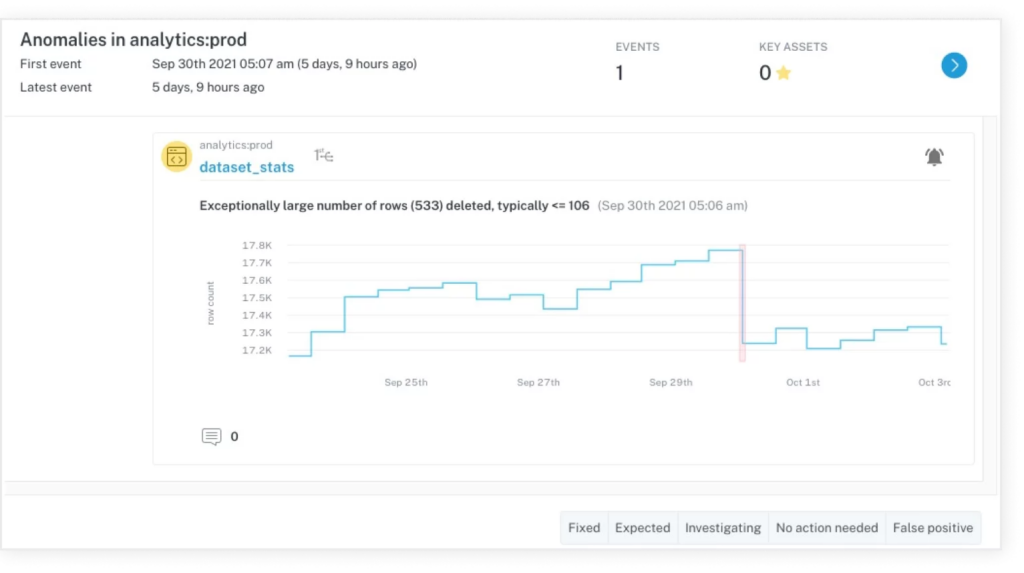
Setting up a data observability solution first like Monte Carlo gives insights into the health, usage, and lineage of your data, leading to insights that help you unlock the most value from your data.
Did we miss an open source BI tool? Tell us in the comments.
Interested to understand how data observability can improve your BI reporting? Schedule a time to speak with us using the form below!
Our promise: we will show you the product.
Read more posts.