Product demo.
  What is data observability?
  What is a data mesh--and how not to mesh it up
  The ULTIMATE Guide To Data Lineage
 New Feature Recap: Data Lakehouse Support, Anomalous Row Distribution Monitors, and More!

Jon So
Head of Product Marketing at Monte Carlo.
Our biggest priority at Monte Carlo is to make the lives of our customers easier by reducing data downtime and helping them accelerate the adoption of reliable data at their companies.
As part of this mission, Monte Carlo’s product, engineering, design, and data science teams are constantly releasing new product functionalities and features to improve the user experience and reduce time to detection, resolution, and prevention of broken data pipelines.
One key input into these releases was our recent 2022 State of Data Quality survey, which surveyed over 300 data professionals to find:
- Data professionals are spending 40% of their time evaluating or checking data quality.
- 75% of respondents reporting that it takes four or more hours to detect a data quality incident.
- Nearly 50% said it takes an average of nine hours to resolve the issue once identified.
- To make matters more challenging, 58% said the total number of incidents has increased somewhat or greatly over the past year.
Paired with the conversations we’ve had with hundreds of data teams and trends that are shaping the data infrastructure landscape, these survey findings gave us a strong signal that the detection and resolution of data issues continues to be a major time and resource drain on data teams.
Specifically, our major product investments in Q2 fell into three key themes:
- Extend end-to-end data observability to data lakehouses
- Enable more scalable incident detection
- Find root causes—even faster
Let’s dive into each one.
Extend end-to-end data observability to data lakehouses
As data teams and organizations continue to adopt cloud data lakes like Databricks—which recently announced they’ve surpassed $1 billion in annualized revenue—there has been an increasing demand for solutions to ensure data quality in these environments built to store vast amounts of unstructured and semi-structured data.
As a result, vendors like Databricks have moved toward allowing users to add more structure to their data via offerings like Delta Lake and Unity Catalog. These features combine the best of both data lakes and data warehouses into a new type of data store: the data lakehouse.
To help organizations that have deployed Databricks Delta Lake ensure data quality, we announced new integrations with Delta Lake and Unity Catalog over the summer. With these integrations, data teams can extend end-to-end data observability to their data lakehouse to ensure high-quality and trustworthy data to power data science, machine learning, and big data analytics projects and workloads.
An example of an incident where an exceptionally high volume of data (1.9GBs) was added to a Delta table, when the typical update is less than or equal to 80.2MBs as profiled by Monte Carlo’s machine learning Volume (size diff) monitor.
We’re super excited about these new integrations, and we’re thrilled that data teams are too.
“Monte Carlo’s end-to-end lineage helps the team draw these connections between critical data tables and the Looker reports, dashboards, and KPIs the company relies on to make business decisions,” said Satish Rane, Head of Data Engineering, ThredUp. “I’m excited to leverage Monte Carlo’s data observability for our Databricks environment.”
Interested in deploying data observability for your Delta Lake? Check out the docs to learn more.
Enable more scalable incident detection
One of our goals at Monte Carlo is to help data teams detect bad data at scale to ensure your team is the first to know when dashboards break or data goes bad. To accomplish this, we are continuously working to do two things:
- Ensure that our automated machine learning-powered monitors have high precision and recall to detect and alert on the incidents that impact your business.
- Build rule-based monitors that are easily configured and deployed on your organization’s most critical fields and tables for more refined anomaly detection.
To ensure our machine learning powered monitors have high precision and recall, our data science and engineering teams shipped three improvements in Q2:
- Improved learning patterns that extend Freshness and Volume monitors lookback periods to five weeks to capture monthly trends.
- Increased detection accuracy with support for unique table profiles, such as better handling of weekend update patterns and multi-modal intra-week update patterns.
- In-app and Slack feedback for incidents, which are used to train machine learning monitors that detect table and field-level anomalies.
During Q2, the team also shipped improvements to allow teams to more easily deploy and configure Volume SLI monitors. These are rule-based monitors that supplement machine learning powered volume monitors for the critical tables your team knows must have certain size updates.
They also shipped improvements for SQL Rule monitors, which use custom rules to check for anomalies specific to your business, such as setting thresholds for null values, referential integrity, and empty strings. See the latest capabilities in action in the video below!
Monte Carlo’s Product Team showcases improvements and enhancements to rule-based monitors to detect field- and table-level incidents.
Find root cause—even faster
At Monte Carlo, we don’t want to just sound the alarm when a data incident occurs, we actually want to equip your team to resolve it as quickly as possible.
Over the past few months, we made significant investments to automate more of the root cause analysis (RCA) process so your data engineering team can focus on building value-added data products versus spending a workday—or more—fixing each incident.
To properly conduct root cause analysis, you need data observability at every level of your stack. So, in Q2, we released new capabilities to support each level:
- Field-level: Root cause analysis often starts with analyzing the data itself. Data teams can now utilize two new root cause analysis tools:
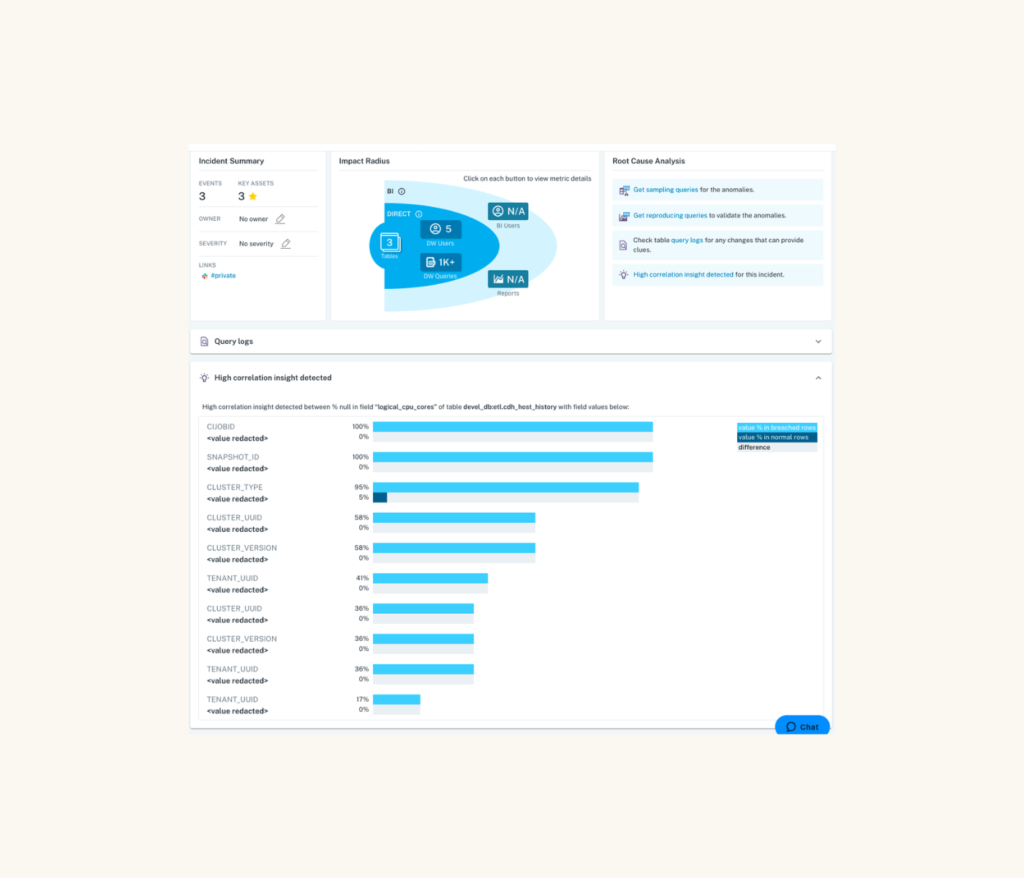
- Correlation analysis for metric anomalies: For % null, zero and negative-value rate anomalies, Monte Carlo automatically identifies co-related values in other fields to shed light on the root cause and shorten time-to-resolution. Here’s an example:
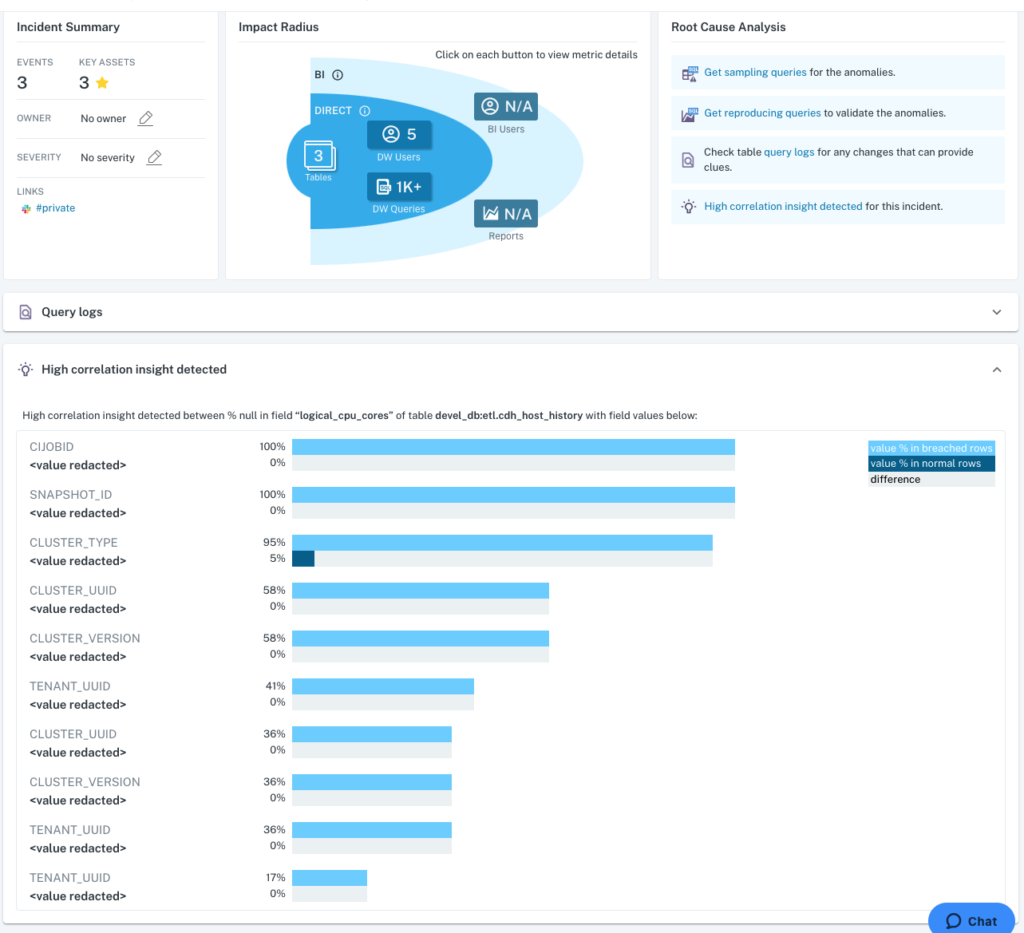
In this example, a machine learning monitor was deployed on a critical field (logical_cpu_cores), which automatically learned to expect 0% nulls. The monitor was breached, and Monte Carlo automatically identified field values that were only present in the breached rows, and we can immediately see that the same values for several fields (e.g., CIJOBID, SNAPSHOT_ID, CLUSTER_TYPE) all returned the same values in the rows that breached the rule. This insight would then lead a data engineer to investigate if these rows were generated by the same SNAPSHOT_ID.
- Anomalous row distribution: This new root cause analysis tool provides data teams with immediate insight into the composition of anomalous rows, leading to easier and faster identification and resolution of the underlying root cause. Here’s a sample incident:
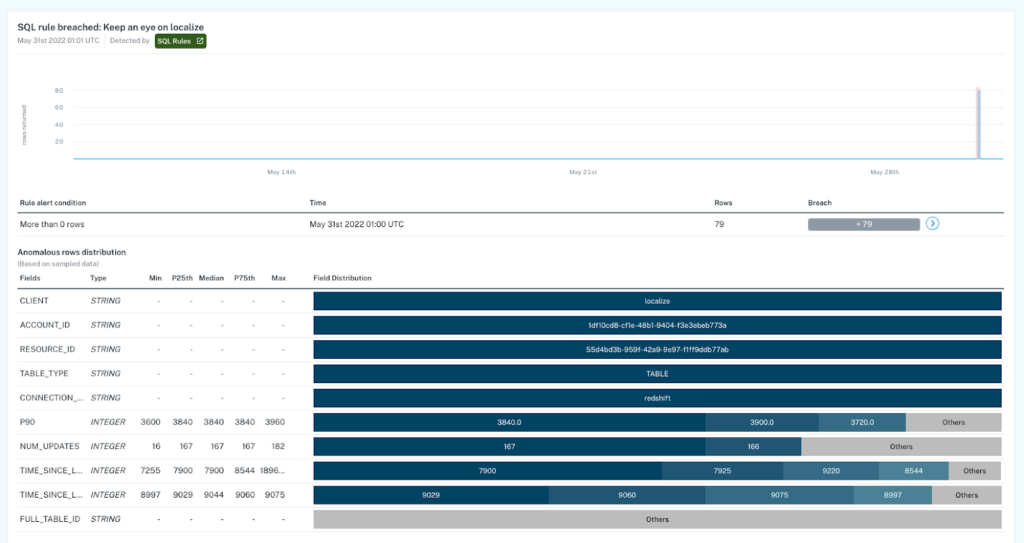
In this incident, 79 rows contained values that breached a rules-based monitor deployed on a critical field. To begin conducting root cause, a data engineer can immediately see that the top five fields had the same values for every row that breached the rule, indicating that the ACCOUNT_ID or RESOURCE_ID may have generated the “localize” value in CLIENT.
- Table-level: When the size of a table drastically changes, such as an unusual increase in rows, one common culprit could be the result of an unintended write to the table. To help teams identify when this is the case, Monte Carlo now identifies and visualizes when a query is associated with a table size anomaly..
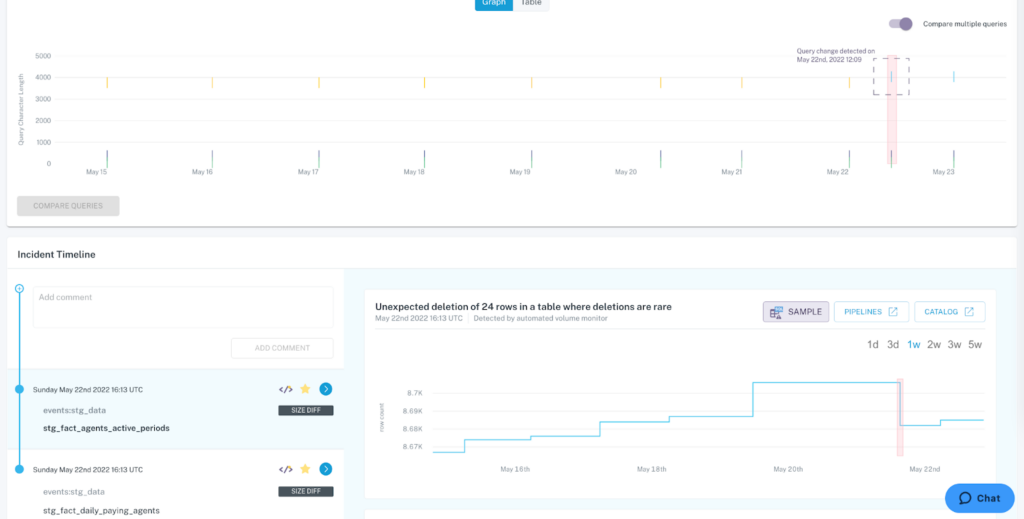
Data teams can now quickly identify when a change in table size was the result of a query.
- EDW-level (e.g., warehouse, lakehouse, or lake): while root cause may start at the field- or table-level for some incidents, others will require an assessment of upstream sources. As the only data observability platform that provides data teams with automated table- and field-level lineage, we’ve now made it easier to identify upstream source tables that may have created a data anomaly by indicating incidents or rule-breaches in upstream tables.
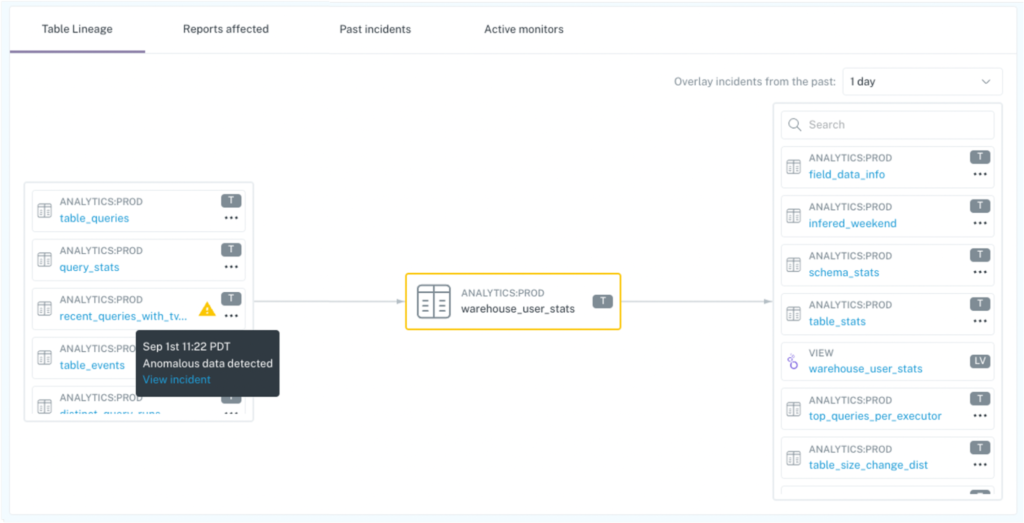
With automated lineage, data teams can determine if an upstream source table generated anomalous data. In this example, a distribution anomaly occurred in account_id. A data engineer can immediately see that an upstream source table lineages_nodes_all also had an incident (as annotated by the yellow icon) in the last 70 days, which should be investigated next for root cause.
- Stack-level: Data teams using Monte Carlo can now quickly determine if an incident resulted from dbt errors, warnings, or failures with model runs and tests. Teams can also immediately determine if the incident is a result of an Airflow DAG error. Take a look at the dbt (Cloud and Core) and Airflow integration docs to learn more.
One additional bonus for data teams with dbt: model errors and failures as Monte Carlo incidents! In an effort to help those data teams centralize incident resolution in Monte Carlo, teams can now opt-in to have dbt errors appear as incidents with Monte Carlo. This new capability enables teams to investigate dbt model errors and failures and leverage the tools available for other incident types. Ready to turn this on for your team? Learn how in the docs.
And that’s a wrap (for Q2, at least).
We’re excited about these new data observability capabilities and hope that you and your team get to integrate them in your workflows soon. Onwards!
Interested in learning more about how data teams at Fox, GitLab, Vimeo, and other leading companies are leveraging Monte Carlo to improve data quality at scale? Reach out to Jon and the rest of the Monte Carlo team!
Read more posts.