Product demo.
  What is data observability?
  What is a data mesh--and how not to mesh it up
  The ULTIMATE Guide To Data Lineage
 Building An “Amazon.com” For Your Data Products

Barr Moses
CEO and Co-founder, Monte Carlo. Proponent of data reliability and action movies.
We collaborated and published an article with our friends over at ThoughtWorks and wanted to highlight it for you here as well. Enjoy!
Have you ever come across an internal data product and side-eyed it like it’s your kid’s prom date? While it seems like it fits the requirements, you don’t quite trust it — who knows where the data in this shifty table has been. Will it be reliable and safe even after you turn your focus elsewhere? Will the schema stay true?
This project is your baby; you just can’t risk it. So, just to be safe you take the extra time to recreate the dataset.
Data products and trustworthiness
According to Zhamak Dehgahi, data products should be discoverable, addressable, trustworthy, self-describing, interoperable and secure. In our experience, most data products only support one or two use cases. That’s a lost opportunity experienced by too many data teams, especially those with decentralized organizational structures or implementing data mesh.

In the focus on building data trust with business stakeholders, it’s easy to lose sight of the importance of also building trust with data teams across different domains. However, a data product must be trustworthy if it’s to encourage the reuse of data products. This is what ultimately separates data mesh from data silo.
The data product is trustworthy if data consumers are confident in the accuracy and reliability of the data. Data products should be transparent with regards to information quality metrics and performance promises.
Creating a central marketplace or catalog of internal data products is a great first step to raising awareness, but more is needed to convince skeptical data consumers to actually start using them.
For this, we can take a page out of Amazon.com’s playbook. Amazon provides an incredible amount of detail to help consumers purchase products from unknown third-parties. Take the example of something as simple as a wrench:
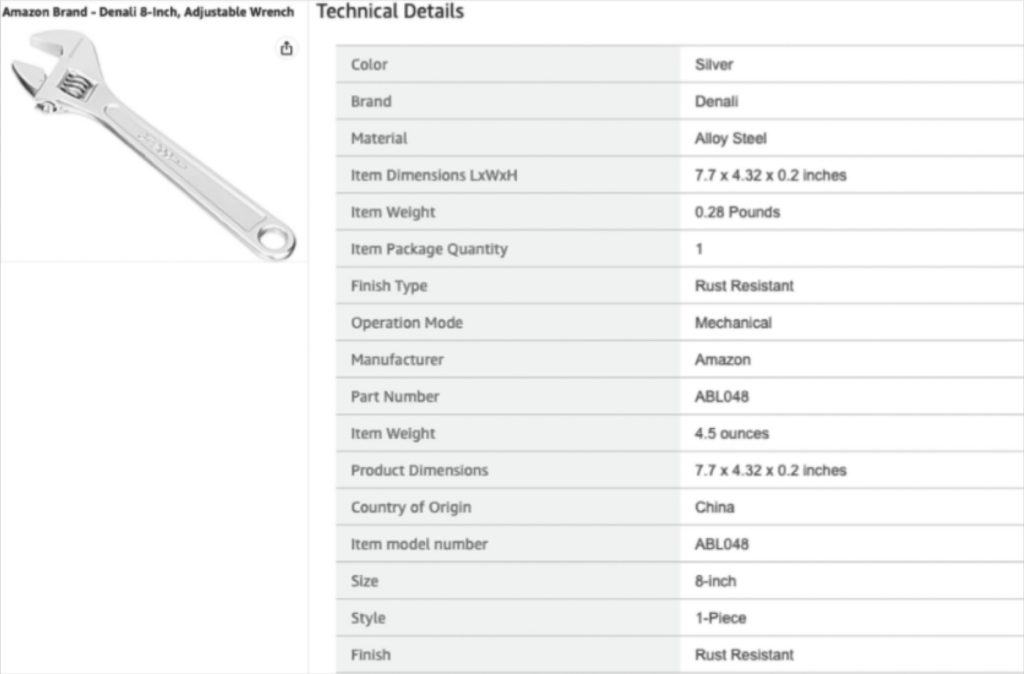
It’s not just a wrench — it’s an adjustable Denali, 7.7 inch, 4.4 ounce, rust resistant steel, adjustable wrench for repairs, maintenance and general use, covered by a limited lifetime warranty. Oh, and here are similar products and reviews from users like yourself.
Data teams and data product owners need to be as capable of marketing data products as they are at building them. Otherwise, you’re not going to see the adoption levels that justify the value of your data initiative.
The central “store” for your data products needs to include not just information about the data, but information about the context of how it can be used. In other words, it needs to provide metrics such as uptime or data freshness; these are commonly referred to as service level objectives (SLO)
Thoughtworks has helped create one of the more advanced deployments of Monte Carlo — a data observability platform that monitors the health and quality of data — within a data mesh implementation.
In this post, we will explore the process of implementation and go further by exploring what else is possible.
Table of Contents
Where to start: Identifying reusable data products
The two best ways to fail at creating valuable, reusable data products are to develop them without any sense of who they are for and to make them more complicated than they need to be.
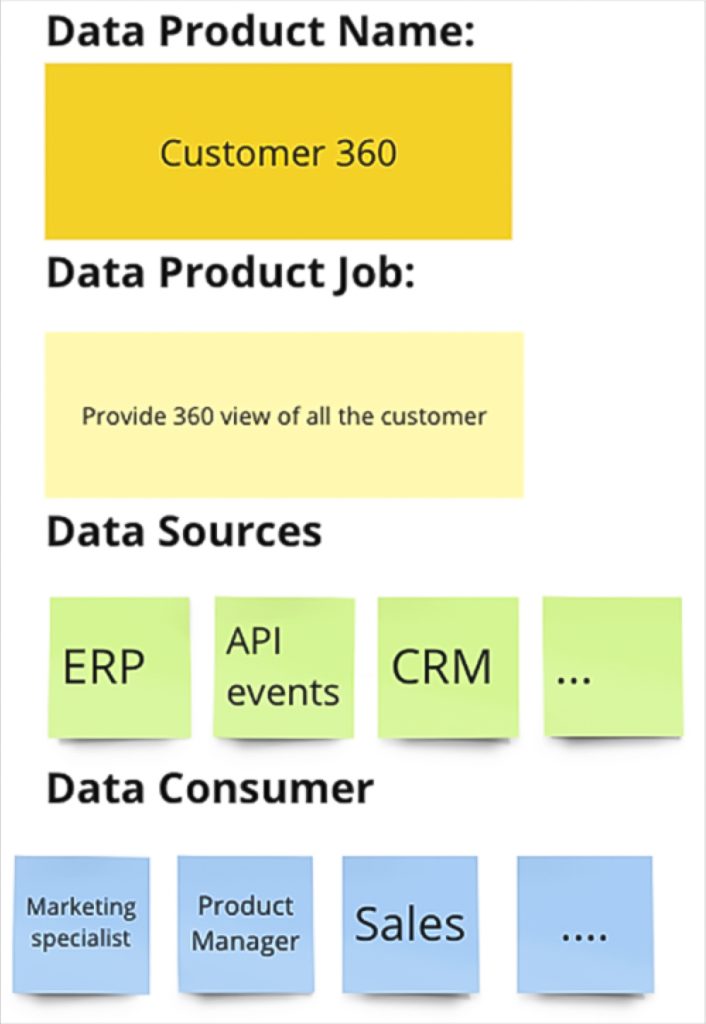
One of the best ways to succeed is by involving business and product leadership and identifying the most valuable and shared use cases. Thoughtworks, for example, often identifies potential data products by working backwards from the use case using the Jobs to be done (JTBD) framework created by Clayton Christensen.

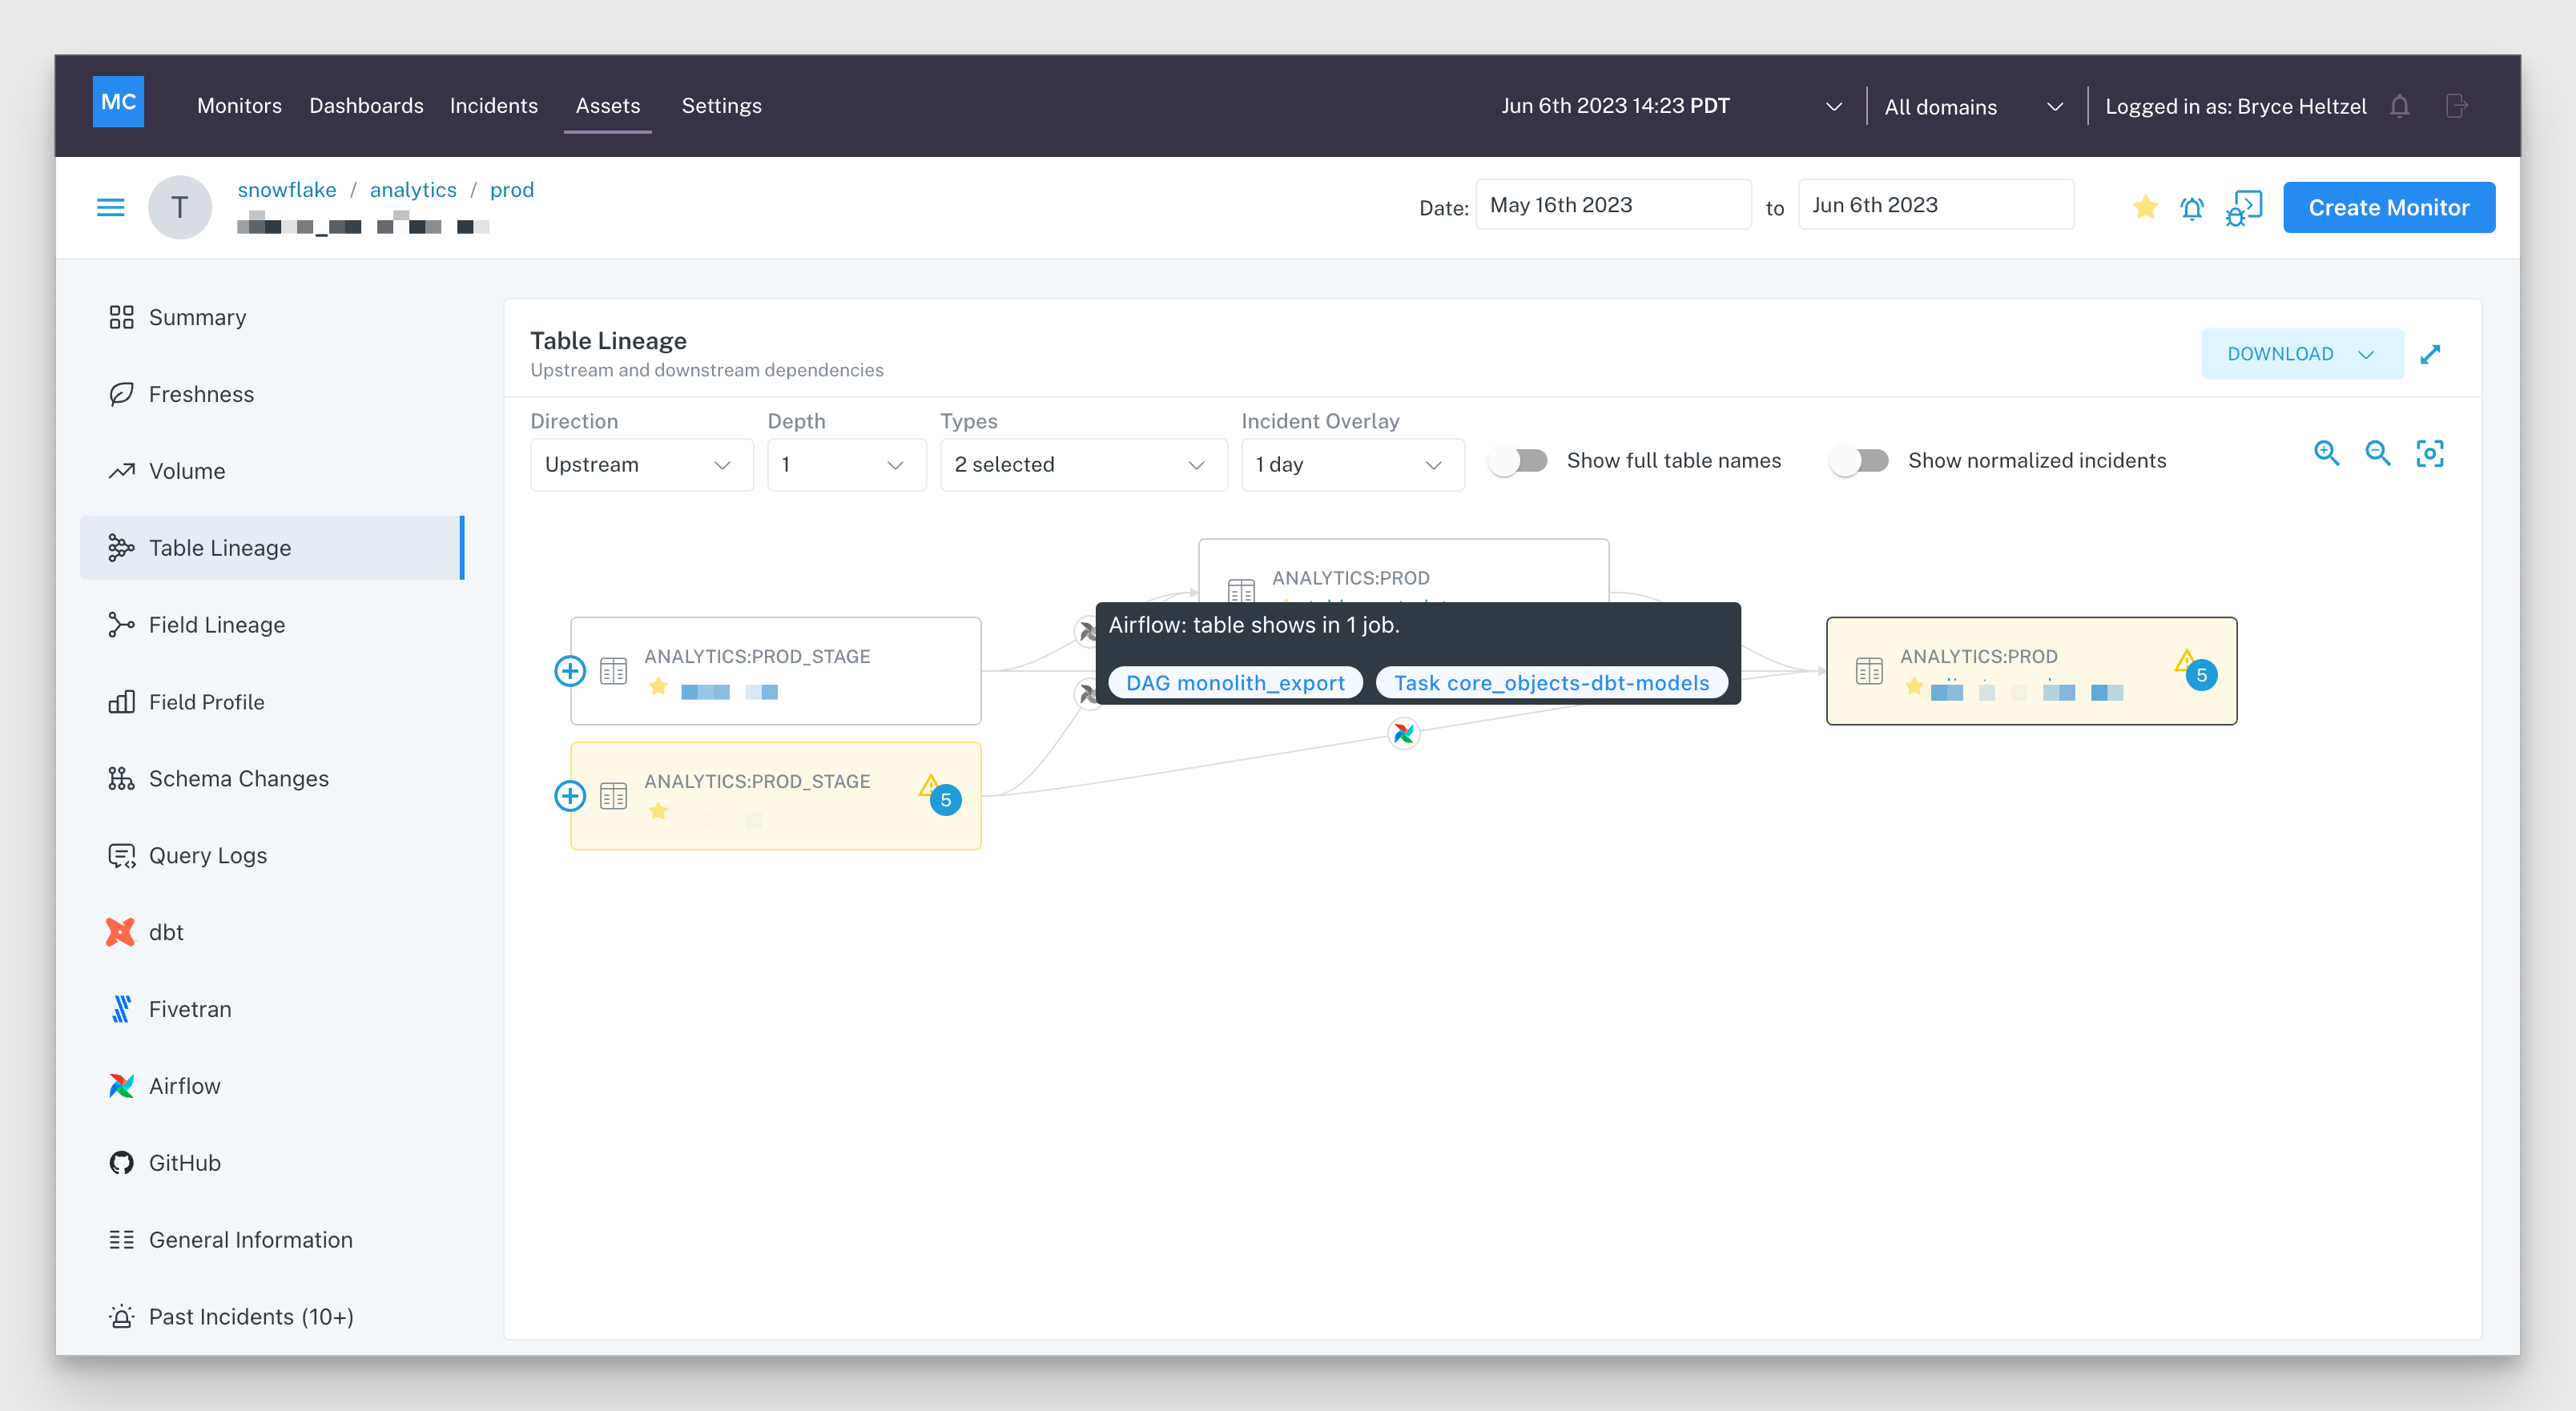
Another strategy is to evaluate the data lineage within your current environment. It’s likely that your tables will follow some sort of Pareto distribution where 20% will have 80% of the queries run against them (or power 80% of the most-visited dashboards).
For example, if the table customer_accounts is constantly being queried by marketing, finance, support and other domains, that can be taken as a signal that building a data product that consolidates the necessary information into a full 360 view may have shared utility.
Second step: Creating data product SLOs
A key part of data product thinking is keeping the consumers at the center and considering what provides the most value for them. The only way to ensure we are delivering high-quality data products is to identify those consumers, understand their requirements and codify their expectations within a SLO/SLI framework.
You can think of SLOs as measures that remove uncertainty surrounding the data and serve as a primary way to define trustworthiness for its consumers.
As explained in Zhamak’s Data Mesh book, in contrast to previous approaches to data management, data mesh introduces a fundamental shift in that the owners of data products must communicate and guarantee an acceptable level of quality and trust‐worthiness as it is an important characteristic of the data product. This means cleansing and running automated data integrity tests or data quality monitors at the point the data products are created.
If SLOs are breached, the data product team must be notified so they can take remediation measures. Like a typical business contract, data product SLOs will likely evolve over time based on changing circumstances.
Thoughtworks uses a discovery exercise during its data mesh acceleration workshop on product usage patterns. This helps teams collectively brainstorm and understand usage, expectations, trade-offs and business impact. The outcomes of the exercise are then used to determine the various SLOs that need to be set for individual products.

Third step: Implementing the SLOs
During the implementation phase of the data product, the data product team will start by defining the metrics (SLIs) used to measure the SLO.
One common SLI for data products is freshness. In the example from the previous section, the exercise may reveal the marketing team relies heavily on a particular dashboard that supports the monitoring of daily campaign and purchasing behaviors, which means the data needs to be updated every day.
The customer service team, on the other hand, may require hourly updates to better engage with customers in real time. In this scenario, it is almost certainly more efficient to build the data product to be updated hourly to serve both consumer groups rather than build two different data products. The marketing team isn’t going to complain about having data that is more frequently updated than they requested after all!
SLIs are typically expressed as a percentage over a period of time. In the example presented earlier, 99% freshness over an hourly interval is the SLI in place for the Customer 360 data product.
In our example, the team has decided to track data freshness checks based on the processing timestamp attribute present in the dataset that is served by the data product: processing_timestamp. To do this, they start by defining a monitor as code that will become part of the data product which will support the implementation of the freshness SLO:
namespace: customer-domain
montecarlo:
  freshness:
    - description: Customer 360 Data Product Freshness Monitor
      name:  Freshness - Customer 360 Data Product
      table: analytics:prod.customer_360_dp.customers
      freshness_threshold: 240
      schedule:
        type: fixed
        interval_minutes: 240
        start_time: "2022-09-15T01:00:00"
The data team can then automate the deployment of this monitor via the CI/CD pipeline using the Monte Carlo CLI:
montecarlo monitors apply --namespace customer-domain
This ensures the monitor to support the SLO is implemented and deployed every time there is a change via the CI/CD pipeline. The monitor as code functionality improves the experience of the data product developer in maintaining and deploying these monitors at scale using version control.
The stakeholder exercise may also reveal that the Customer 360 data product should not contain deleted rows in the final table as customers will be marked as active or inactive rather than removed entirely. To ensure this, a custom volume SLI can be set to monitor and ensure the data product follows this behavior.
Finally, data product users need to be alerted whenever any changes are made to the schema of any tables within or upstream of the data product. This is because such changes could break processes downstream; there could be new fields that can enable new use cases. This can be covered by an automated schema monitor which sends alerts via the appropriate communication channel.
Going beyond basic SLOs
So far we have covered three basic dimensions that can be used as SLOs. There are several other dimensions improving data product trust such as accuracy and availability. These and others are described in the Implementing Service Level Objectives book.
More advanced SLOs can better validate data product quality and encourage wider use throughout the organization.
For example, let’s imagine the data in our Customer 360 data product is not complete. Perhaps our stakeholder exercise revealed the channel and region where the customer buys the product is important for the marketing team’s digital advertising decisions while the customer service team cares deeply that every customer has a profile in the system.
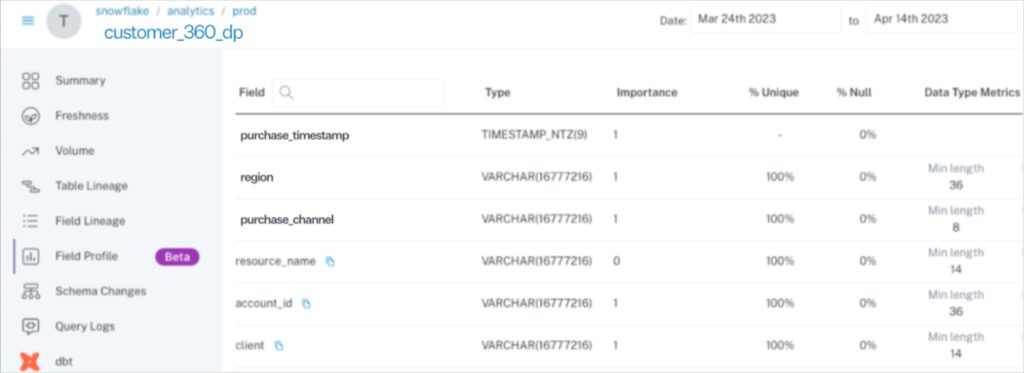
We could use field health monitors on relevant fields within the data product such as region and purchase_channel to surface the number of anomalies over a certain time period on the attributes the marketing team needs to segment users. If any of these fields experience anomalous NULL rates or values outside the typical distribution, remediations can be launched to ensure compliance with stated SLOs. Similarly, we could place field health monitors on the account_id field to ensure it is never NULL so that the data product performs to the customer service team’s standards.
Deploying field health monitors has the added benefit of profiling the data, which can provide additional context that helps encourage adoption for those not as familiar with the data or the data product.
What the field profile feature looks like:
Let’s look at another possible SLO related to data quality. Consider a purchase order data product tracking the purchases/transactions made by the customer. This data product is used as a source for Customer 360 data product to understand the purchase patterns of the customer based on a purchase_timestamp.
Using a dimension distribution monitor, we can identify a potential anomaly when an active customer does not have any purchases made in the recent timeline, highlighting the lack of data trust/quality on the upstream purchase order data product.
Other indicators to build data trust
At this point, we have reassured any potential data product users that there are no freshness, volume, schema, or data quality issues that will prevent them from benefiting from its use. But what other information can we surface that will speak to the data product’s trustworthiness?
One idea is to go beyond describing the data itself to surfacing information on its level of support and consumption. To harken back to our Denali wrench example, the Amazon.com page doesn’t just describe the product itself, it also includes information on the lifetime warranty. Netflix doesn’t just tell its viewers the plot of the movie, it also has a list of the top ten most popular.
The data product equivalents of this are:
- Total tests or custom monitors: If there are more dbt tests across a pipeline or it has more Monte Carlo custom monitors set, this indicates more granular support and reliability in depth.
- Coverage percentage: Data products typically involve a series of complex, interdependent operations upstream. Data moves and is transformed from table to table. Understanding that a data product has basic data monitoring coverage across its data lineage helps further build trust.
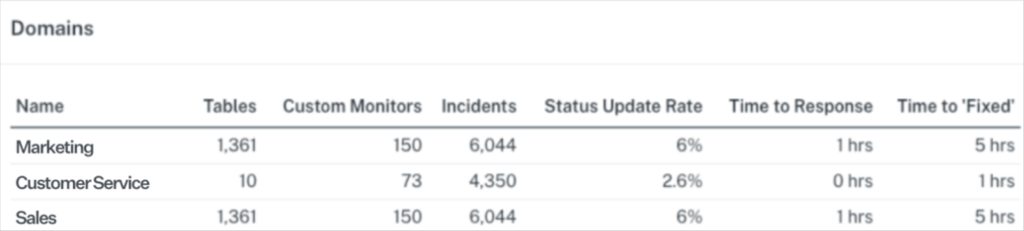
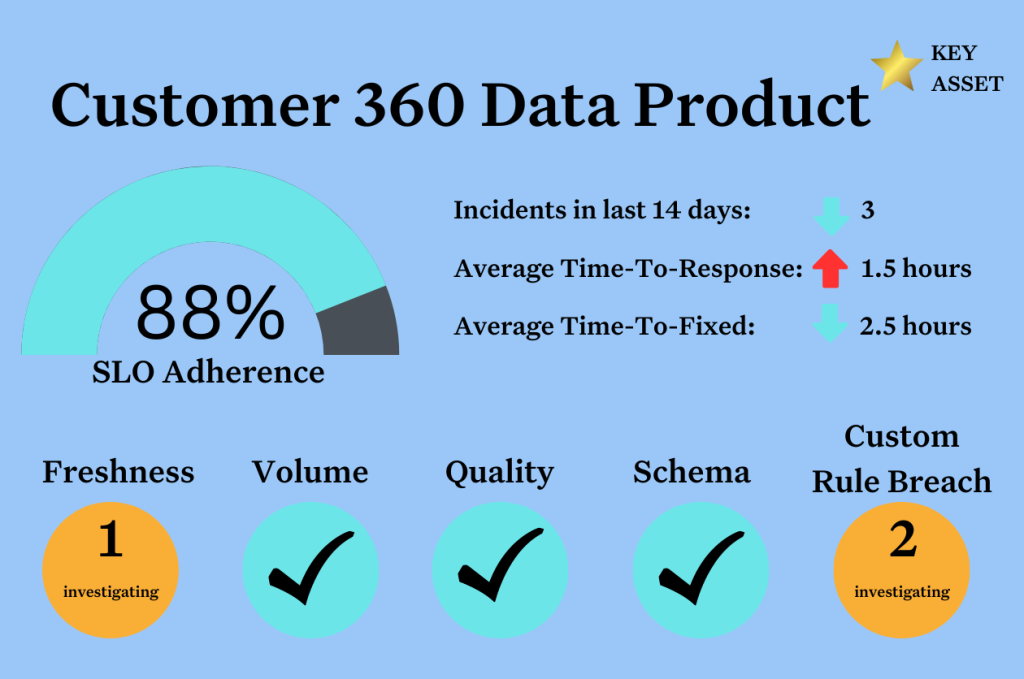
- Average time to response/fixed: The overview above, currently at the domain level, highlights important metrics to consider when monitoring the health of the data products. Similar to the stability metrics in the DORA 4 key metrics framework, the metrics shown in this overview, “Time to response” and “Time to Fixed,” indicate how long it takes a data product team to spot and recover from any type of incident that could lead to breaching the SLOs. Faster response and fix times indicate data product stability and highlights the maturity of the supporting data product teams thus increasing the trustworthiness over time.
- Key asset score: An all too common story is when a member of the data team leverages a seemingly ideal table or data product as part of their task, only later to find out it’s been deprecated or an older version. Monte Carlo’s Key Asset Score, calculated by the reads and writes and the downstream consumption on each dataset part of the data product, can give data product users (and re-users) confidence the asset is safe to use. It can also be helpful for data product owners to measure their success, in a data mesh context, based on the satisfaction and growth of their data product consumers.
Fourth step: Monitoring and visualizing data product SLO health
The data product teams select what SLOs their data products guarantee, and ultimately they are responsible for the satisfaction of their data products’ consumers. To succeed on this, they need the right tools to monitor and track the SLOs over time.
Monte Carlo’s notification mechanism enables this by notifying the data product teams on any SLO breach incident. To improve the developer experience, these notifications can also be defined as code in the latest version of Monte Carlo and be included as part of the CI/CD pipeline.
Monte Carlo also provides functionality to extract some or all of this monitoring metadata via APIs to publish them in catalogs like Collibra, dataworld, or Atlan. This is critical for making data products discoverable. It’s also where all of the work your team has done to create and automatically monitor SLOs and SLIs comes together and is put on display.
Data product owners and data platform teams can leverage these APIs to visualize the health of the data products in the marketplace via custom integrations similar to the solution shared in a past webinar.
 Check and show service levels Delivering data product health information as part of the user experience")
Finally, if you are using dbt for modeling and transforming for your data, Monte Carlo offers a dbt integration that automates the incident creation on every dbt test failure. This provides a holistic view of incidents created due to data quality tests failing for a data served by the data product, provides our data quality health of the data product and also eases debugging. By enabling this integration, the team can leverage Monte Carlo’s notification channel to also receive alerts on data quality issues.
To implement this, the data product team can run the dbt data quality test as part of their data pipeline and upload the results to Monte Carlo with a simple CLI command.
> dbt test
> montecarlo import dbt-run
        --manifest ./target/manifest.json
        --run-results ./target/run_results.json
        --project-name customer-360-data-product
Putting it all together
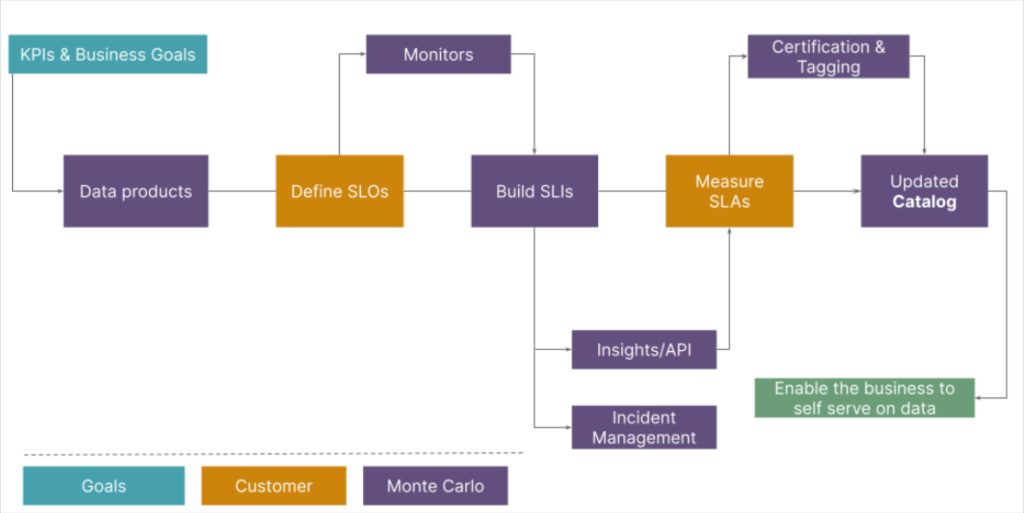
The data mesh principles, especially the data as a product concept can create tremendous business value.
Defining SLOs will help build reliable data products that fit business user needs and surfacing their value will create the level of data trust required for data driven organizations to thrive.
Ultimately, the more product context you provide for data consumers and team members across the organization, the more efficiencies and value you will be able to derive from a “build once use many times” approach. Good luck!
Interested in seeing how data observability can take your data product strategy to the next level? Talk to us by scheduling a time in the form below.
Our promise: we will show you the product.
Appendix:
Data Mesh Accelerated workshop formulated by Paulo Caroli as explained in this article https://martinfowler.com/articles/data-mesh-accelerate-workshop.html
helps teams and organizations accelerate their Data Mesh transformation, by understanding their current state and exploring what the next steps will look like.
Read more posts.