Product demo.
  What is data observability?
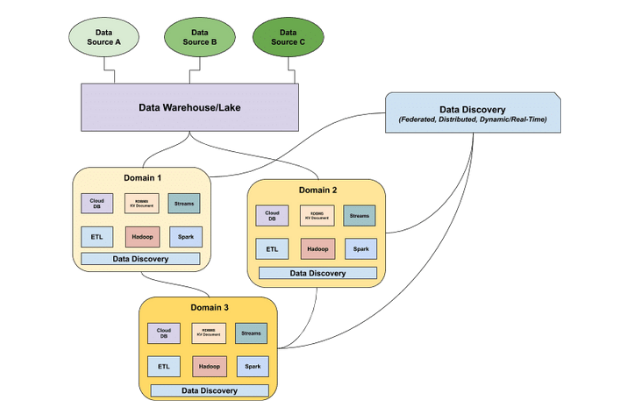
  What is a data mesh--and how not to mesh it up
  The ULTIMATE Guide To Data Lineage
 Just Launched: Data Explorer

Michael Segner
Michael writes about data engineering, data quality, and data teams.

Will Robins
Will Robins is a member of the founding team at Monte Carlo.
A common data quality workflow is to profile a table and visualize key metrics to inform what tests should be placed on what fields and with what thresholds.
For example, if the column US_state only has 50 values and is never NULL, you may want to write a test that alerts you if those conditions suddenly change.
One of the advantages of data observability is the need for this type of workflow is greatly reduced. Machine learning monitors are much better at setting and adjusting thresholds. They also can scale coverage efficiently to catch issues that wouldn’t be caught even if you asked your team to do nothing but write tests all day.

But that doesn’t mean there are never situations where data teams need to explore and profile metrics and how they have changed over time. Like our opening example illustrated, there are times where you may want to set absolute thresholds using very specific logic.
Another common scenario when profiling data is helpful is in the course of triaging a data incident. It’s not often you hear from your data consumers that, “I’ve noticed the standard deviation of this aggregated metric has been skewing downward, which I suspect is a result of an increase in NULL values upstream.” A much more common refrain is, “The data looks weird.”
Data analysts and engineers on the front-lines now need to determine if the data indeed “looks weird.” and if it’s a technical issue that needs to be escalated. After all, while the consumer may not see any data in their dashboard for February, it could be something as simple as the user not selecting the right dashboard filters or it could be something as serious as a busted data pipeline.
This process can be tedious and require writing multiple SQL queries to slice and dice different segments.
Table of Contents
Introducing Data Explorer
We are thrilled to be introducing Data Explorer, an interactive approach to profiling your data and investigating data quality issues. Here’s how it works.
When you are reviewing an asset in Monte Carlo you can navigate to Data Explorer in the secondary top navigation bar:
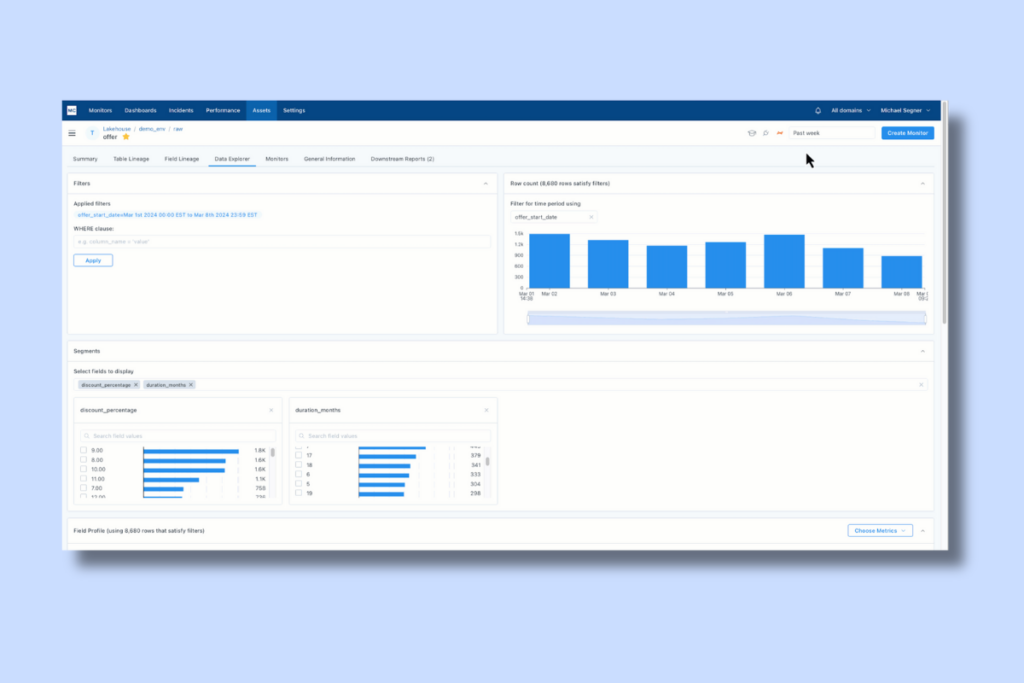
Within seconds the profile is populated within the UI including row count growth over time and distributions of key fields in the segments you would like to explore. Underneath that you will find data profile metrics.
What makes Data Explorer particularly useful is that it is fully interactive. Users can point and click to hone in on certain time periods, segments, and metrics, all without writing a single line of SQL. The data profiling metrics update instantly and automatically.
In the GIF below, a user is drilling into the last three days of data on the offers table. Then they are reviewing how discount percentage changes with offer duration by easily selecting the 2 month and 21 month duration segments.
The Roadmap
Data Explorer is currently in beta with a select set of Monte Carlo customers. We plan to explore additional features such as comparing two distinct windows of time or segments to better highlight the deltas in key metrics. As always, development will be guided by our customers and their needs.
Interested in how data profiling and data observability can help you deliver more reliable data? Talk to us!
Our promise: we will show you the product.
Read more posts.