Product demo.
  What is data observability?
  What is a data mesh--and how not to mesh it up
  The ULTIMATE Guide To Data Lineage
 Introducing Monte Carlo’s Data Product Dashboard to Help Organizations Build Trustworthy Data Products

Jesse Miller
Jesse Miller is a product manager at Monte Carlo.
Over the past several years, data products have emerged as a new and impactful framework with which to manage data, tying tables, reports, ML models, and other assets directly to tangible business outcomes.
In order for data and AI products to realize their full potential, however, the data itself must be treated with the same diligence as production-grade software products. This diligence requires that data not only be accessible and performant, but also trustworthy.
To this end, I’m excited to announce Data Product Dashboard, a new dashboard available today in the Monte Carlo data observability platform that gives data teams increased visibility into the health and reliability of tables, training sets, and other assets powering their data and AI products.
What is a data product?
Data products refer to an application or asset–such as key dashboards, large-language models, or software–that delivers information or services to downstream consumers. Examples of data products include an airline’s flight tracking system that combines real-time GPS data, flight manifest tables, and historical arrival and departure information, a customer relationship management platform syncing data across marketing tools, or an AI algorithm that trains disparate financial and investing data from thousands of sources to forecast future stock returns.
One of the biggest hurdles to data product adoption? Data trust. For instance, a 2023 survey of over 200 data engineers conducted by Wakefield Research and Monte Carlo revealed bad data impacted 31% of revenue, which rose from 22% in the previous year’s survey. That same survey also found 74% of respondents – data engineers and other data consumers – reporting that business stakeholders first identified problems with the data most or all of the time.
Data Product Dashboard is the first solution of its kind to help organizations manage and improve the data quality of the tables and assets powering their most critical data applications, and in the process, foster greater trust and collaboration between data teams and their stakeholders.
Building defined, reliable data products at scale with Data Product Dashboard
With the release of Data Product Dashboard, Monte Carlo broadens the conversation around data quality beyond individual tables and zeroes in on the reliability of specific use cases. Customers can now easily identify which data assets feed a particular data product and unify detection and resolution for relevant data incidents in a single view.
Data Product Dashboard focuses on three main areas to help data teams better track and improve data health and reliability for their data products:
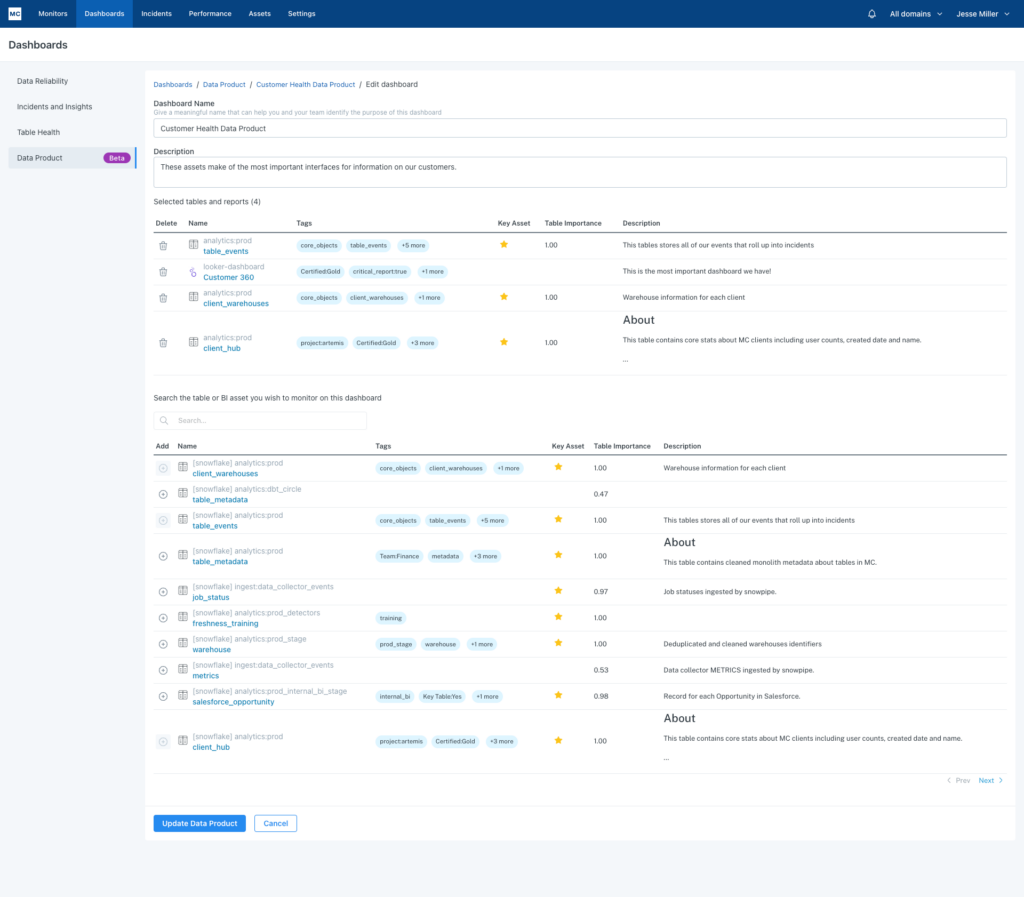
- Define data products. Data Product Dashboard makes it easy to define the scope of specific data products based on the tables, reports, dashboards, and models feeding them. Users can select relevant tables and their associated assets to define specific data products, thereby keeping everyone aligned on data product definitions.
- Track data product health over time. The solution reports on key data health metrics and KPIs over time, including the number of incidents impacting a given data product, incident status and severity, monitor coverage for the tables feeding a given product, and more. This enables teams to create both trust and accountability in the data, tying the data directly to business outcomes, such as customer acquisition and revenue generation.
- Communicate data product reliability to stakeholders. Data Product Dashboard makes it easy to share high-level stats about data product reliability with downstream stakeholders, executives, and others reliant on them to inform their work.
Data Product Dashboard is just one release in a steady stream of recent product launches dedicated to reducing the time to detection and resolution for data downtime, and in the process, driving the adoption of trusted data for businesses worldwide.
Last October, we unveiled Data Reliability Dashboard, which provides a snapshot view of an overall data environment, providing data reliability metrics over time. And in February, we released Table Health Dashboard, a new way for teams to measure and improve the data quality across their most critical tables.
Now, Data Product Dashboard takes our vision for data observability a step further by giving organizations the ability to segment, define, and monitor tables and other upstream assets based on the internal or external data products powering them.
How it works
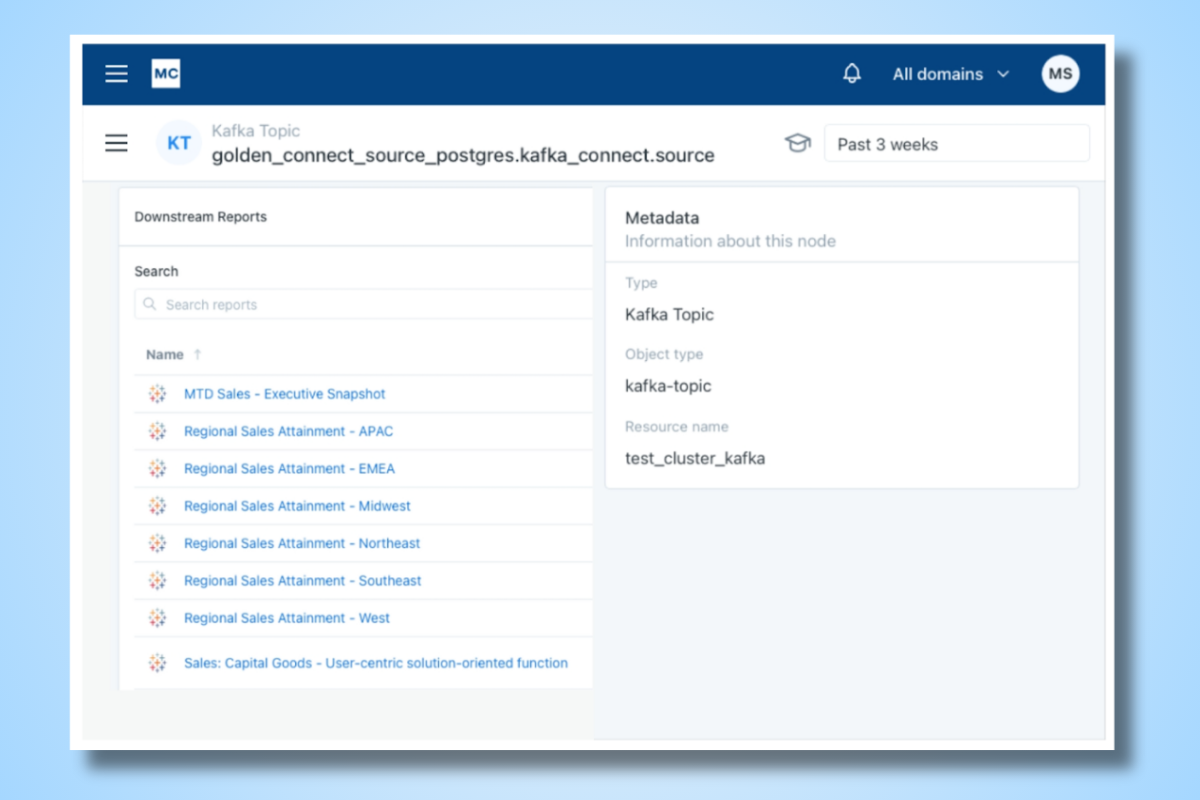
To create a Data Product Dashboard in Monte Carlo, you first define the core assets you want as part of your dashboard.
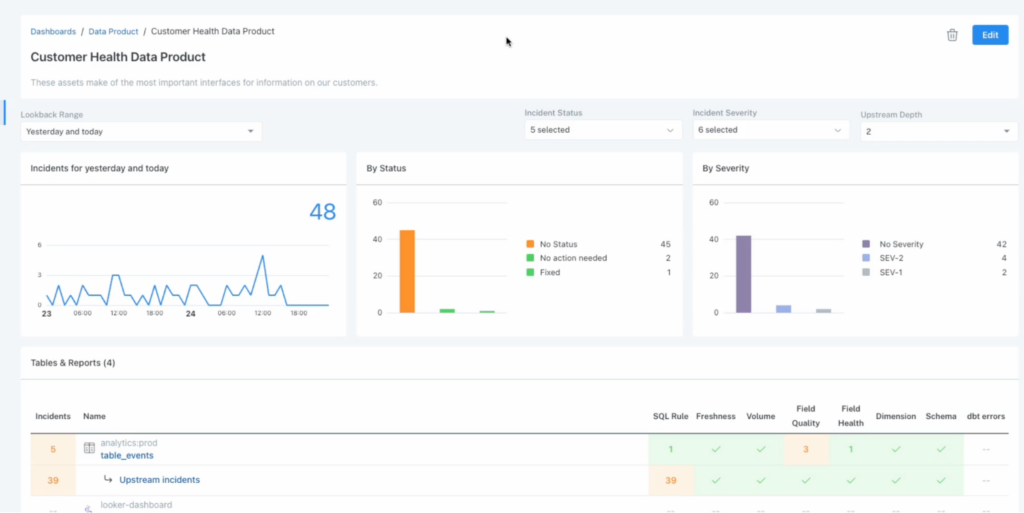
In the example above, our Customer Health Dashboard includes four tables and one Looker report. This is a data product that contains the assets that make up the most important interfaces for collecting information on customer satisfaction and usage.
Once you create your data product, your new Data Product Dashboard surfaces information about each of these assets, including related incidents, filterable by status and severity.

Using lineage, you can also see upstream of these core assets and everything related to them in one place for easy root cause and impact analysis.
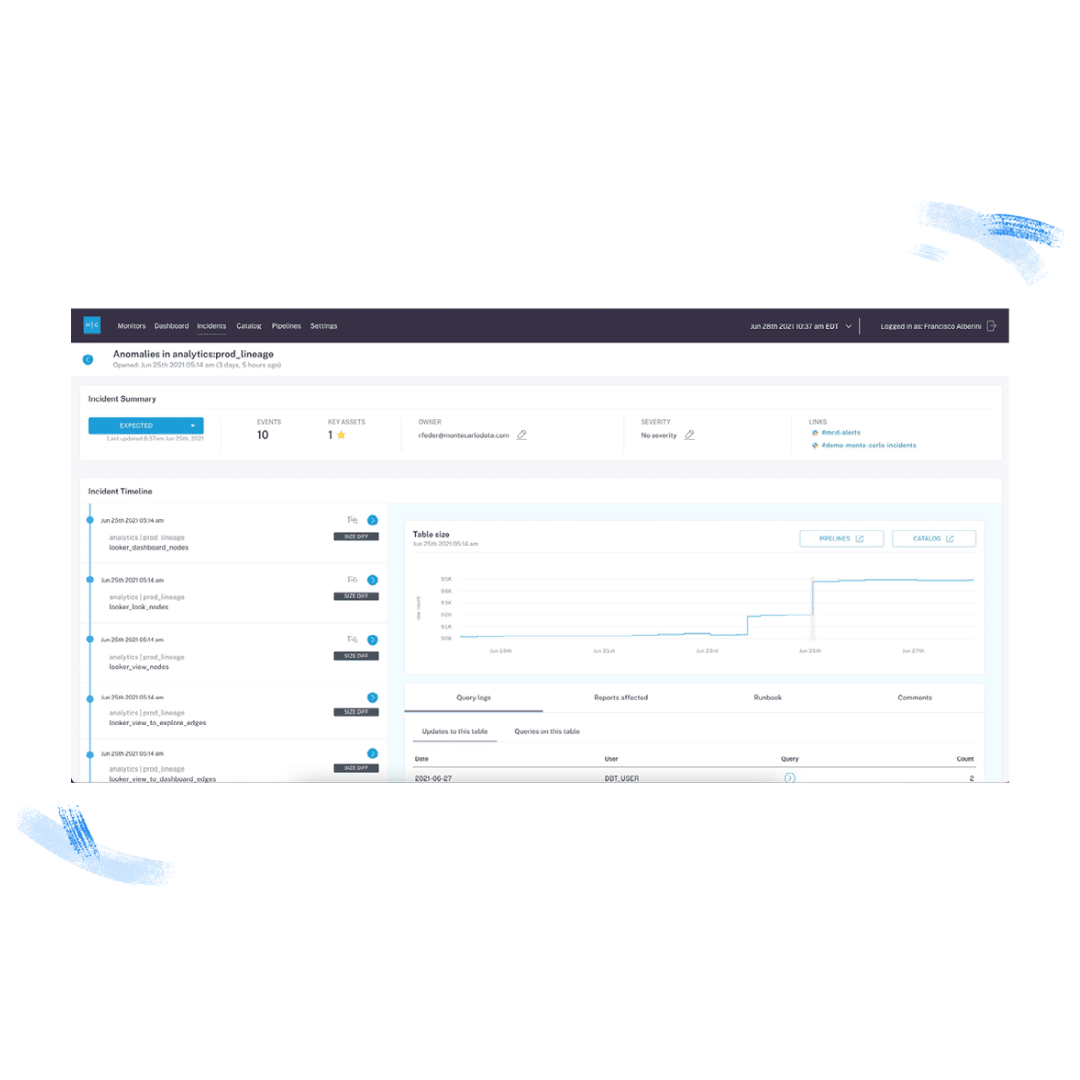
You can also quickly drill into each of the incidents and see details, triage, and get a good sense of the overall health of the data product.
We walk through how to use Data Product Dashboard, below:
Visit our docs to learn more.
The good news? We’re just getting started! Interested in learning more about how Data Product Dashboard and data observability can help your company achieve data trust at scale?
Reach out to Jesse and the Monte Carlo team.
Our promise: we will show you the product.
Read more posts.