Product demo.
  What is data observability?
  What is a data mesh--and how not to mesh it up
  The ULTIMATE Guide To Data Lineage
 Monte Carlo Brings Data Observability to Microsoft Azure Synapse and Microsoft Fabric

Lior Gavish
CTO and Co-founder, Monte Carlo. Programming wizard and lover of cats.

C.J. Jameson
C.J. is an Engineering Manager at Monte Carlo.
Microsoft is one of the world’s largest providers of relational database solutions, many of which are central components within the modern data stack.
Data teams leverage Microsoft Azure Synapse Analytics, and specifically the data warehousing features within Dedicated SQL pools, as a structured data store and query engine to power their analytics and data products at scale.
Data teams are also increasingly turning to a lakehouse architecture with delta tables serving as the foundation. This popular open-source table format can be leveraged within Azure Data Lake Storage Gen 2, Azure Databricks, and Microsoft Fabric OneLake.
However, legacy data quality approaches such as unit testing cannot scale with the volume, velocity, and variety of data being stored and processed within these powerful cloud-native data systems.
It’s just not possible to anticipate all the ways data can break with manually defined alert criteria nor can these tests be efficiently applied across every field, column, segment, and table.
Monte Carlo–the top ranked data observability solution used by hundreds of data teams including JetBlue, Fox, and Vimeo–is bringing data observability to the Microsoft data ecosystem to help data teams more efficiently and effectively solve for data reliability.
Monte Carlo leverages machine learning monitors to automatically detect data anomalies and broken pipelines. Monte Carlo also monitors logs and metadata across data systems to provide the context teams need for accelerated root cause analysis. These pillars of data observability include:
- Freshness- Was the table updated when we expected it to be?
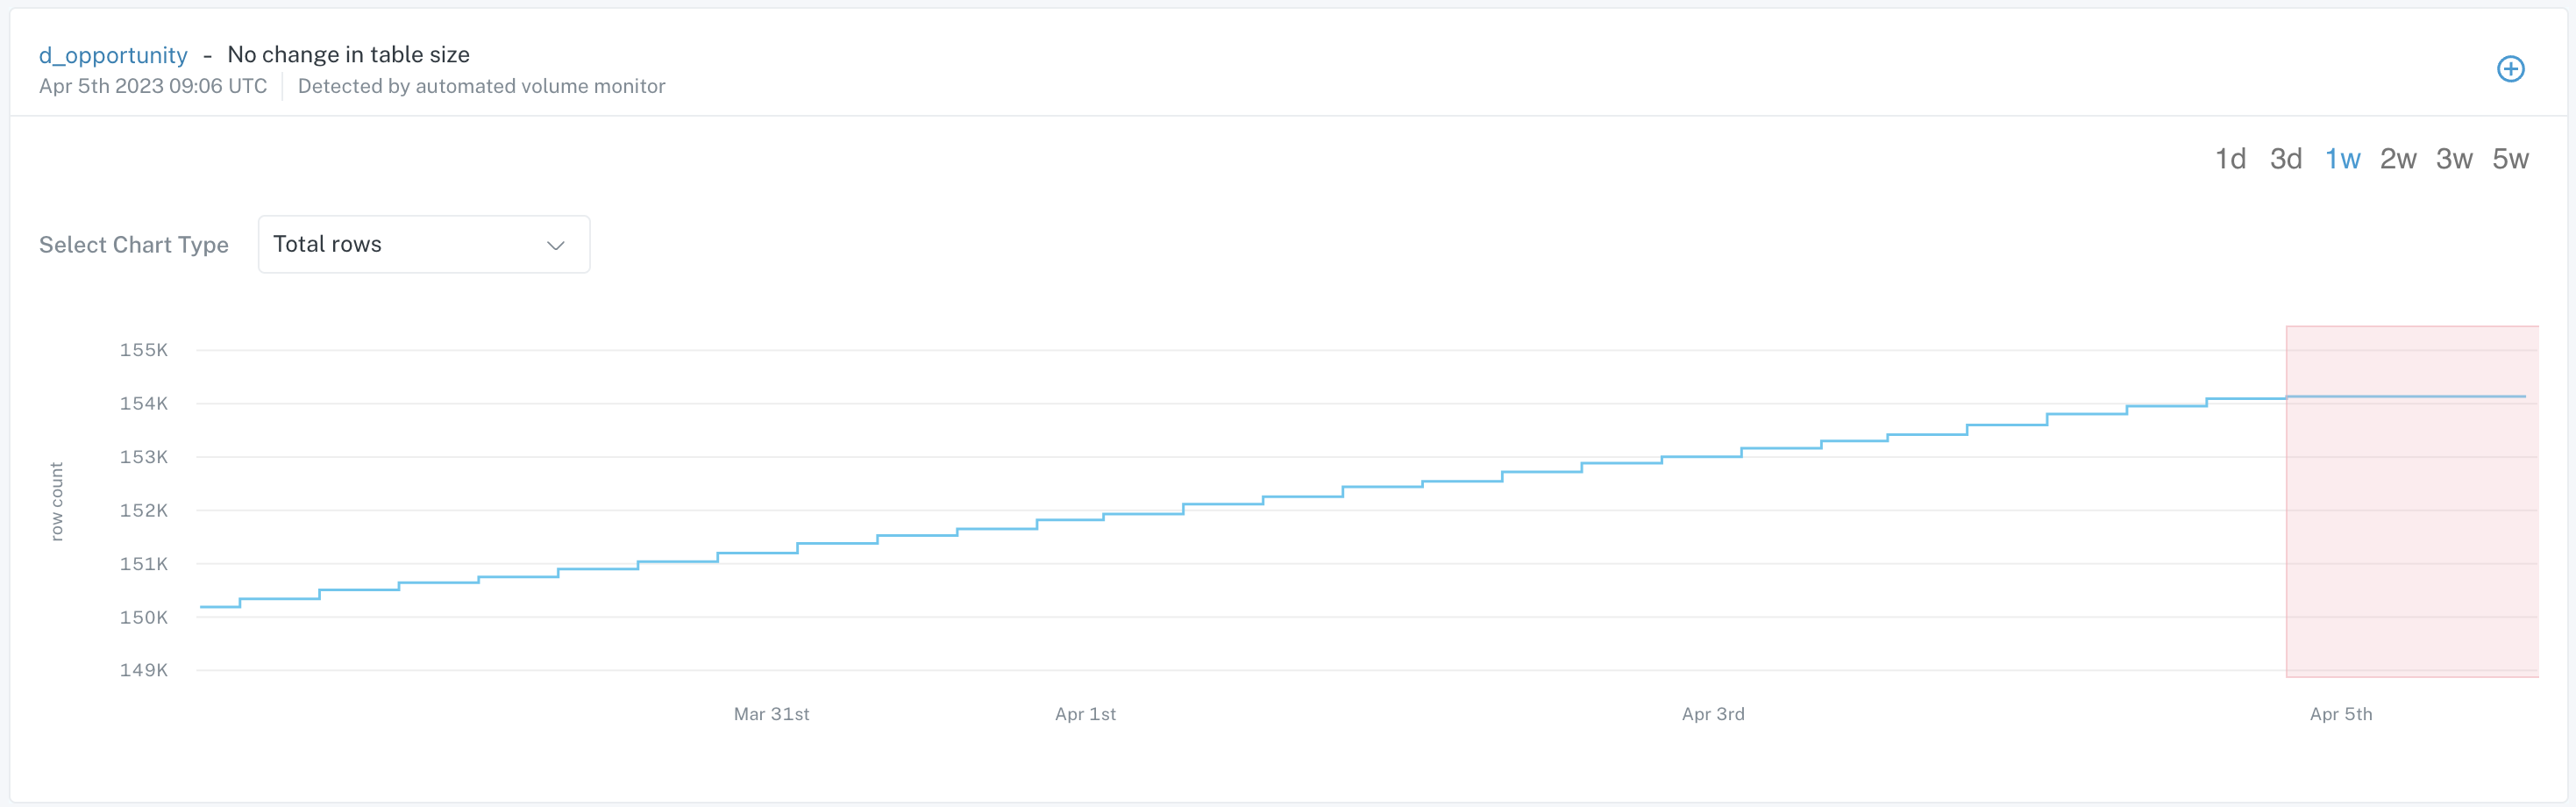
- Volume– Did the table receive too many or too few rows? Were there unexpected deletions?
- Schema– Did the organization of the data change in a way that will break assets downstream? For example, was a column renamed or deleted? Did a data type change?
- Quality– Monitoring the data itself across more than 50 critical data quality and validity metrics such as percent NULLS, percent unique, min/max, and more. Custom monitors can be created for metrics unique to an organization.
- Lineage– Data lineage illustrates which downstream tables and dashboards are impacted, as well as which upstream sources are generating the data.
When an incident occurs, data teams can leverage Monte Carlo’s triage capabilities to proactively warn data consumers, track incident status, and manage tickets. Dashboards automatically track data quality levels over time and can be used to set and support data product service-level agreements (SLAs).
“Reliable data is essential to getting the full value from your data products, whether that’s building trust in your internal analytics or ensuring your ML models are online and accurate. Data observability is a smart way for Microsoft customers to achieve this across their data estate,” said Mahesh Prakriya, Director Azure Data, Microsoft. “We are pleased to work with Monte Carlo as they rapidly expand their support across the Microsoft data ecosystem.”
Our Microsoft Roadmap
Our product roadmap features an Azure highway. We have integrations with Microsoft PowerBI, SQL Server and Azure SQL Database. We are also in the process of expanding to support additional services such as Azure Data Factory. See our full list of integrations.
To learn more about how Monte Carlo can help you deliver reliable data within the Microsoft data ecosystem, set up a time to talk with us through our website or via the Azure Marketplace.
Our promise: we will show you the product.
Read more posts.