Product demo.
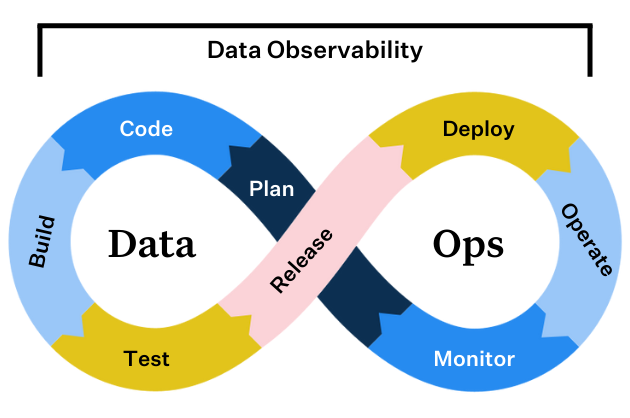
  What is data observability?
  What is a data mesh--and how not to mesh it up
  The ULTIMATE Guide To Data Lineage
 How Monte Carlo Makes it Easy for Data Engineers to Programmatically Scale Data Trust

Prateek Chawla
Prateek Chawla is a Founding Principal Engineer and Technical Lead at Monte Carlo.
When it comes to the data engineer life, to be in the code is to exist. Sure, a well designed UI is a wonderful thing, but when you’re an engineer building on the fly, sometimes you just need a little more flexibility from your resources.
But it’s not just about getting your work done right that matters—it’s also about getting it done faster. There’s nothing more demoralizing than calling in a support ticket for a task you could have done yourself in five minutes if you just had access to the API.
There’s no question that managed SaaS tooling has the power to bring fast, repeatable value to data teams. But all too often, that value comes at the cost of developer-friendly features that enable critical customization and more efficient development workflows.
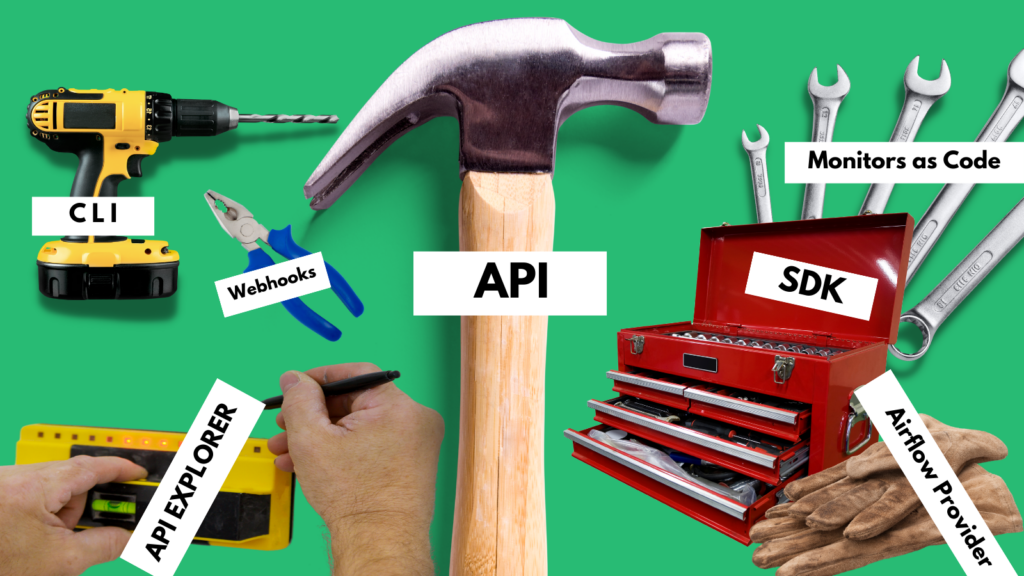
In this article, we’ll dive into how Monte Carlo keeps data engineers at the heart of our platform to deliver up a solution that offers the best of both worlds with a comprehensive developer toolkit and features designed for the way you work, including:
- API and API Explorer
- SDK
- CLI and Monitors as Code
- Airflow Provider
- Webhooks
But before we start patting ourselves on the back too hard, let’s take a minute to define our terms.
What does it mean to be “developer-friendly”?
According to Google’s top search result, developer-friendly tools “typically have intuitive user interfaces, provide helpful documentation, and have good support options.” That’s a start, but we think there’s a bit more to it than that.
For software to be truly developer-friendly, it needs to provide users with both a framework and a set of tools that allow developers to programmatically access, leverage, and augment the broadest possible functionality of the platform—including utilities, documentation, explanations, and examples—organized in a way that makes the development life-cycle easier to bootstrap for any given use case.
Or in layman’s terms, developer-friendly software just makes your job easier.
So, does Monte Carlo fit the bill of a developer-first platform?
We may be biased, but we can confidently say that Monte Carlo is a platform built by developers, for developers. While Monte Carlo democratizes data quality for everyone on the data team, our data observability platform is also designed to give complete freedom to the data engineers that support them.
Let’s take a look at some of what our team has done to deliver the industry’s first truly developer-focused data observability solution.
The Monte Carlo API
First and foremost, being developer-friendly means we have to give our users the same power we give ourselves.
Developers are like great race car drivers. They don’t just want to get under the hood before they start driving. They need to. So, we decided to give data engineers as much access and control as possible.
With the Monte Carlo API, our users can programmatically access, action, and augment everything that’s available in our UI—all without ever clicking a button. Well, except for maybe generating a service key.
Where the Monte Carlo UI provides deep opportunities to interact with our platform, the Monte Carlo API provides the same deep opportunities to interact programmatically with your own data. Present data health metrics and incident analytics on dashboards, enable automated custom monitoring, augment data, scale common operations, manage and triage incidents, and more.
And these are also the same APIs that power Monte Carlo’s web-based application, SDK CLI, and Airflow provider which we’ll get into soon enough, don’t you worry.
Some of the ways you might use the Monte Carlo API include:
- Presenting data health metrics and incident analytics on external dashboards
- Enabling automatic custom monitoring configurations when adding new tables in your ETL code. Note: monitors as code is the preferred way to do this. More details below!
- Augmenting the lineage that Monte Carlo automatically renders with additional resources and dependencies (e.g., external data sources, streaming sources, ML models, custom BI reports and other upstream/downstream assets)
- Performing custom analysis on your data ecosystem to better understand how data is being used, typically for capacity planning, performance optimization, data debt reduction, etc.
- Extracting insights back into your data platform.
Note: you can also do this via our CLI and data sharing. - Manage bulk operations like migrations or tag / sensitivity management
Our API offers full parity with the Monte Carlo UI, so you’ll never come across a custom API used by the UI that requires a support ticket or a special request to make changes. If we put it in our toolbox, we put it in your toolbox, too.
But we don’t just give you the power to programmatically do anything that’s possible via our UI. We give you the power to do a lot of things that aren’t…yet. Let’s take a look at how you can discover those opportunities using our API Explorer.
Check out our full API reference docs.
API Explorer
The best part about data engineering is the opportunity to unlock new opportunities for your business with data. Our greatest hope for our developer-first API is that our users would discover new ways to scale data trust through Monte Carlo’s data observability tools. So, we created our API Explorer to make that discovery just a little bit easier.
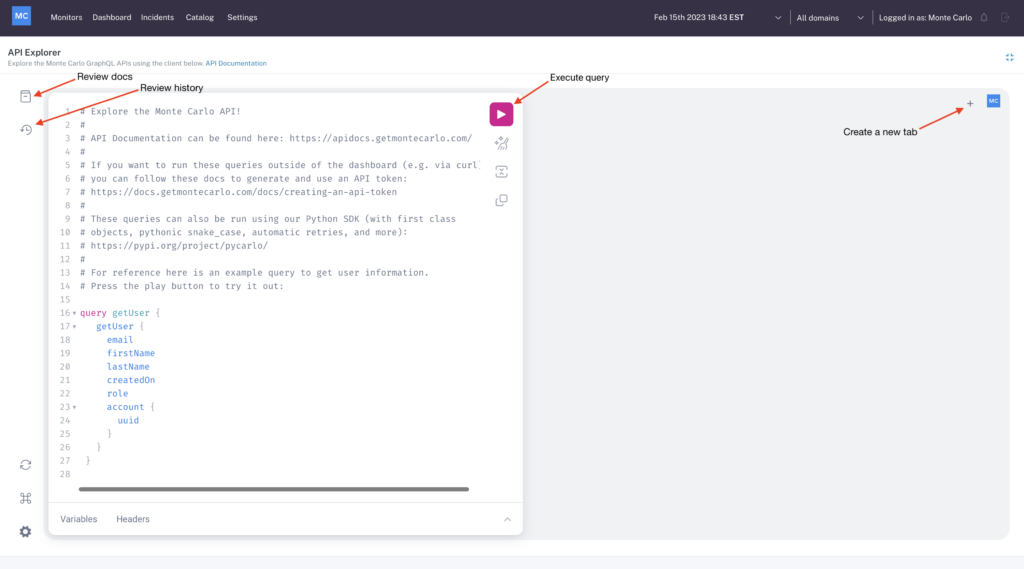
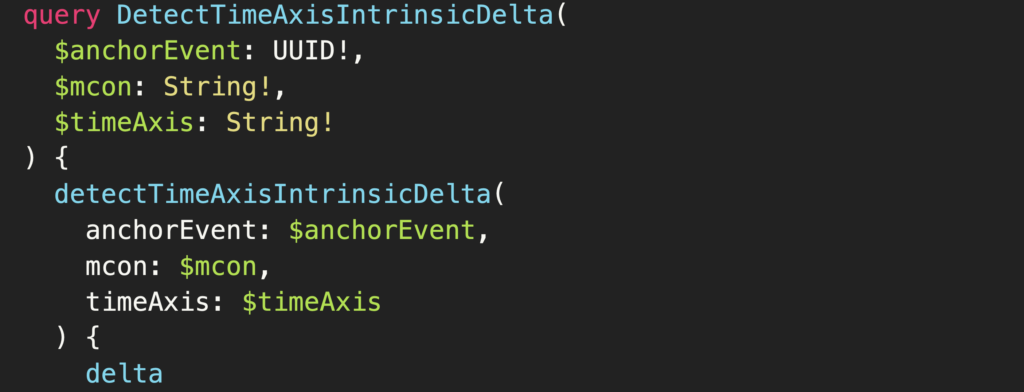
Monte Carlo’s API Explorer is an in-browser tool powered by GraphQL that makes it simple to experiment with any of our APIs, right from the Monte Carlo UI. Using the API Explorer, data engineers can easily discover new ways to leverage anything from custom monitors to alerts, and makes augmenting your data quality programs with Monte Carlo APIs faster and safer.
Think of our API Explorer like your data quality treasure map. Maybe you want to feed additional data into your Monte Carlo catalog for a more complete view of your data assets. Or maybe you’re considering including Salesforce data in your automated lineage to expand your lineage view. The API Explorer offers a safe way to develop and track changes, play with dashboards and lineage, and scale the value of reliable data across your organization.
Monte Carlo SDK
Powered by our robust API, the Monte Carlo python SDK takes our developer-friendliness to the next level.
Our SDK streamlines developer life-cycles even more by allowing users to conveniently access all of Monte Carlo’s APIs with first class objects, dot notation, more pythonic snake_case, and more.
The SDK lets teams programmatically augment Monte Carlo’s lineage, cataloging, and monitoring functionalities, export Monte Carlo data and analytics into any tool, or perform management operations like creating and managing domains without ever stepping cursor in the UI.
Of course, it’s often the boilerplate tasks that eat away at that precious development time most. Authorizations. Retries. The list goes on. Fortunately, our SDK covers those too. Had an error sending a message? The SDK will retry automatically. Need to string together a few actions at once? The SDK can do it with a single line of code.
Monte Carlo’s Command-Line Interface (CLI)
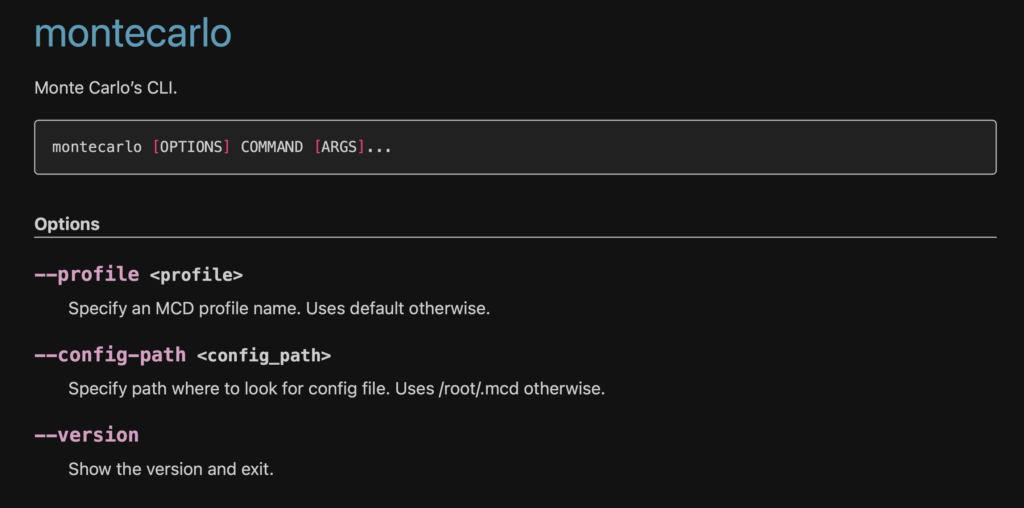
Using a CLI is all about speed-to-value, and the Monte Carlo CLI takes that value proposition to heart.
We’ve packed our CLI with commands, options, and arguments to give you immediate results for the actions you use every day, like deploying monitors, integrating new data sources, adding and deploying data collectors, loading insights, discovering resources, automating common flows, and a menagerie of other operations.
Most importantly, the CLI enables fast deployment of Monitors as Code and Notifications as Code, allowing you to scale your custom data quality monitors faster and easily maintain data health as your data environment grows.
Check out our full CLI reference.
Monitors as Code
Monte Carlo offers two major types of monitors. Automated and custom. Automated monitors are preprogrammed checks for common issues that are immediately deployed across all your tables at the time of integration. These instant checks—like freshness or volume anomalies and changes to schema— provide an at-a-glance look into the overall health of your data platform.
But where automated monitors go broad, custom monitors go deep. Configured as a YAML file, custom monitors—like field health, dimension tracking, or custom SQL rules— provide comprehensive data quality coverage for only your most important tables. Unlike our automated ML monitors which are deployed immediately out-of-the-box, custom monitors are created individually based on your specific coverage needs
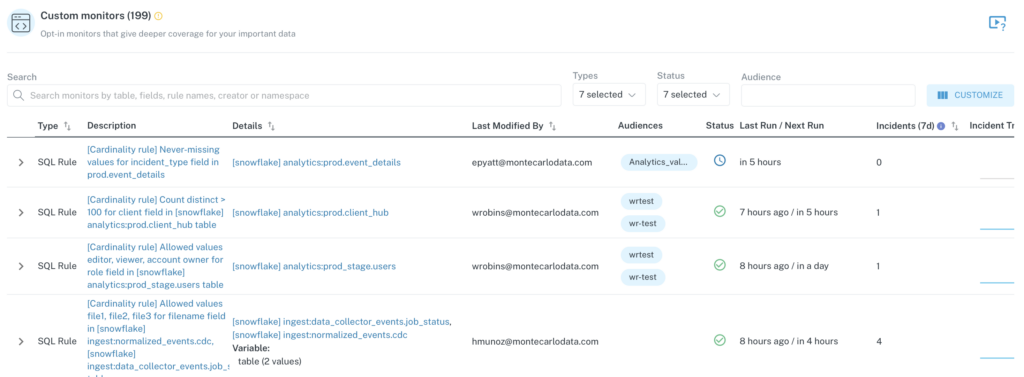
Now, for teams with smaller data needs, custom monitors can be easily created in a few clicks through the Monte Carlo UI. Easy peasy. But with 3 Snowflake instances and 100 users, clicking buttons to create custom monitors just isn’t a scalable operation. That’s where Monitors as Code saves the day.
Acting as our infrastructure as code, Monitors as Code makes your data quality monitors programmatic, enabling engineers to write and rapidly deploy custom monitors based on a given codebase as part of their build process or within their CI/CD.
By leveraging the Monte Carlo CLI, Monitors as Code is an endlessly scalable approach to deep data quality monitoring.
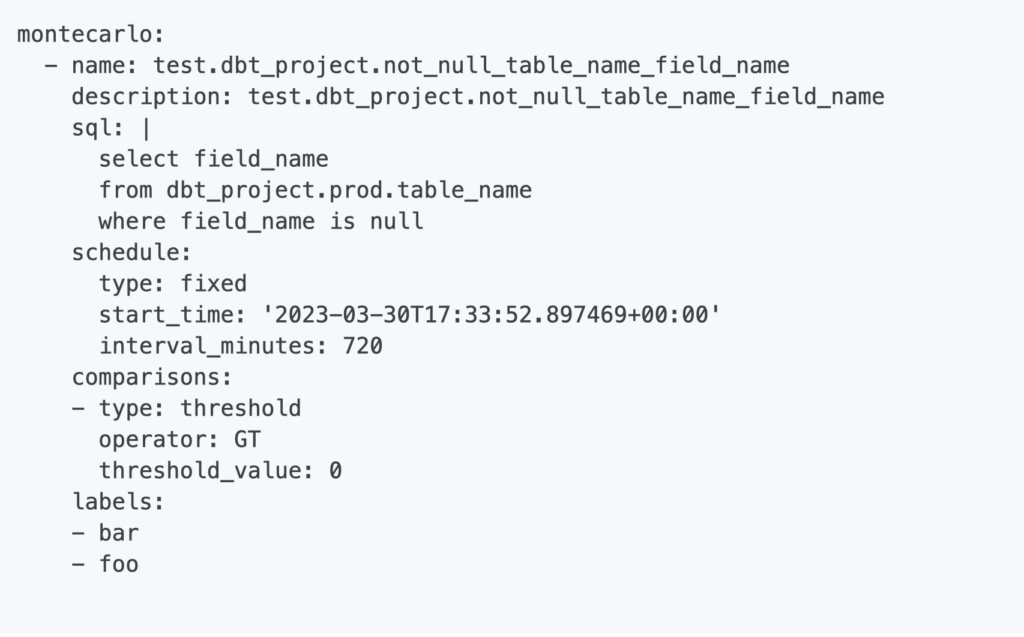
Monitors as Code is easily tracked and approved by teammates. It fits seamlessly into your team’s existing data engineering workflow (including dbt configuration files). And it provides a quick, consistent, and repeatable process for new monitors.
With Monitors as Code, you can easily understand how a monitor was created, control the development process from review to approval, and deploy additional monitors without the Sisyphian burden of clicking a bunch of buttons.
Why Monitors as Code?
- Monitors are maintained in source control, so changes are easily tracked and approved
- Custom monitors can be automated—create 100 monitors without UI clicking, enforce standards, and whatever you need to drive data trust across your organization
- It fits seamlessly into the data engineering workflow
- It’s more consistent and predictable, and less error-prone (e.g. you won’t get someone accidentally deleting/updating monitors)
- It’s repeatable. You may forget a button you clicked six months ago, but the code can never forget.
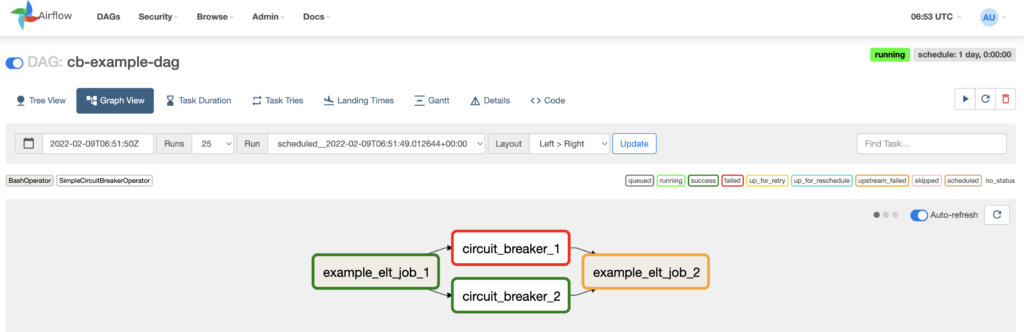
Airflow provider
Want to bring Monte Carlo utilities into your pipeline? Powered by our SDK, Monte Carlo’s Airflow provider lets you add Monte Carlo directly to your orchestration pipelines.
It’s one thing to detect data incidents as soon as they occur. It’s another thing to stop bad data from entering your data pipelines in the first place.
With Monte Carlo’s Airflow provider, you can circuit break data pipelines when specific thresholds are / aren’t met to proactively prevent data quality issues from surfacing downstream.
Note: we recommend using circuit breakers sparingly, as pausing production pipelines can have serious repercussions to your broader data environment. If you’re considering circuit breakers, here’s a few important tips to keep in mind:
- Select only rules with a run history where you have a good understanding of how often Incidents are triggered
- Start small by implementing circuit breakers in a handful of Airflow DAGs with a lot of visibility to catch when the breaker is triggered
- Select SQL Rules where the underlying SQL executes quickly to avoid long query timeouts
Check out our Airflow provider.
Webhooks
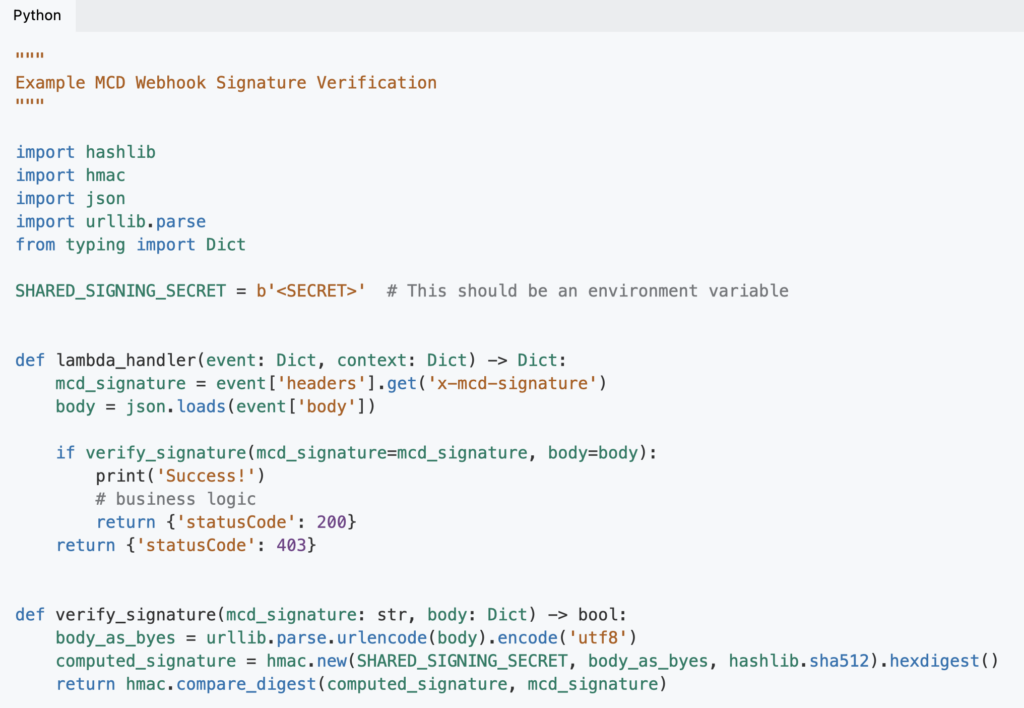
Monte Carlo supports multiple notification integrations out of the box—like Slack, Microsoft Teams, PagerDuty, Jira, and email—but what if you need to support a messaging platform that’s not included?
Let’s say you want the raw incident payload to enable custom workflows or support another tool in your platform. That’s when you’d find yourself in the realm of Webhooks. Instead of polling for incident data manually, you could set up a Webhook to automatically route the incident data to your platform of choice.
With Webhooks, you’ll be able to get the information you need, where and when you need it.
Developer-first means future-proof
At Monte Carlo, being developer-first isn’t just lip-service. We don’t believe fully-managed and developer-first are mutually exclusive. And we’ve made it our goal to prove that from the ground up.
To this end, we’ll continue to update our platform and our toolkits based on how engineers and developers are using it, to give our customers a truly developer-first experience—not just so that you’ll enjoy using Monte Carlo more, but so that you can better trust your data.
So, get in there and write some code. Monte Carlo’s ready for ya.
Our promise: we will show you the product.
Read more posts.