Product demo.
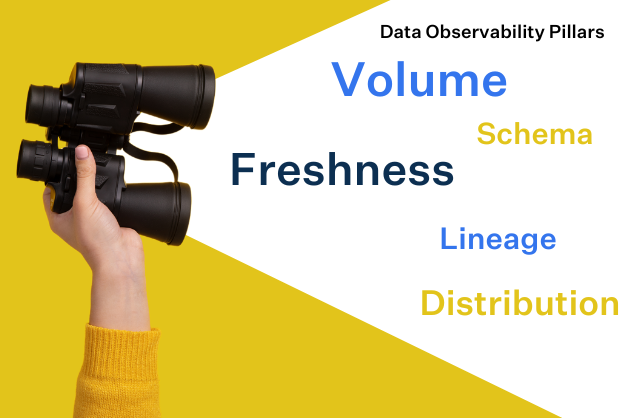
  What is data observability?
  What is a data mesh--and how not to mesh it up
  The ULTIMATE Guide To Data Lineage
 The Right Way to Measure ROI on Data Quality


Francisco Alberini
Francisco is a product manager at Monte Carlo.
To quote a friend, “Building your data stack without factoring in data quality is like buying a Ferrari but keeping it in the garage.”
In this article, Francisco Alberini, Product Manager at Monte Carlo, introduces a better way for data teams to measure the financial impact of bad data on your business.
Last week, I was on a Zoom call with Lina, a Data Product Manager at one of our larger customers who oversees their data quality program.
Her team is responsible for maintaining 1000s of data pipelines that populate many of the company’s most business critical tables. Reliable and trustworthy data is foundational to the success of their product, yet Lina was struggling to find a clear way to quantify both the importance and scope of the pipelines she owned.
“We all know that reliable data is important to the business,” she said. “But I don’t have a great way to measure its ROI of data quality, and from there, justify investment in my team.”
Instead of getting the support she required to keep her company’s pipelines operational (if not functional), she found herself working at all hours of the day to personally maintain them. Time and again, budget and resources would be allocated to flashier, more feature-focused data engineering work, leaving her lean team high and dry when quarterly planning came around.
Lina’s experience so aptly conveys a struggle that many data teams deal with: justifying and measuring the ROI of a data quality program.
This conversation with Lina, and many others exactly like it, led us to look for measurement frameworks that would help teams better communicate the value of data reliability for their company.
We’ve found that the following data quality metrics (borrowed from the DevOps world) offer a good start: Time To Detection and Time to Resolution.
Time To Detection (TTD)
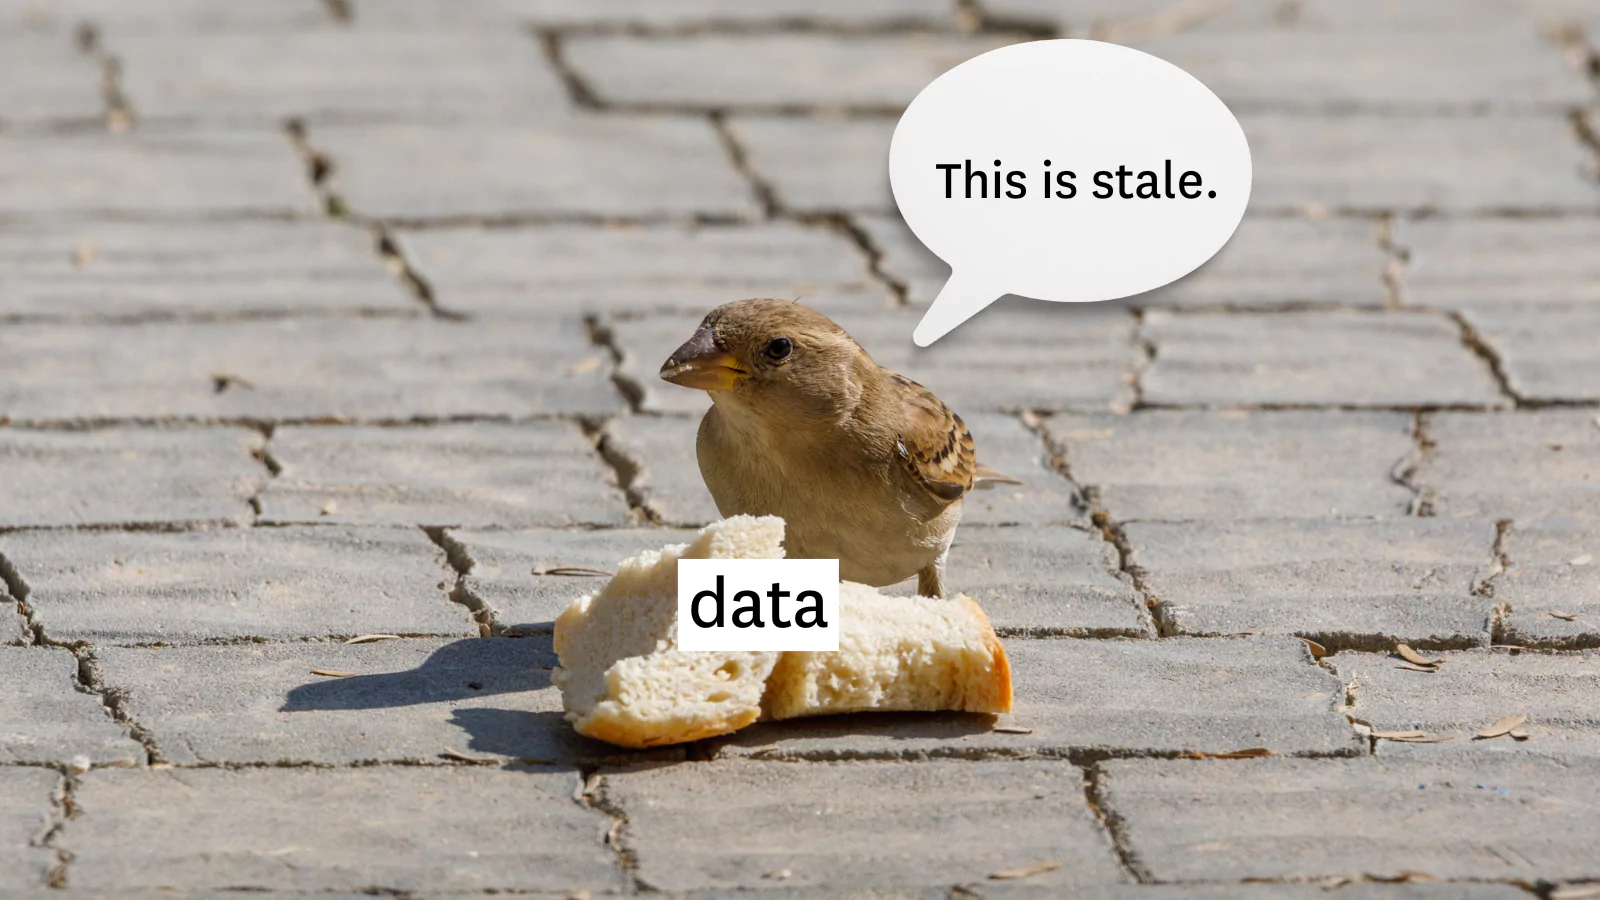
Time to Detection refers to the amount of time it takes for your data engineering team to identify a data quality issue, whether that’s a freshness anomaly, a model that failed to run, or even a schema change that sent an entire pipeline into chaos.
For many data teams, TTD is often measured in days to weeks, and sometimes even months, because the primary means of detection is waiting for downstream data consumers to communicate that the data “looks off.”
These weeks to months of data downtime are incredibly costly to the business for two reasons:
- The more time that passes, the harder it is to recover data by re-processing or backfilling source data that may no longer available.
- All the business decisions, marketing campaigns, product decisions, etc. made using the incorrect data need to be re-validated, or even worse, re-communicated to stakeholders.
Of course we can all agree that reducing TTD to minutes sounds great, but getting there could require a significant amount of engineering work, which negates the ROI of the effort.
Before jumping into solutioning though, it’s important to calculate your baseline TTD. You can do this by reviewing the last 3-4 data incidents your team tackled and roughly calculating the amount of time it takes to detect them. From there, you can set a goal and use that to communicate to leadership why you need more resources.
Toolkit for decreasing TTD:
- Machine learning-powered anomaly detection: Testing your data before it goes into production is P0, but for tracking those unknown unknowns, it’s helpful to implement automated anomaly detection and custom rules
- Relevant incident feeds and notifications. Integrating a communication layer (likely an API) between your data platform and PagerDuty, Slack, or any other incident management solutions you use is critical for conducting root cause analysis, setting SLAs/SLIs, and triaging data downtime as it arises.
Time To Resolution (TTR)
Next, data engineering teams should measure Time To Resolution (TTR), a metric that seeks to answer the question: how quickly were you able to resolve a data incident once you’re alerted?
Also measured in hours, minutes, or days, TTR metrics allow you to understand the severity of your data issue and track the amount of time it takes to resolve it. When converted to dollars (i.e., how much money is spent / saved as a result of TTR), it becomes much easier to communicate the impact of this data to your stakeholders.
Toolkit for decreasing TTR:
- Statistical root cause analysis: As we discussed in a previous article, root cause analysis is a common practice among Site Reliability Engineering teams when it comes to identifying why and how applications break in production. Similarly, data teams can leverage statistical root cause analysis and other intelligent insights about your data to understand why these issues arose in the first place.
- End-to-end lineage: Robust lineage at each stage of the data lifecycle empowers teams to track the flow of their data from A (ingestion) to Z (analytics), incorporating transformations, modeling, and other steps in the process, and it critical for supplementing the often narrow-sighted insights (no pun intended) with statistical RCA approaches. The OpenLineage standard for metadata and lineage collection is a great place to start.
- Data discovery to understand data access patterns: While many data catalogs have a UI-focused workflow, data engineers need the flexibility to interact with their catalogs programmatically, through data discovery. Such solutions can also be used to understand relationships between data, who uses it, and how it’s being used.
Putting it all together
You can measure the financial impact of your data by understanding how much money it costs when it’s not operational.
The equation might go a little something like this:
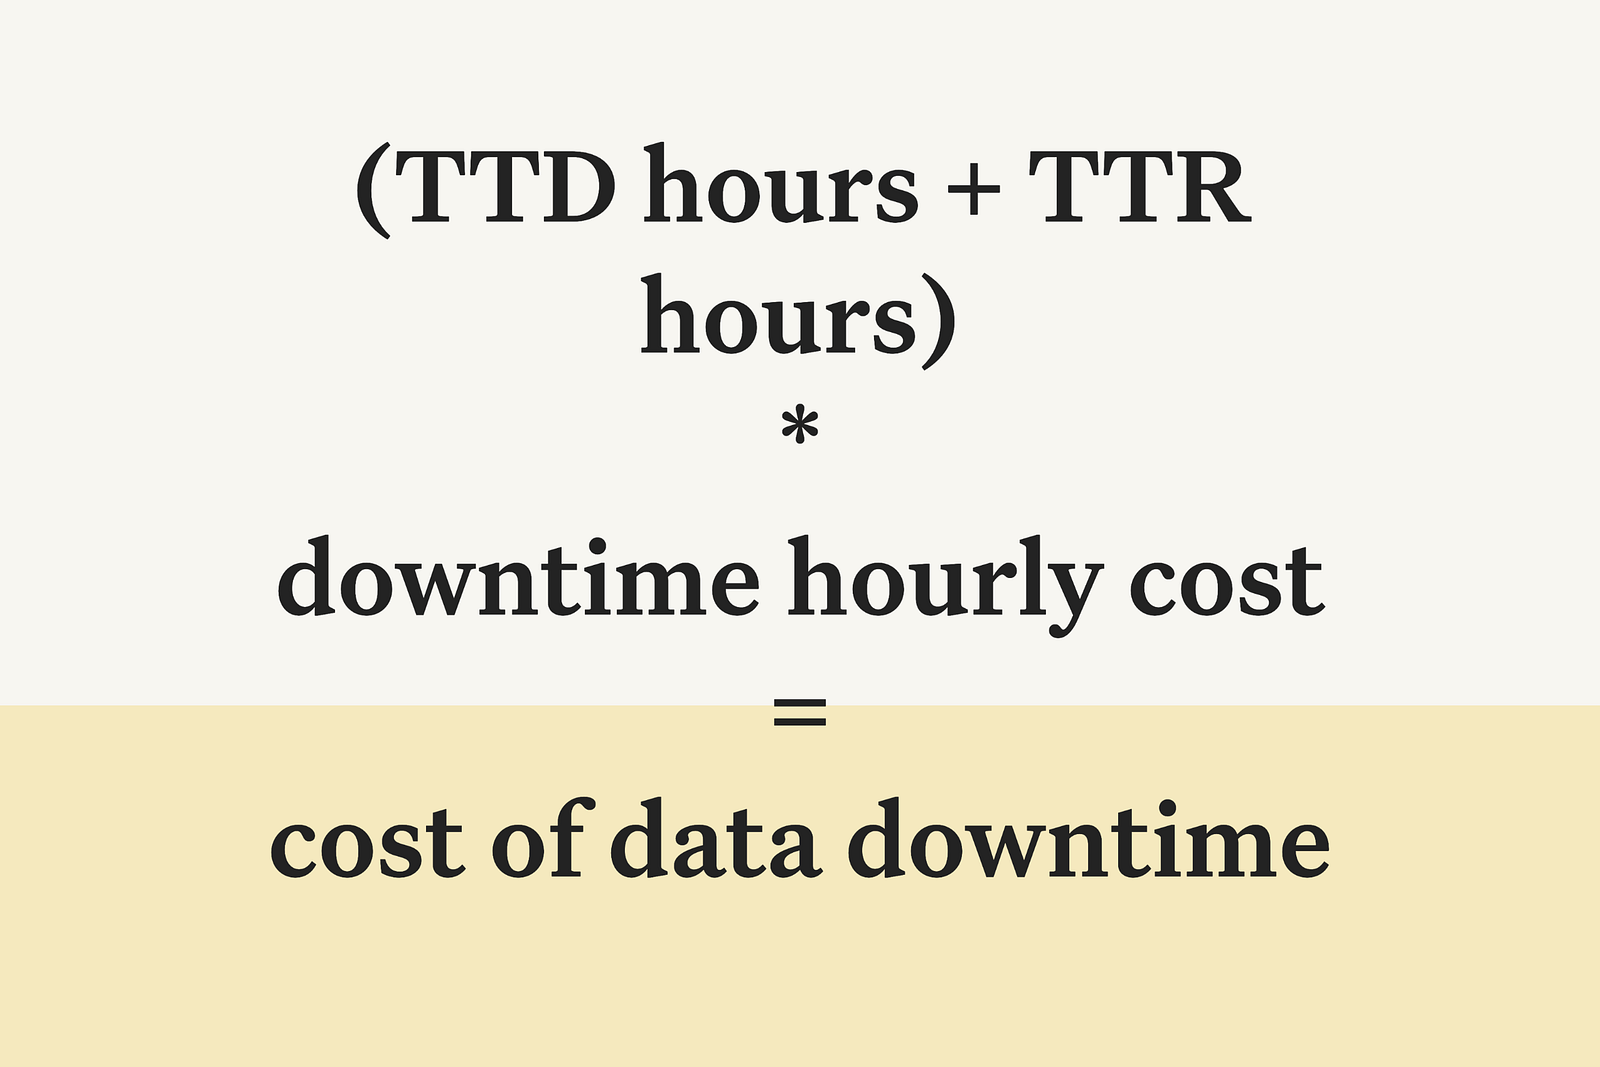
Downtime hourly cost is a generalized metric to represent the engineering time spent per downtime hour and the impact of data downtime on data consumers and business decisions.
Engineering time spent can be calculated as a factor of downtime hours. For example, we can estimate that 1 data engineer spends 1/4 of every downtime hour monitoring for and investigating issues, which contributes $25 per downtime hour (avg $100/hr salary + benefits for data engineer).
Impact of data downtime cost varies significantly depending on the potential impact of a downtime hour on your business. If for example, you rely on data to report earnings to Wall Street, a downtime hour resulting in mis-reporting data is catastrophic likely contributing $1000s/hr to the downtime cost. Additionally, you can add the cost of downtime on your analytics team. If for example you have 10 analysts, the cost of them sitting idle during a downtime incident is significant (avg $75/hr salary * 10 = $750/hr). Assuming not all analysts will be impacted by a downtime hour, we can conservatively reduce this by 75% to $175/hr.
In this scenario, then, we can estimate a downtime hour to cost our business between $500/hr.
Assuming you have ~100 downtime hours a month, the cost to your business could easily exceed $600,000/year (100hrs/month * $500/hr * 12 months).
It’s also important to keep in mind that this equation doesn’t even factor in opportunity cost. Check out our article with Barkha Saxena, Chief Data Officer at Poshmark for more on what that might look like.
When you consider how often data breaks, this is no chump change.
By calculating baseline TTD and TTR, it becomes much easier to then communicate exactly what impact you expect to generate on the business. Without this baseline, it’s much harder to get operational buy-in from the powers that be to grow your team, up-level your tech stack, and scale out the data quality program of your dreams.
Just imagine being able to share this with your CTO:
“Adding another data engineer and investing in a data observability platform can help us reduce our average monthly downtime from 350 hours to 14 hours which translates into a 3.4x ROI, or $1.5 million per year.”
As they say: (down)time really is money.
Be sure to check out our data quality value calculator that is based on a very similar formula.
Fighting data downtime? Book a time to speak with us using the form below.
Our promise: we will show you the product.
Read more posts.