Product demo.
  What is data observability?
  What is a data mesh--and how not to mesh it up
  The ULTIMATE Guide To Data Lineage
 How to Improve Data Engineering Workflows with End-to-End Data Observability


Barr Moses
CEO and Co-founder, Monte Carlo. Proponent of data reliability and action movies.
As companies increasingly leverage data-driven insights to drive innovation and maintain their competitive edge, it’s important that their data is accurate and trustworthy. With data observability, data teams can now identify and prevent inaccurate, missing, or erroneous data from breaking your analytics dashboards, delivering more reliable insights.
Does this situation ring a bell?
Your Marketing Analytics team uses Looker to visualize how many sales qualified leads are generated per day as a result of a new billboard in New York City’s Time Square. Minutes before a Q4 planning meeting with their CEO, the VP of Marketing pings you:
“The data is all wrong… what happened?!”
You open Looker and realize the numbers, which are normally updated every 15 minutes, haven’t been touched in 24 hours!
While powerful solutions exist to deliver data analytics on top of existing data, many data teams cite data quality and integrity as key pain points, costing them millions of dollars in wasted revenue and up to 50 percent of their team’s time. Instead of working on projects that actually move the needle for their company, data professionals are forced to debug data pipelines and firefight broken dashboards.
To address this all-too-common reality, data analysts, engineers, and scientists need an easy and collaborative way to monitor and alert for abnormalities in their data, from ingestion to analytics. It’s also important they have the tools necessary to map their data lineage, keeping tabs on how changes in their data pipelines affect downstream sources, such as analytics and business intelligence reports.

How data workflows break
Bad data spares no one, and can crop up in a variety of ways, causing sleepless nights, wasted resources, and erosion of data trust.
After speaking with several hundred data engineering teams over the past 12 months, I’ve noticed there are three primary reasons why good data turns bad: 1) a growing number of data sources in a single data ecosystem, 2) the increasing complexity of data pipelines, and 3) bigger, more specialized data teams.
More and more data sources
Nowadays, companies use anywhere from dozens to hundreds of internal and external data sources to produce analytics and ML models. Any one of these sources can change in unexpected ways and without notice, compromising the data the company uses to make decisions.
For example, an engineering team might make a change to the company’s website, thereby modifying output of a data set that is key to marketing analytics. As a result, key marketing metrics may be wrong, leading the company to make poor decisions about ad campaigns, sales targets, and other important, revenue-driving projects.
Increasingly complex data pipelines
Data pipelines are increasingly complex with multiple stages of processing and non-trivial dependencies between various data assets. With little visibility into these dependencies, any change made to one data set can have unintended consequences impacting the correctness of dependent data assets.
Something as simple as a change of units in one system can seriously impact the correctness of another system, as in the case of the Mars Climate Orbiter. A NASA space probe, the Mars Climate Orbiter crashed as a result of a data entry error that produced outputs in non-SI units versus SI units, bringing it too close to the planet. Like spacecraft, analytic pipelines can be extremely vulnerable to the most innocent changes at any stage of the process.
Bigger, more specialized data teams
As companies increasingly rely on data to drive smart decision making, they are hiring more and more data analysts, scientists, and engineers to build and maintain the data pipelines, analytics, and ML models that power their services and products, as well as their business operations.
Miscommunication or insufficient coordination is inevitable, and will cause these complex systems to break as changes are made. For example, a new field added to a data table by one team may cause another team’s pipeline to fail, resulting in missing or partial data. Downstream, this bad data can lead to millions of dollars in lost revenue, erosion of customer trust, and even compliance risk.
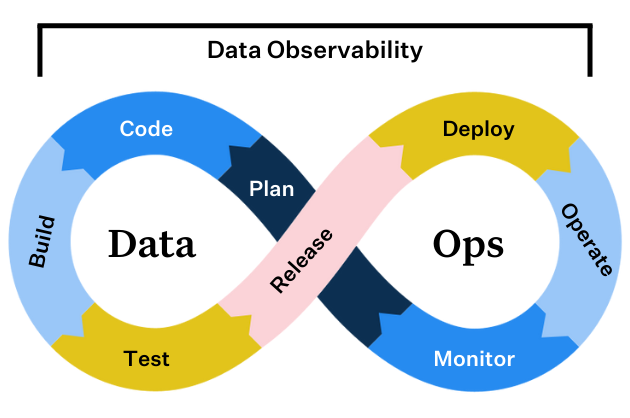
The solution to broken data workflows? Data observability.
Ensuring reliable insights with data observability
Data teams need a way to seamlessly monitor and alert for issues with the data feeding their dashboards, giving them a holistic view of the health and reliability of their data assets.
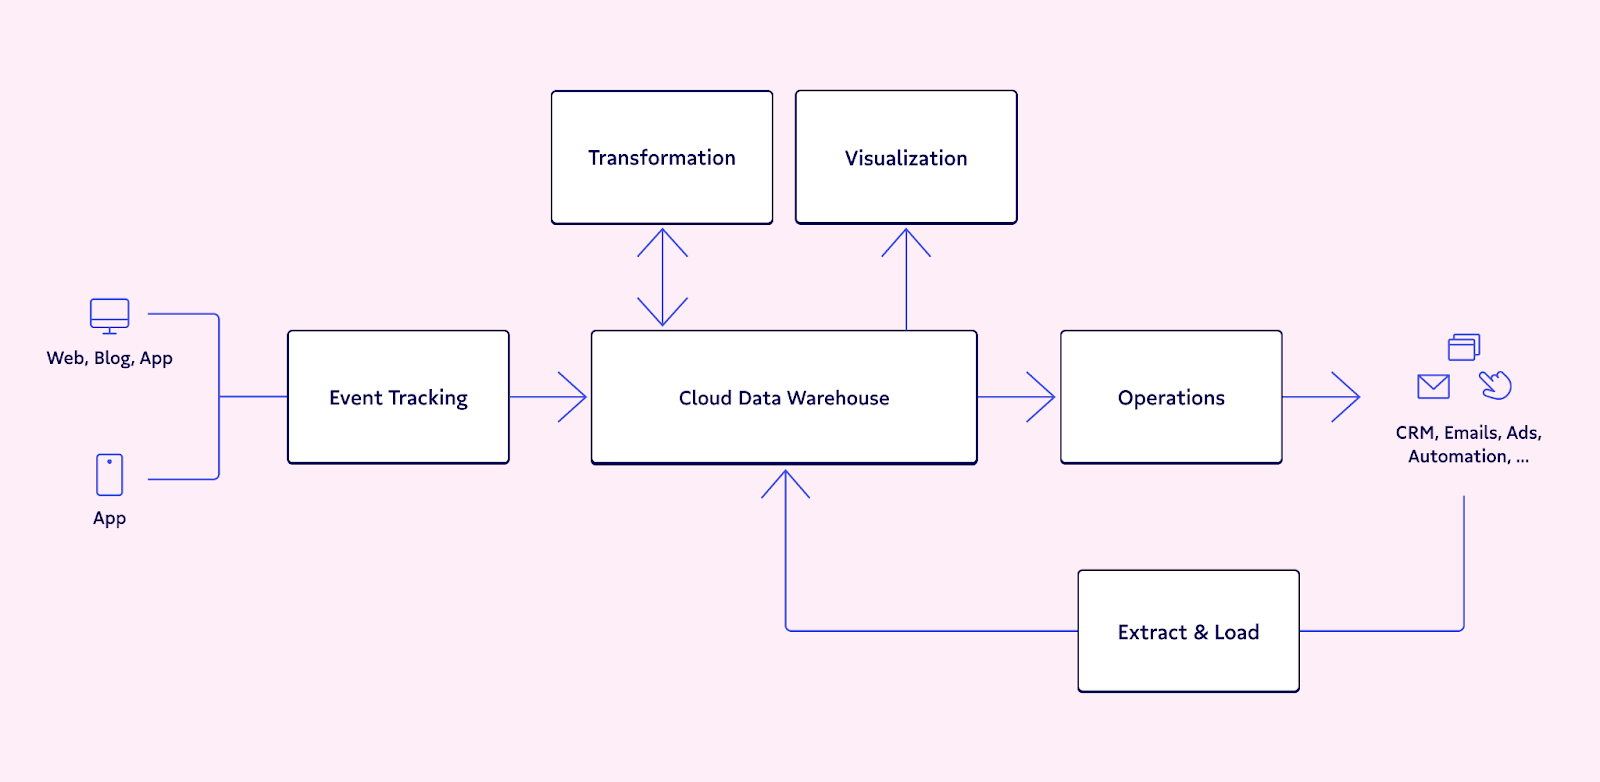
To tackle this, data observability automatically monitors across key features of your data ecosystem, including data freshness, distribution, volume, schema, and lineage. Without the need for manual threshold setting, data observability answers such questions as:
- When was my table last updated?
- Is my data within an accepted range?
- Is my data complete? Did 2,000 rows suddenly turn into 50?
- Who has access to our marketing tables and made changes to them?
- Where did my data break? Which tables or reports were affected?
With the right approach to data observability, data teams can trace field-level lineage across entire data workflows, facilitating greater visibility into the health of their data and the insights those pipelines deliver. Such functionality allows data engineers, analysts, and scientists to identify why their dashboards aren’t pulling the freshest data for your stakeholders (i.e., is there a missing data set? A null value? Did someone use the CSV file type instead of XLS?).
How Compass prevents broken workflows with Data Observability
Data Observability is great in theory, but how does it work in practice?
As a digital-first real estate platform, Compass leverages data-driven technology to make the search and sell experience intelligent and seamless for agents and property buyers worldwide. Suvayan Roy, Senior Product Manager at Compass, oversees workflows for the data team responsible for building and maintaining the analytics pipelines for their entire 13,000-person organization. Keeping tabs on the upstream and downstream dependencies for their Looker dashboards is top-of-mind for Suvayan; if data breaks, his team needs to be the first to know and solve.
“My data observability monitoring feed to Slack gives me comfort that our data is healthy and everything’s working as designed. And on days where something goes wrong, I know my team will be the first to know and that we’ll be in command of the situation,” Suvayan said.
With automated data observability, Roy and his team can sleep soundly at night and continue focusing on building products, meeting customer needs, and revolutionizing real estate without having to worry about the state of their data and analytics.
Compass’ story is just the beginning. Personally, I’m excited for what the future of this category holds.
Reliable workflows, here we come!
Want to learn more about how data observability can help your data team? Book a time to speak with us using the form below.
Our promise: we will show you the product.
Read more posts.