Product demo.
  What is data observability?
  What is a data mesh--and how not to mesh it up
  The ULTIMATE Guide To Data Lineage
 How to Conduct Data Incident Management for Data Teams


Barr Moses
CEO and Co-founder, Monte Carlo. Proponent of data reliability and action movies.
As data systems become increasingly distributed and companies ingest more and more data, the opportunity for error (and incidents) only increases. For decades, software engineering teams have relied on a multi-step process to identify, triage, resolve, and prevent issues from taking down their applications.
As data operations mature, it’s time we treat data downtime, in other words, periods of time when data is missing, inaccurate, or otherwise erroneous, with the same diligence, particularly when it comes to building more reliable and resilient data pipelines
While not a ton of literature exists about how data teams can handle incident management for their data, there are already great resources we can leverage from our friends in software development. With a few adjustments, these tricks of the trade have become invaluable tools for some of the best data engineering teams.
When it comes to building a data incident management workflow for your pipelines, the 4 critical steps include: incident detection, response, root cause analysis (RCA) & resolution, and a blameless post-mortem.
In this article, we walk through these steps and share relevant resources data teams can use when setting their own incident management strategies.
Incident Detection
It goes without saying that you should, first and foremost, test your data before it enters production. Still, even with the most robust tests and checks in place, bad data will fall through the cracks and be pushed to prod before you can say “broken data pipeline.”
When data downtime strikes, the first step is incident detection. Incidents can be detected through data monitoring and alerting, which can be both implemented manually on your data pipelines and triggered based on specific thresholds, or layered as part of a data observability solution and triggered automatically at regular intervals based on historical data patterns and custom rules.
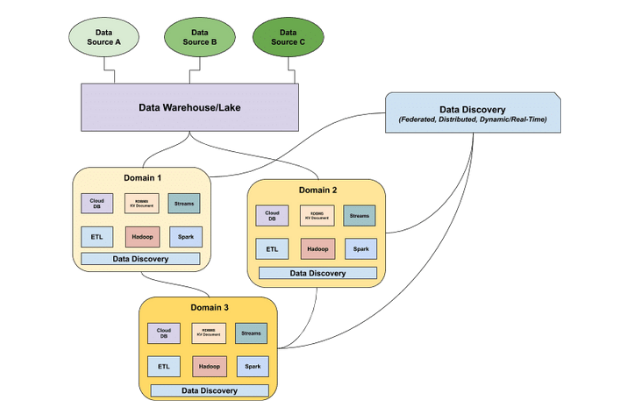
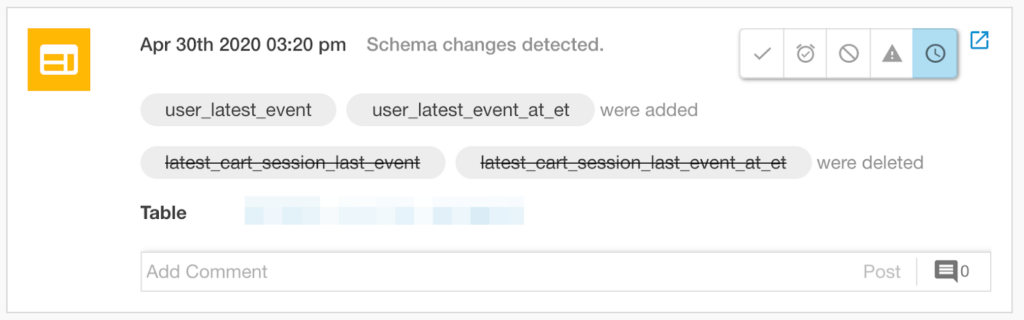
One critical component of data monitoring is anomaly detection, or the ability to identify when pillars of data health (i.e., volume, freshness, schema, and distribution) veer from the norm. Anomaly detection is most valuable when implemented end-to-end (across your warehouses, lakes, ETL, and BI tools) as opposed to only in a specific silo of your data ecosystem. Good anomaly detection will also tune algorithms to reduce white noise and false positives.
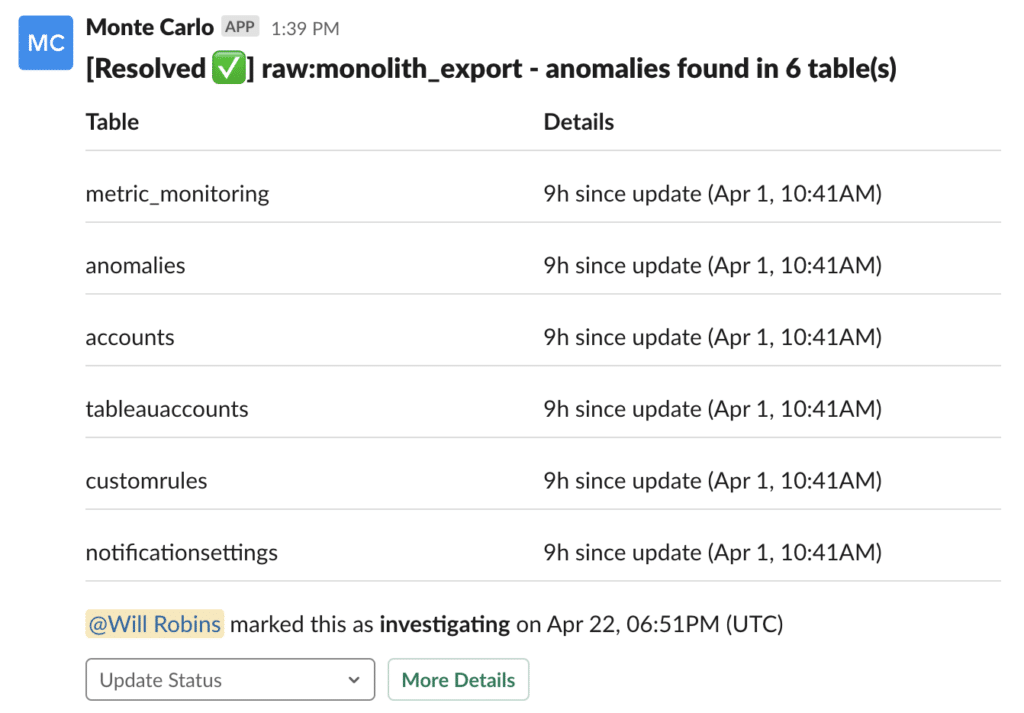
Incident detection can be integrated into data engineering and analytics workflows, ensuring that all data stakeholders and end-users are paged when issues arise across the proper communication channels (Slack, email, SMS, carrier pigeon…)
Suggested Resources:
- Incident Management in the Age of DevOps & SRE (Damon Edwards, InfoQ)
- Managing Incidents (Andrew Stribblehill, Google SRE Handbook)
- Metrics, Monitoring, and Alerting (Elaine Arbaugh, Affirm Tech Blog)
Response
Good incident response starts — and ends — with effective communication, and fortunately, much of it can be prepared in advance and automated out through the proper workflows via PagerDuty and Slack when the time comes.
Data teams should spend time writing runbooks and playbooks that walk through standard incident response. While runbooks give you instructions for how to use different services and common issues they encounter, playbooks provide step-by-step processes for handling incidents. Both will provide links to code, documentation, and other materials that can help teams understand what to do when critical pipelines break.
One important part of a good runbook? Delegating roles when outages or breakages occur.
In traditional site reliability engineering programs, an on-call process that delegates specific roles depending on service, often segmented by hour, day, or week. In addition to an “incident responder,” there is often an “incident commander” responsible for assigning tasks and synthesizing information as the responder and other stakeholders troubleshoot the issue.
The incident commander is also tasked with spearheading communication to upstream and downstream consumers that might be affected, i.e., those that work with the data products powered by the broken pipeline.
With business context, metadata is a powerful tool for understanding which teams are affected by a given data downtime incident; coupled with automated, end-to-end lineage, communicating the upstream and downstream relationships between these affected assets can be a painless and quick process, saving teams hours of manual graphing.
Once data downtime occurs, it’s important to communicate its impact to upstream and downstream consumers, both those that work with the data and those that use it. With the right approach, much of this can be baked into automated workflows using PagerDuty, Slack, and other communication tools.
Suggested Resources:
- How to create Runbooks with Gitlab (GitLab documentation)
- Compare runbooks vs. playbooks for IT process documentation (Stephen J. Bigelow, TechTarget)
- Enable Devs to Do Ops (Francesco Negri, Buildo)
Root Cause Analysis & Resolution
In theory, root causing sounds as easy as running a few SQL queries to segment the data, but in practice, this process can be quite challenging. Incidents can manifest in non-obvious ways across an entire pipeline and impact multiple, sometimes hundreds, of tables.
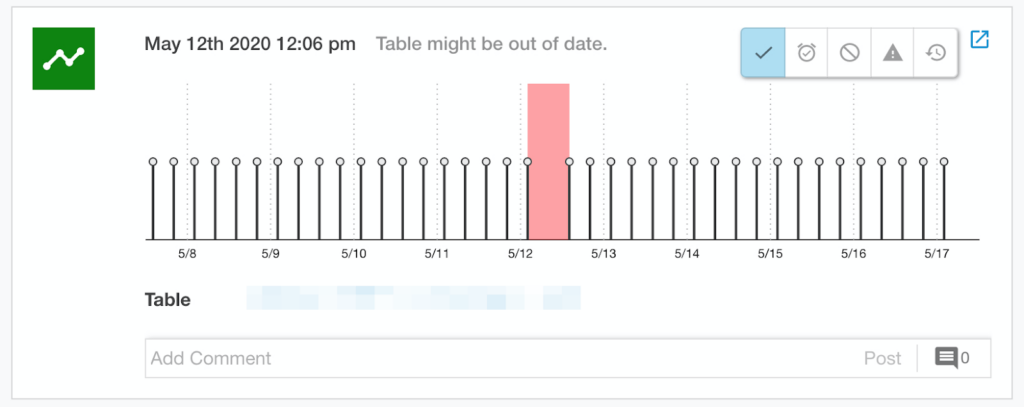
For instance, one common cause of poor data quality is freshness – i.e., when data is unusually out-of-date. Such an incident can be a result of any number of causes, including a job stuck in a queue, a time out, a partner that did not deliver its dataset timely, an error, or an accidental scheduling change that removed jobs from your DAG.
In our experience, we’ve found that most data problems can be attributed to one or more of these events:
- An unexpected change in the data feeding into the job, pipeline or system
- A change in the logic (ETL, SQL, Spark jobs, etc.) transforming the data
- An operational issue, such as runtime errors, permission issues, infrastructure failures, schedule changes, etc.
Quickly pinpointing the issue at hand requires not just the proper tooling, but a holistic approach that takes into consideration how and why each of these three sources could break.
As software (and data) systems become increasingly complex, it becomes more and more difficult to pinpoint one exact cause (or root) of an outage or incident. Amazon’s 5-Whys approach provides a helpful framework through which to contextualize RCA:
- Identify the problem
- Ask why the problem happened, and record the reason
- Decide if the reason is the root cause
- Could the reason have been prevented?
- Could the reason have been detected before it happened?
- If the reason is human error, why was it possible?
- Repeat the process using the reason as the problem. Stop when you are confident that you have found the root causes.
There is very rarely a single reason why your system broke. As data engineers work to reduce manual toil with smarter processes, tests, data freshness checks, and other solutions should be able to identify the issue before it surfaces downstream. When they don’t, it’s a strong indication that these failsafes are inadequate. Just as in the world of software engineering, automated solutions, like data observability and end-to-end monitoring, are your best bet in the fight against data downtime.
To get started, we’ve identified the four steps data teams must take when conducting RCA on their data pipelines:
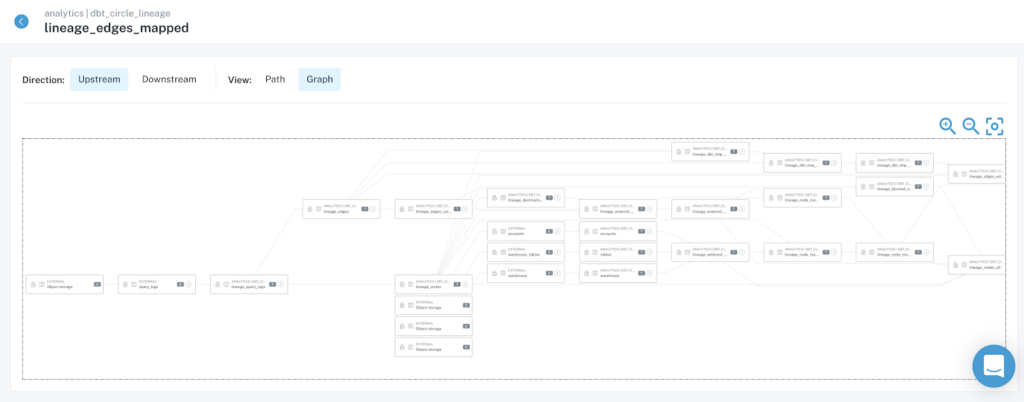
- Look at your lineage: To understand what’s broken, you need to find the most upstream nodes of your system that exhibit the issue – that’s where things started and that’s where the answer lies. If you’re lucky, the root of all evil occurs in the dashboard in question and you will quickly identify the problem.
- Look at the code: A peek into the logic that created the table, or even the particular field or fields that are impacting the incident, will help you come up with plausible hypotheses about what’s wrong.
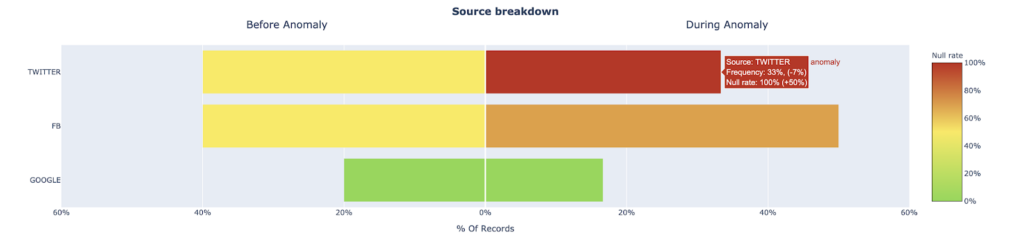
- Look at your data: After steps 1 and 2, it’s time to look at the data in the table more closely for hints of what might be wrong. One promising approach here is to explore how other fields in a table with anomalous records may provide clues as to where the data anomaly is occurring.
- Look at your operational environment: Many data issues are a direct result of the operational environment that runs your ETL/ELT jobs. A look at logs and error traces from your ETL engines can provide some answers.
(If you haven’t read it already, check out Francisco Alberini’s article on how data engineers can conduct root cause analysis — it’s well worth the read).
Once you identify that something has gone awry, understand its impact, determine root cause, and communicate next steps to the proper stakeholders, it’s time to fix the issue. This could be as easy as pausing your data pipelines or models and re-running them, but since data can break for millions of reasons, this often involves a fair amount of troubleshooting.
Suggested Resources:
- Root cause analysis, explained with examples and methods (Tableau)
- Root Cause Analysis in the Age of Industry 4.0 (Lior Kitain, Data Driven Investor)
- Field Guide for Production Readiness (Ian Smith, The New Stack)
Blameless post-mortem

One of my friends, a site reliability engineer with over a decade of experience firefighting outages at Box, Slack, and other Silicon Valley companies, told me that I couldn’t write an article about incident management without making this abundantly clear:
“For every incident, the system is what’s at fault, not the person who wrote the code. Good systems are built to be fault and human tolerant. It’s the system’s job to allow you to make mistakes.”
When it comes to data reliability and DataOps, the same ethos rings true. Pipelines should be fault-tolerant, with processes and frameworks in place to account for both known unknowns and unknown unknowns in your data pipeline.
Regardless of the type of incident that occured or what caused it, the data engineering team should conduct a thorough, cross-functional post-mortem after the they’ve fixed the problem has been fixed and conducted root cause analysis.
Here are a few best practices:
- Frame everything as a learning experience: To be constructive, post-mortems must be blameless (or if not, blame aware). It’s natural to try and assign “blame” for incidents, but it’s rarely helpful when it comes to instilling trust in your colleagues or fostering a collaborative culture. By reframing this experience around the goal of “learning and improvement,” it’s easier to proactively take the organizational (creating better workflows and processes) and technological steps (making a case for investing in new tools) necessary to eliminate data downtime.
- Use this as an opportunity to assess your readiness for future incidents: Update runbooks and make adjustments to your monitoring, alerting, and workflow management tools. As your data ecosystem evolves (adding new, third-party data sources, APIs, and even consumers), this step will become critical when it comes to incident prevention.
- Document each post-mortem and share with the broader data team: As in software engineering, documenting what went wrong, how systems were affected, and what the root cause is often an afterthought. But documentation is just as important as any other step in the incident management process because it prevents knowledge gaps from accruing if engineers with tribal knowledge leave the team or aren’t available to help.
- Revisit SLAs: In a previous article, I walked through why data teams need to set SLAs for their data pipelines. In a nutshell, service-level agreements (SLAs) are a method many companies use to define and measure the level of service a given vendor, product, or internal team will deliver—as well as potential remedies if they fail. As data systems mature or change over time, it’s important to consistently revisit your SLAs, service-level indicators (SLIs), and service-level objectives (SLOs). SLAs that made sense six months ago probably don’t any more; your team should be the first to know and communicate these changes with downstream consumers.
At the end of the day, post-mortems are just as important for data teams as they are for software engineers. As our field continues to advance (we’re in the decade of data, after all), understanding how and why data downtime occurs is the only way we can make continued improvements to the resiliency of our systems and processes.
Suggested Resources
- Blameless post-mortem culture at Google (John Lunney & Sue Lueder, Google SRE Handbook)
- Blameless Post-Mortems and a Just Culture (John Allspaw, Code as Craft)
- Postmortem Templates (Pavlos Ratis, GitHub)
++++
To quote our SRE predecessors: hope is not a strategy.
But with these best practices in place, you can turn incident management from an exercise in “poking around and hoping for the best” into a well-oiled, highly reliable machine.
Interested in learning more about how the data teams at Vimeo, Compass, Eventbrite, and other leading companies are preventing broken pipelines at scale with data observability? Reach out to Barr Moses and book a time to speak with us using the form below.
Our promise: we will show you the product.
Read more posts.