Product demo.
  What is data observability?
  What is a data mesh--and how not to mesh it up
  The ULTIMATE Guide To Data Lineage
 How Resident Reduced Data Issues by 90% with Monte Carlo

Will Robins
Will Robins is a member of the founding team at Monte Carlo.
Many data leaders tell us that their data scientists and engineers spend 40 percent or more of their time tackling data issues instead of working on projects that actually move the needle.
It doesn’t have to be this way. Here’s how the data engineering team at Resident, a house of direct-to-consumer furnishings brands, reduced their data incidents by 90% with data observability at scale.
Direct-to-consumer mattress brands may not be the first category that comes to mind when discussing data-driven companies. But Daniel Rimon, Head of Data Engineering at Resident, credits their investment in technology, data, and marketing with their recent success: in 2020, Resident achieved 100% growth and saw over $500M in gross sales, and received a $130M round of investing.
“When you hear mattresses, it doesn’t necessarily tell you data or technology, but that’s what our company is all about,” Daniel said. She currently sits on a data team with four analysts and three engineers, led by a VP of Data.
Resident relies on data to drive marketing decisions and spend, with over 20 marketing connections supporting lead and customer tracking, segmentation, and retail analytics. Daniel and her team now manage over 30,000 tables in Big Query and leverage a data tech stack that includes Monte Carlo, Google Cloud Platform, Airflow, Rivery, and other enterprise tools, conducting experiments and enabling the business to base decisions on data in real-time.
“We have a lot of data,” Daniel said. “It makes things very complicated, and very hard to track. And if any of the data that powers our operations becomes missing or broken, or something in those pipelines breaks, it can lead to really serious issues throughout the business.”
The challenge: connecting disparate data sources and understanding relationships between data assets

In 2019, when Daniel joined the company, Resident had been using BigQuery to analyze data about ad performance, tracking marketing spend, cost-of-goods, and sales.
“We had complicated queries, many duplications, inconsistent logic—it was quite a mess,” Daniel said. “We knew we were missing a lot of data and wanted to keep better track of our website through Google Analytics and Google Tag Manager. We didn’t have any monitoring, information about what’s going on in customer success, and found out we didn’t have connections to a lot of our marketing sources.”
The company suffered from unreliable data and strained relationships between teams. “Stakeholders and executives weren’t able to access the most up-to-date data they needed to make decisions,” said Daniel. “It also negatively impacted relationships between business units. For example, if you’re in data engineering, it can really strain relationships with a BI or analytics team.”
Beyond the company’s internal relationships, customer experience was hurting as well, with bad data leading to customers receiving emails that weren’t relevant to them.
At the time, Daniel and her team attempted to handle data issues manually. “We would base our strategy on memory, a few basic tools, and a lot of hope and help from our analysts or colleagues,” she said. The manual work led to duplicated views and processes, and the team didn’t have a clear understanding of what fields or tables affected downstream data consumers. The only notifications they had set up were basic failure alerts.
”My morning, or my boss’s morning, would start by opening every main dashboard to look for mistakes or stuff that doesn’t make sense,” said Daniel. “It was very primitive, very inefficient, and frustrating actually.”
Occasionally, Daniel recounts, something would get stuck in the back-end process that injects data into her team’s Big Query. And she wouldn’t know unless she had manually checked dashboards. “But sometimes the CEO of the company would Slack me and my boss and say, ‘What’s going on? Didn’t we have any sales?’ So that’s my nightmare—getting a message that “The data is off. The data is broken.” With no context, and I don’t know where to start, so you have to investigate and get to the core of it…that’s frustrating. And when you’re new to the company, it’s not so fun.” The time difference between the Israel-based data team and their US-based colleagues didn’t help matters.
Daniel’s boss knew the circumstances had to change, so Daniel was asked to build an entire data performance process from scratch. With an existing platform that hadn’t been well-maintained and proved difficult to debug, it was challenging work.
“I told my boss, ‘I wish there were someplace that I could take a table and see everything it connects to,” Daniel said. “I could know, it affects this and this, but not here, and here’s the dashboard it goes to ultimately. I need a very big map. There has to be some kind of thing like this!”
The solution: data observability
As Daniel and her team began to understand what they needed, rather than building out a custom system, Resident began using Monte Carlo to handle real-time monitoring and alerting, as well as lineage—that big map of data relationships that Daniel told her boss she needed.
Outcome: Fixing data issues before they impact data consumers through real-time monitoring and alerting
Monte Carlo uses machine learning to automatically set alerting parameters for tables, catching anomalies in freshness or volume for all of Resident’s tables, which Daniel estimates make up about 90% of their alerts.
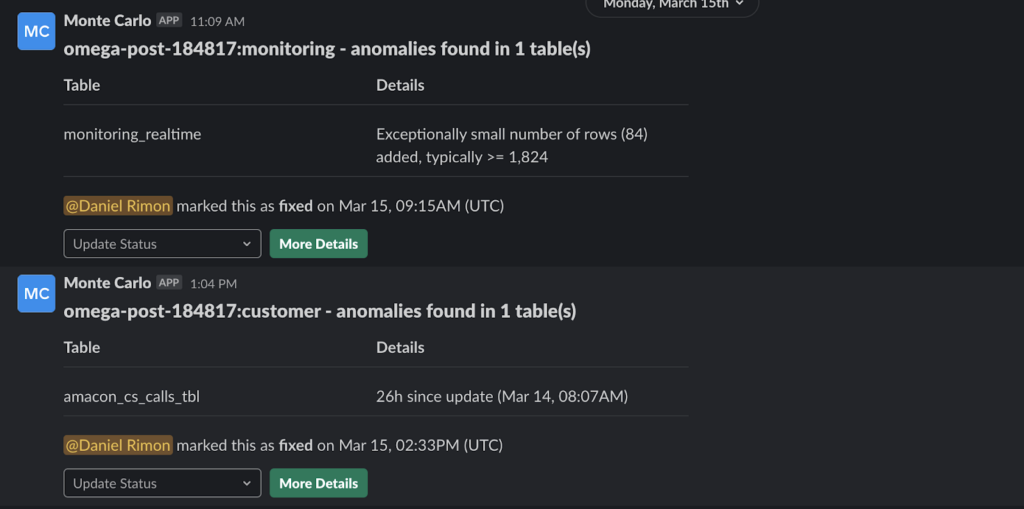
Now, instead of a panicked message from their CEO, Daniel and her team now receive Monte Carlo alerts in Slack for issues like a table updating with fewer rows than expected, or not updating at the expected time. They’re the first to know about problems, and engineers can easily update issue status to track progress.
Daniel can also define custom alerts, such as one she put in place for a particularly sensitive set of processes that relies on Google Analytics delivering data to their warehouse at a certain time every day. “It usually arrives around 7pm Israel time, but it’s not consistent. And I have to schedule specific processes to happen after, but if I miss it, I have to do it all over again. I start my process at 8pm, and the first step is to know that the Google Analytics update happened. If it’s missing, I get a Slack alert message so I can stop, figure out what happened, and fix it. I had to check this manually before MC and it was really annoying. It took me 20 seconds to set up this alert and it’s so easy.”
Outcome: Preventing “data disasters” with automated lineage
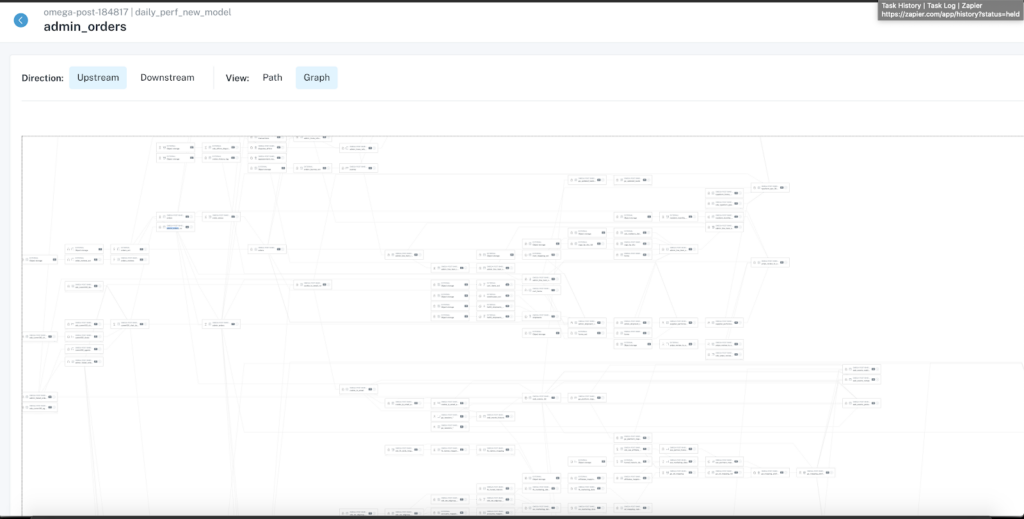
The automated lineage is a huge plus for Daniel and her team. “It takes me nothing to maintain this lineage. If I want some advanced monitoring, I can define that, but nothing is required for me to get this level of lineage. It’s the dream.”
To create the lineage graph, Monte Carlo automatically parses the SQL out of the query logs in BigQuery, and extends the lineage through a connector to Looker and Github. The lineage automatically updates as the data evolves.
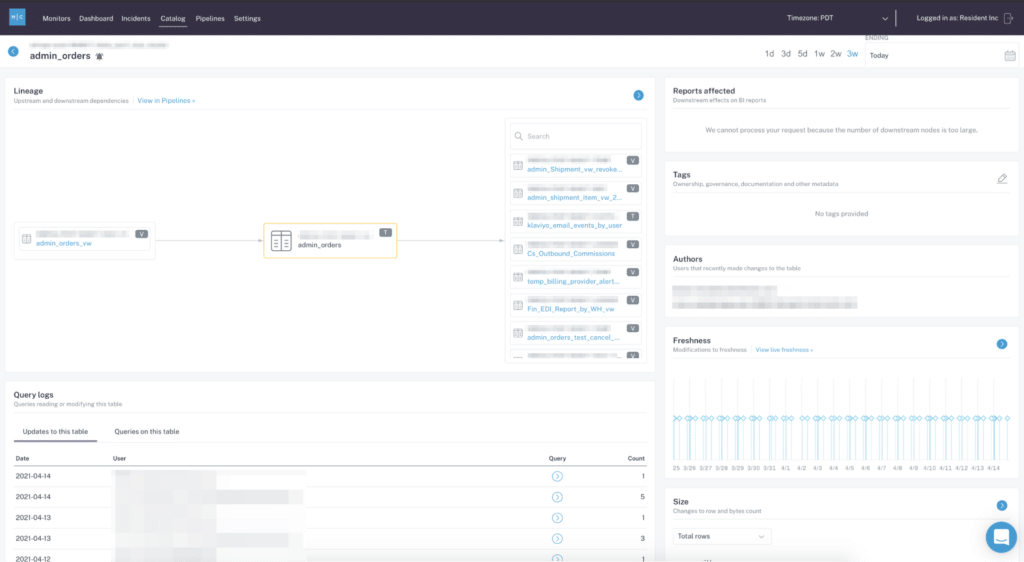
Daniel’s favorite use case is a table called “Admin Orders”, which contains all the information about orders. “This is my favorite table, and I can see a lot of information about how it behaves, like the other tables and views that feed it.” She can understand what changes were made in the past. She can also see the downstream views that will be affected by changes to Admin Orders, and what Looker dashboards are ultimately connected to her table, so she can collaborate with her analysts and engineers to understand the impact of any changes.
”Because they built those views—not me,” said Daniel. “We can collaborate together and make sure we prevent data disasters before we make them.”
Outcome: Trust in data at each stage of the pipeline
Resident’s data team has seen a 90% decrease in data issues since implementing Monte Carlo. With executive and stakeholder trust in data restored, Resident plans to build more and more data products and further enrich their data. Daniel’s team is integral to the company’s future: ”There isn’t any process in the company that happens without us. And people trust and believe our data because it’s reliable and it’s good. Even if it’s complicated, we have the tools to monitor it in real-time and make it more reliable.”
The impact of data observability at Resident
Among other benefits of data observability, Monte Carlo has positively impacted Resident by:
- Automating manual processes so the data team can focus time and efforts on innovation and improvements, not fire-fighting
- Shortening time-to-detection when data issues arise through automated and custom alerting
- Preventing downstream breakages through automated lineage and improved collaboration
- Restoring trust in data and enabling better decision-making by ensuring executives have the accurate information they need to drive the business forward
“Before Monte Carlo, I was always on the watch and scared that I was missing something,” said Daniel. “I can’t imagine working without it now. We have 10% of the incidents we had a year ago. Our team is super reliable, and people count on us. I think every data engineer has to have this level of monitoring in order to do this work in an efficient and good way.”
Interested in learning how data observability can help you restore trust in your data and reclaim valuable engineering time? Reach out to Will Robins and book a time to speak with us using the form below.
Special thanks to Daniel and Resident!
Our promise: we will show you the product.
Read more posts.