Product demo.
  What is data observability?
  What is a data mesh--and how not to mesh it up
  The ULTIMATE Guide To Data Lineage
 How to achieve more reliable analytics with the Monte Carlo integration for Looker

Barr Moses
CEO and Co-founder, Monte Carlo. Proponent of data reliability and action movies.
As companies increasingly leverage data-driven insights to drive innovation and maintain their competitive edge, it’s important that their data is accurate and trustworthy. With Monte Carlo’s Looker integration, data teams can now identify and prevent inaccurate, missing, or erroneous data from breaking your analytics dashboards, delivering more reliable insights.
Does this situation ring a bell?
Your Marketing Analytics team uses Looker to visualize how many sales qualified leads are generated per day as a result of a new billboard in New York City’s Time Square. Minutes before a Q4 planning meeting with their CEO, the VP of Marketing pings you: “The data is all wrong… what happened?!”
You open Looker and realize the numbers, which are normally updated every 15 minutes, haven’t been touched in 24 hours!
While powerful solutions exist to deliver data analytics on top of existing data, many data teams cite data quality and integrity as key pain points, costing them millions of dollars in wasted revenue and up to 50 percent of their team’s time. Instead of working on projects that actually move the needle for their company, data professionals are forced to debug data pipelines and firefight broken dashboards.
To address this all-too-common reality, data analysts, engineers, and scientists need an easy and collaborative way to monitor and alert for abnormalities in their data, from ingestion to analytics. It’s also important they have the tools necessary to map their data lineage, keeping tabs on how changes in their data pipelines affect downstream sources, such as analytics and business intelligence reports.
With this new integration, Looker and Monte Carlo have teamed up to streamline this process and give data teams visibility into their data health through full, end-to-end data observability.
How good data goes bad
Bad data spares no one, and can crop up in a variety of ways, causing sleepless nights, wasted resources, and erosion of data trust.
Nowadays, companies use anywhere from dozens to hundreds of internal and external data sources to produce analytics and ML models. Any one of these sources can change in unexpected ways and without notice, compromising the data your company uses to make decisions.
Data pipelines are also growing increasingly complex with multiple stages of processing and non-trivial dependencies between various data assets. With little visibility into these dependencies, any change made to one data set can have unintended consequences impacting the correctness of dependent data assets.
And finally, as companies increasingly rely on data to drive smart decision making, they are hiring more and more data analysts, scientists, and engineers to build and maintain the data pipelines, analytics, and ML models that power their services and products, as well as their business operations. Miscommunication or insufficient coordination is inevitable, and will cause these complex systems to break as changes are made.
The solution to bad data? Data observability, as delivered through Looker and Monte Carlo.
Ensuring reliable insights with data observability
The Looker integration for Monte Carlo enables users to seamlessly monitor and alert for issues with the data feeding their Looker dashboards, giving them a holistic view of the health and reliability of their data assets.
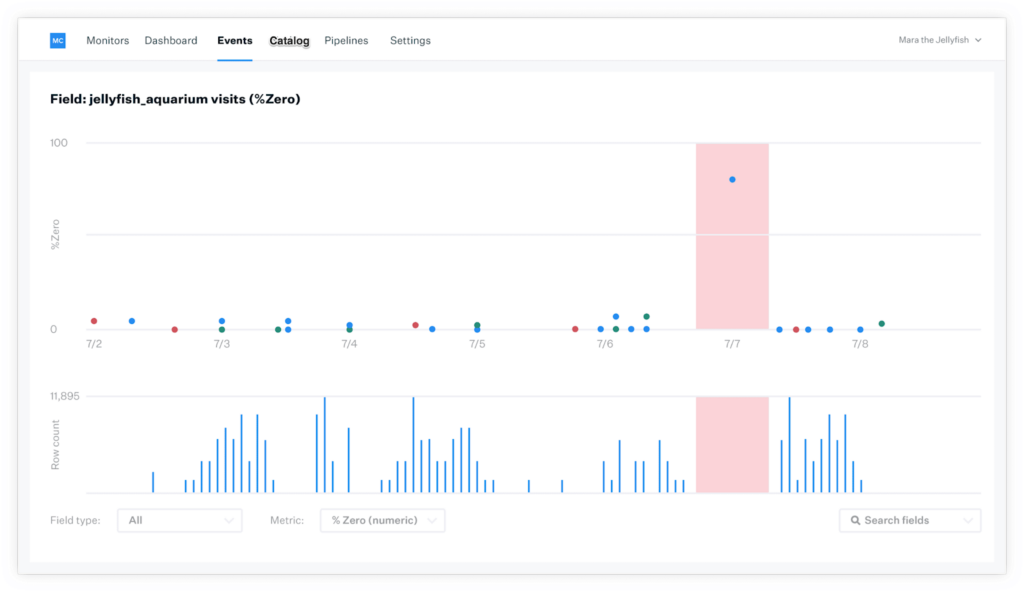
The Monte Carlo data observability engine automatically monitors across key features of your data ecosystem, including data freshness, distribution, volume, schema, and lineage. Without the need for manual threshold setting, Monte Carlo answers such questions as:
- When was my table last updated?
- Is my data within an accepted range?
- Is my data complete? Did 2,000 rows suddenly turn into 50?
- Who has access to our marketing tables and made changes to them?
- Where did my data break? Which tables or reports were affected?
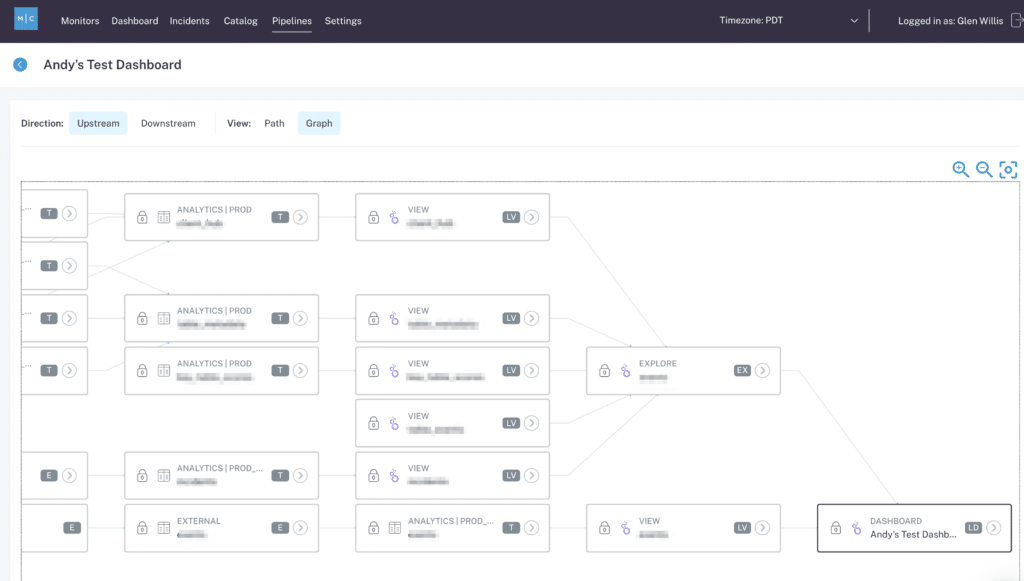
With this partnership, mutual customers can now trace field-level lineage all the way down to Looks, Explores, Reports, and Dashboards, facilitating greater visibility into the health of their data pipelines and the insights those pipelines deliver. Such functionality allows data engineers, analysts, and scientists to identify why their Looker dashboards aren’t pulling the freshest data for your stakeholders (i.e., is there a missing data set? A null value? Did someone use the CSV file type instead of XLS?).
One such customer, Compass, uses Monte Carlo to keep tabs on the upstream and downstream dependencies for their Looker dashboards.
“Monte Carlo’s monitoring feed gives me comfort that our Looker dashboards are healthy and everything’s working as designed. And on days where something goes wrong, I know my team will be the first to know and that we’ll be in command of the situation,” said Suvayan Roy, Senior Product Manager, Compass.
We look forward to continuing our partnership with Looker to stop bad data in its tracks and deliver data observability to companies worldwide.
Want to learn more about how data observability can help your data team? Book a time to speak with us using the form below.
Our promise: we will show you the product.
Read more posts.