Product demo.
  What is data observability?
  What is a data mesh--and how not to mesh it up
  The ULTIMATE Guide To Data Lineage
 Data Observability: Five Quick Ways to Improve the Reliability of Your Data


Brandon Gubitosa
Brandon Gubitosa is a content marketing manager at Monte Carlo. He loves data, sports, and NYC pizza, not necessarily in that order.
If your data breaks, does it make a sound?
Odds are, the answer is yes. But will you hear it? Probably not.
Nowadays, organizations ingest large amounts of data across increasingly complex ecosystems, and very often their data breaks silently, and as a result data teams are left in the dark – until it’s too late.
But, if said data is a report used by your Chief Revenue Officer to determine next quarter’s forecast, chances are this data will make a very, very large sound. It may even be magnified by a few early morning phone calls and urgent Slack pings.
Sound familiar? Fortunately, data doesn’t have to be silent.
Enter Data observability, an emerging – and increasingly important – layer of the modern data stack, is critical for helping data teams understand and improve data health, and in many cases prevent these data disasters from occurring in the first place.
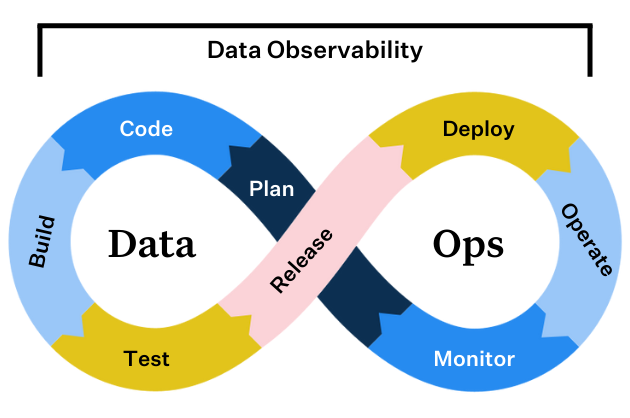
In DevOps, engineers rely on both testing and observability to tackle application downtime and ensure consistent uptime. In the same way that software has become critical to an organization’s ability to innovate, data has also become foundational to decision making and product development. Similarly, a strong approach to ensuring data uptime and reducing data downtime (in other words, periods of time where data is missing, inaccurate, or otherwise erroneous) involves both data testing and observability.
With the right approach, data observability can even help you understand which data sets matter most to your organization (i.e., which data sets and pipelines make the loudest sound when they break) and which ones can be deprecated.
Before we dive into five common data observability use cases, let’s clarify what we mean by “data observability” in the first place.
What is data observability?
Data observability, an organization’s ability to fully understand the health of the data in their ecosystem, eliminates data downtime by applying best practices of DevOps and application observability to data pipelines. Like its DevOps counterpart, data observability uses automated monitoring, alerting, and triaging to identify and evaluate data quality and discoverability issues, leading to healthier pipelines, more productive teams, and happier customers. To make it easy, we have broken down data observability into its own five pillars: freshness, distribution, volume, schema, and lineage. Together, these components provide valuable insight into the quality and reliability of your data.

- Freshness: Freshness seeks to understand how up-to-date your data tables are, as well as the cadence at which your tables are updated. Freshness is particularly important when it comes to decision-making; after all, stale data is basically synonymous with wasted time and money.
- Distribution: Distribution, in other words, a function of your data’s possible values, tells you if your data is within an accepted range. Data distribution gives you insight into whether or not your tables can be trusted based on what can be expected from your data.
- Volume: Volume refers to the completeness of your data tables and offers insights into the health of your data sources. If 200 million rows suddenly turns into 5 million, you should know.
- Schema: Changes in the organization of your data, in other words, schema, often indicates broken data. Monitoring who makes changes to these tables and when is foundational to understanding the health of your data ecosystem.
- Lineage: When data breaks, the first question is always “where?” Data lineage provides the answer by telling you which upstream sources and downstream ingestors were impacted, as well as which teams are generating the data and who is accessing it. Good lineage also collects information about the data (also referred to as metadata) that speaks to governance, business, and technical guidelines associated with specific data tables, serving as a single source of truth for all consumers.
Five reasons your organization should invest in data observability
These five reasons just scratch the surface of how investing in observability can help your team improve data quality at scale and trust your data faster than testing alone.
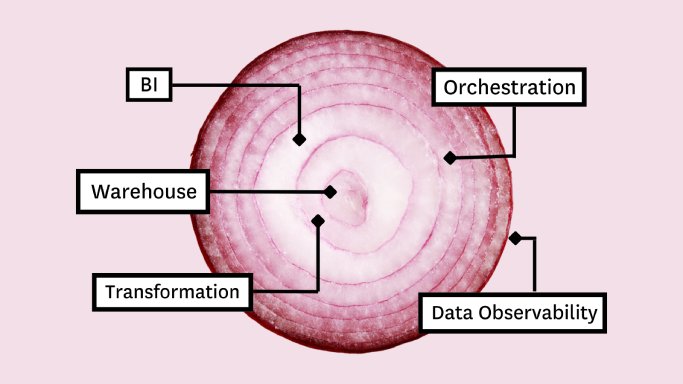
1. Full-stack coverage from ingestion to the BI layer
Modern data environments are incredibly complex, with data continuously flowing in from a variety of sources, oftentimes from “external” sources that can change without notice. That data is then shipped off into some sort of data storage component (whether that’s a data lake vs data warehouse or even a data lakehouse), and then propagated into a BI layer where it is consumed by a stakeholder. Throughout this time, data is transformed, often more than once.
And despite how great your data pipelines are, the reality is that data can break at any stage of its life cycle. Whether as a result of a change or issue at the source, or an adjustment to one of the steps in your pipeline, or complex interaction between multiple pipelines, data can break for reasons you cannot control. Data observability allows you to have end-to-end visibility into breakages across your pipelines.
Outcome: ML-powered coverage of high priority tables
Alex Soria, VP of Data & Analytics at Mindbody, leads a team of over 25 data scientists, business intelligence analysts, and data engineers responsible for ensuring that the insights powering their product is fresh and reliable.
Before implementing data observability, Mindbody had no way of identifying data irregularities until it was too late. By implementing a data observability solution across their Redshift warehouse and Tableau dashboards, they are now the first ones to find out about abnormalities in the lifecycle and duplicate data.
With data observability, they are able to effectively monitor 15 high-priority tables out of 3,000+ that are automated and detect and alert for anomalies with schema, freshness, and volume.
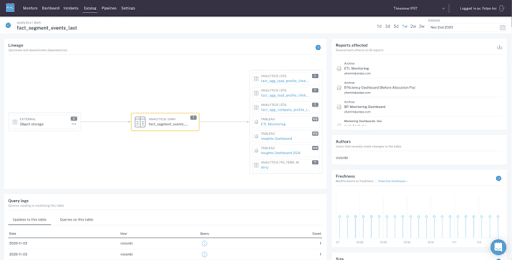
2. End-to-end field-level lineage across your data ecosystem
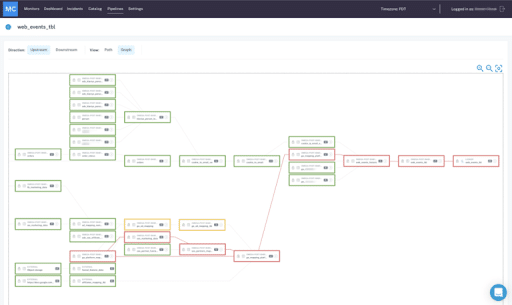
End-to-end lineage powered by metadata gives you the necessary information to not just troubleshoot broken pipelines, but also understand the business applications of your data at every stage in its life cycle. Image courtesy of Monte Carlo.
With complex data pipelines and ever-changing data ecosystems, it is a necessity to track your upstream and downstream dependencies. End-to-end lineage empowers data teams to track the flow of their data from point A (ingestion) all the way to point Z (analytics), incorporating transformations, modeling, and other steps in the process. Essentially, lineage gives your team a birds-eye view of your data and allows you to understand where it came from, who interacted with it, any changes that were made, and where it is ultimately served to end consumers.
But lineage for the sake of lineage is useless. Teams need to ensure that the data being mapped is 1) accurate and 2) relevant to the business.
Outcome: fast triaging and incident resolution for data issues
Manchester-based Auto Trader is the largest digital automotive marketplace in the United Kingdom and Ireland. For AutoTrader, connecting millions of buyers with thousands of sellers involves an awful lot of data.
On top of wanting to add automated monitoring and alerts, Auto Trader needed a way to track which tables in BigQuery are surfaced in specific reports in Looker, the most visible layers of their data stack. With data observability and automated end-to-end lineage, the team at AutoTrader is able to investigate issues quickly and efficiently as they have a better understanding of what broke, what else is impacted, and who else should be notified of issues and resolutions.
3. Impact analysis for broken reports and pipelines
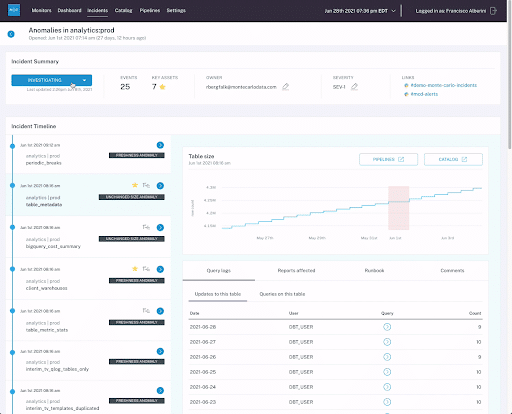
By gaining end-to-end visibility into the health, usage patterns, and relevancy of data assets your data team is able to faster troubleshoot data issues. With time being of the essence when responding to data incidents, data observability allows your team to troubleshoot issues and understand the impact far quicker than traditional, manual approaches.
Outcome: conduct root cause analysis for missing, stale, or inaccurate data in minutes, instead of hours or days
Hotjar, a global product experience insights company, data powers a wide variety of use cases, from crafting the ideal marketing campaign to creating delightful product features. Their data engineering team supports over 180 stakeholders and their data needs, from deploying models and building pipelines to keeping tabs on data health. When data downtime happens, they needed a way to keep tabs on what was happening and what else up and downstream was affected by the issue. To understand what was causing the downtime, they leveraged one of the key components of data observability, end-to-end lineage to understand upstream and downstream dependencies related to the issue. Now, their team could do an impact assessment and identify the root cause of the issue faster and more efficiently. From there, the team could correct the course and identify those who need to know about the incident.
4. Monitoring and alerting that scales with your data ecosystem
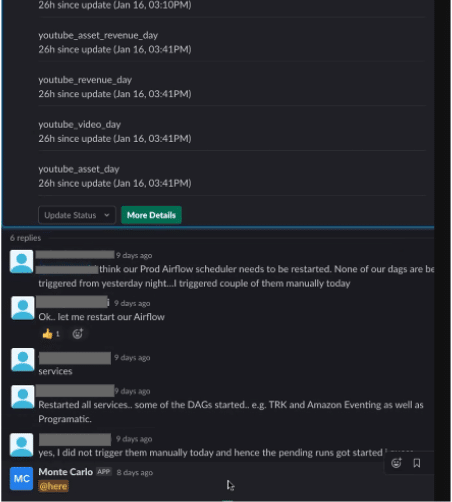
When data breaks, your team should be the first to know. Nothing is more embarrassing for a data worker when they are constantly getting emails and messages about data issues that are uncovered by a stakeholder when looking at a report. Data observability ensures your team is the first to know and solve data issues, so you can address the effects of data downtime right away. Ideally, these alerts should be automatic and require minimal effort on your part to get up and running (which is great for scaling alongside your data stack).
Outcome: increase innovation, decrease time spent fixing pipelines
Blinklist, a book-summarizing subscription service benefits from automated monitoring and alerting of critical data assets, saving on average 120 hours per week. Through the use of machine learning algorithms to generate thresholds and rules for data downtime alerting, each engineer on the team saves up to 20 hours per week, which is now spent building out product features and dashboards for end-users.
5. Easier collaboration among data engineers, data analysts, and data scientists
Arguably one of the most commonly utilized benefits data teams experience as a result of data observability is increased collaboration amongst team members. A best-in-class data observability platform facilitates transparency in data quality across every data stakeholder. Instead of each function having its own siloed way of staying on top of data quality issues, a data observability platform enables all data engineers, data scientists, and data analysts to better understand data health and collaborate on improving data quality.
Outcome: decentralized, self-serve governance across teams and more reliable data
Optoro is a technology company that leverages data and real-time decision-making to help retailers and manufacturers manage and resell their returned and excess merchandise. By adopting a data observability platform, the team has saved an estimated 44 hours per week on support tickets investigating bad data. And, since all data team members can access self-service monitoring and alerting, data catalog views, and lineage, data analysts across other domains are now able to step up and take more ownership of data and take accountability for the products they ship.
Interested in learning more about how data observability can help your team? Book a time to speak with us using the form below.
Our promise: we will show you the product.
Read more posts.