Product demo.
  What is data observability?
  What is a data mesh--and how not to mesh it up
  The ULTIMATE Guide To Data Lineage
 What is Data Observability? 5 Key Pillars To Know

Barr Moses
CEO and Co-founder, Monte Carlo. Proponent of data reliability and action movies.
Editor’s Note: So much has happened since we first published this post and created the data observability category and Monte Carlo in 2019. We have updated this post to reflect this rapidly maturing space. You can read the original article linked at the bottom of this page.
What is Data Observability?
I coined the term data observability in 2019. Here is how I define it today:
Data observability provides full visibility into the health of your data AND data systems so you are the first to know when the data is wrong, what broke, and how to fix it.
The solutions in this category feature machine learning anomaly detection, accelerated root cause analysis capabilities, and end-to-end data lineage. This approach results in healthier data pipelines, increased team productivity, enhanced data management practices, and ultimately, higher customer satisfaction.
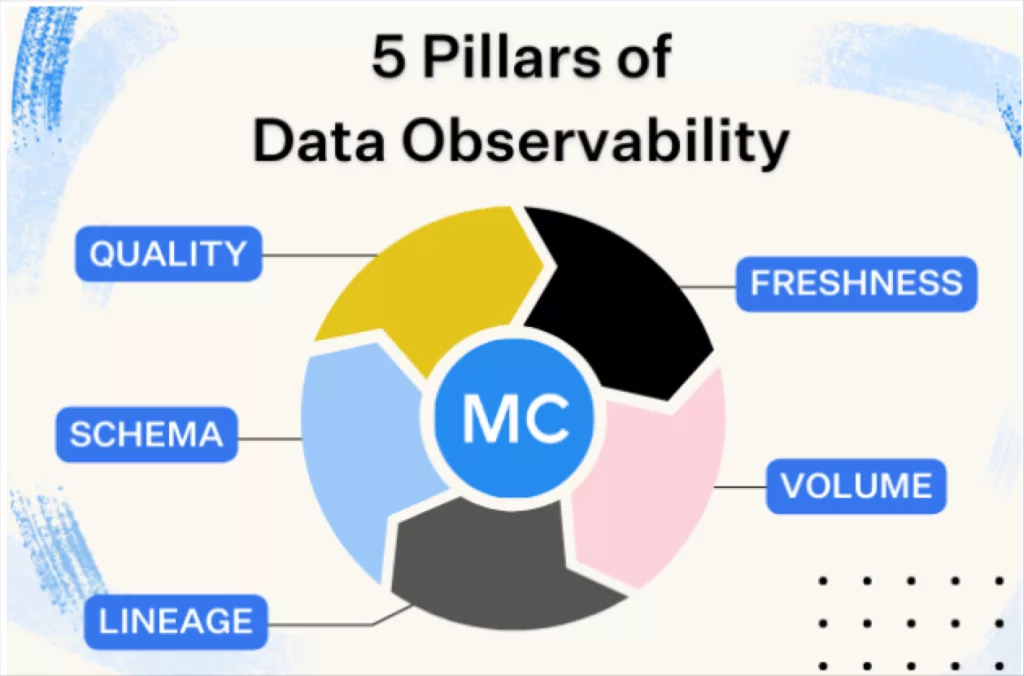
The five pillars of data observability are:
- Freshness
- Quality
- Volume
- Schema
- Lineage
Together, these components provide valuable insight into the quality and reliability of your data.
In this post, I’ll dive into these concepts in more detail, including what data observability is, what data observability isn’t, who it’s for, and how to choose the right data observability solution for your platform.
Let’s jump in.
Table of Contents
The origins of data observability
I started thinking about the concept that I would later label “data observability” when I was serving as the former VP of Customer Success Operations at Gainsight.
Time and again, we’d deliver a report, only to be notified minutes later about issues with our data. It didn’t matter how strong our ETL pipelines were or how many times we reviewed our SQL: our data just wasn’t reliable.
Unfortunately, this problem wasn’t unique. After speaking with hundreds of data leaders about their biggest pain points, I learned that data downtime tops the list.
Data downtime — periods of time when data is partial, erroneous, missing, or otherwise inaccurate — only multiplies as data systems become increasingly complex, supporting an endless ecosystem of sources and consumers.
Much in the same way DevOps applies observability to software, I thought it was time data teams leveraged this same blanket of diligence and began creating the category of data observability as a more holistic way to approach data quality.
And along with defining the category, I defined 5 key pillars that define data observability to this day.
What are the five pillars of data observability?
“Observability” is a concept many data leaders are probably familiar with from DevOps, but when it comes to data, what is it that we’re actually observing?
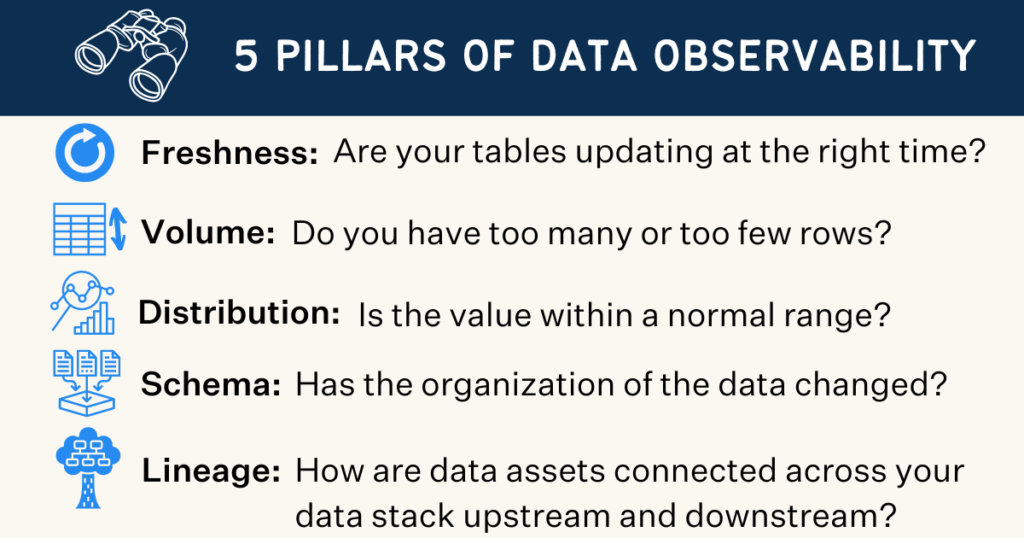
Now, let’s take a look at each of these five pillars in a bit more detail.
Freshness
Freshness seeks to understand how up-to-date your data tables are, as well as the cadence at which your tables are updated. Freshness is particularly important when it comes to decision making; after all, stale data is basically synonymous with wasted time and money.
Quality
Your data pipelines might be in working order but the data flowing through them could be garbage. The quality pillar looks at the data itself and aspects such as percent NULLS, percent uniques and if your data is within an accepted range. Quality gives you insight into whether or not your tables can be trusted based on what can be expected from your data.
Volume
Volume refers to the completeness of your data tables and offers insights on the health of your data sources. If 200 million rows suddenly turns into 5 million, you should know.
Schema
Changes in the organization of your data, in other words, schema, often indicates broken data. Monitoring who makes changes to these tables and when is foundational to understanding the health of your data ecosystem.
Lineage
When data breaks, the first question is always “where?” Data lineage provides the answer by telling you which upstream sources and downstream ingestors were impacted, as well as which teams are generating the data and who is accessing it. Good lineage also collects information about the data (also referred to as metadata) that speaks to governance, business, and technical guidelines associated with specific data tables, serving as a single source of truth for all consumers.
Why is data observability important?
Data observability is important for two reasons. For data engineers (and developers), data observability is important because data downtime means wasted time and resources; for data consumers, it’s equally as important because it erodes confidence in decision making.
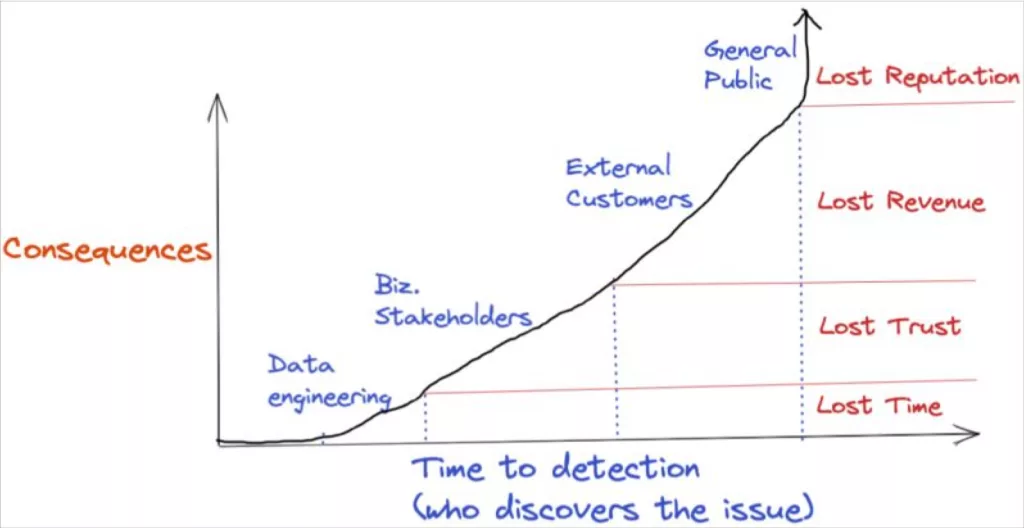
In that sense, the value of data pipeline monitoring and data observability is near priceless. That being said, it’s unlikely the chief financial officer is going to accept “priceless” when you are building your business case. So let’s take a look at how data teams have measured data quality.
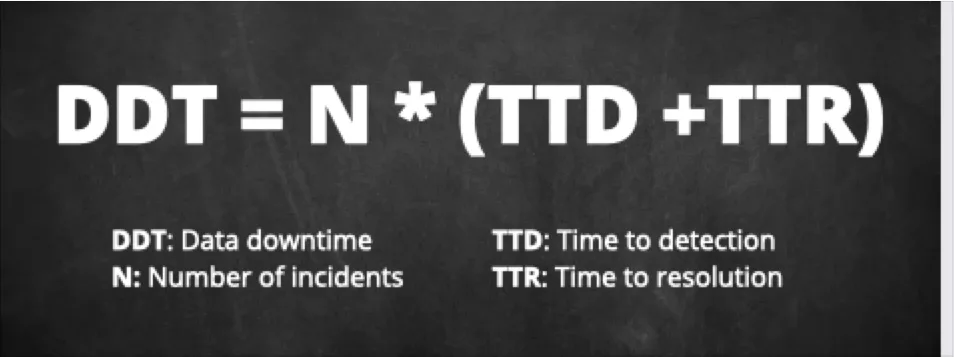
A simple calculation for the estimated number of incidents you have each year (whether you are currently catching them or not) can be done by dividing the number of tables you have in your environment by 15.
You can then multiply this number by your average time-to-detection and average time-to-resolution. If you aren’t currently capturing these metrics, don’t worry, you are not alone.
Our industry research revealed the industry average is about 4 hours and 9 hours respectively–feel free to use or adjust those estimates based on your organization’s data quality maturity.
Congratulations, you have just calculated your data downtime! Now let’s calculate its cost, and thus the value of a data observability solution.
The first part of the calculation, labor cost, is relatively straightforward. Since we know data quality professionals spend around 40% of their time on inefficient data quality practices, we can use this formula:
Total data engineers x 1804 (average working hours in a year) x $62 (average salary) x .4
The operational cost of poor data quality is a bit harder to quantify. A data incident can be as harmless as a broken dashboard no one uses or as painful as reporting incorrect numbers to Wall Street.
One way to estimate this is to measure the overall risk. If an organization invests in its data team to increase overall efficiency 10% (or insert your own value here) then for each hour of data downtime we can assume the organization’s productivity has been reduced 10%. The formula is then:
Overall data downtime x % reduction in hourly revenue generated.
We put together a data observability value calculator to help.
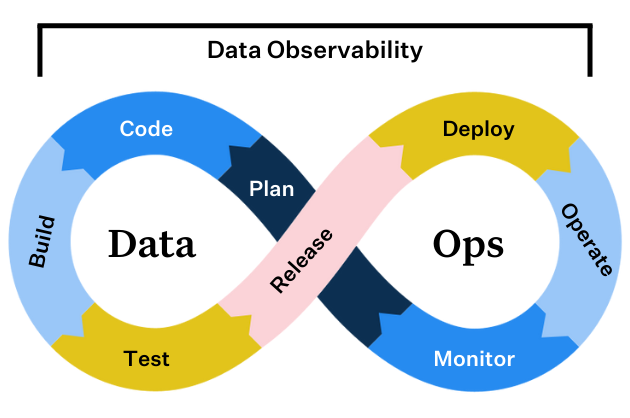
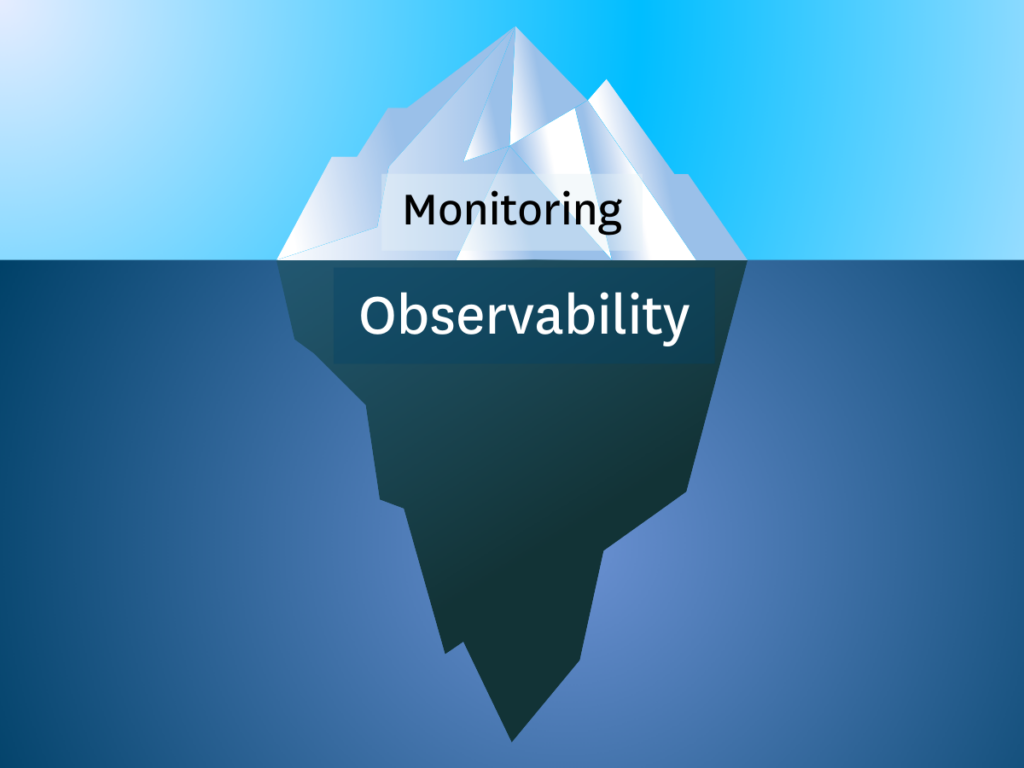
Data observability is as essential to DataOps as observability is to DevOps
As organizations grow and the underlying tech stacks powering them become more complicated (think: moving from a monolith to a microservices architecture), it became important for DevOps teams within the software engineering department to maintain a constant pulse on the health of their systems and deploy continuous integration and development (CI/CD) approaches.
Observability, a more recent addition to the software engineering lexicon, speaks to this need, and refers to the monitoring, tracking, and triaging of incidents to prevent software application downtime.
At its core, there are three pillars of observability data :
- Metrics refer to a numeric representation of data measured over time.
- Logs, a record of an event that took place at a given timestamp, also provide valuable context regarding when a specific event occurred.
- Traces represent causally related events in a distributed environment.
(For a more detailed description of these, I highly recommend reading Cindy Sridharan’s landmark post, Monitoring and Observability).
Taken together, these three pillars and application management (APM) solutions like DataDog or Splunk, gave DevOps teams and software engineers valuable awareness and insights to predict future behavior, and in turn, trust their IT systems to meet SLAs.
Data engineering teams needed similar processes and tools to monitor their ETL (or ELT) pipelines and prevent data downtime across their data systems. Enter data observability.
For data engineers and developers, data observability is important because data downtime means wasted time and resources; for data consumers, it erodes confidence in your decision making.
The key features of data observability tools
Evaluation criteria can be tricky when you may not even have a strong answer to the basic question, “what are data observability tools?” You can see what analysts have used as data observability criteria as well a a sample RFP, but in short a great data observability platform has the following features:
- It connects to your existing stack quickly and seamlessly and does not require modifying your data pipelines, writing new code, or using a particular programming language. This allows quick time to value and maximum testing coverage without having to make substantial investments.
- It monitors your data at-rest and does not require extracting the data from where it is currently stored. This allows the data observability solution to be performant, scalable and cost-efficient. It also ensures that you meet the highest levels of security and compliance requirements.
- It requires minimal configuration and practically no threshold-setting. Data observability tools should use machine learning models to automatically learn your environment and your data. It uses anomaly detection techniques to let you know when things break. It minimizes false positives by taking into account not just individual metrics, but a holistic view of your data and the potential impact from any particular issue. You do not need to spend resources configuring and maintaining noisy rules within your data observability platform.
- It requires no prior mapping of what needs to be monitored and in what way. It helps you identify key resources, key dependencies and key invariants so that you get broad data observability with little effort.
- It provides rich context that enables rapid triage and troubleshooting, and effective communication with stakeholders impacted by data reliability issues. Data observability tools shouldn’t stop at “field X in table Y has values lower than Z today.”
- It prevents issues from happening in the first place by exposing rich information about data assets so that changes and modifications can be made responsibly and proactively.
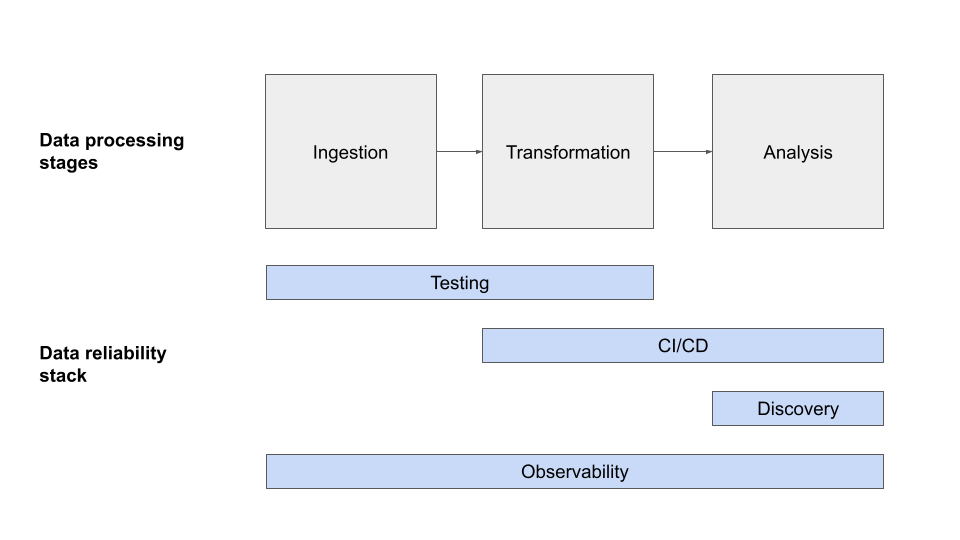
Data observability vs. data testing
Similar to how software engineers use unit tests to identify buggy code before it’s pushed to production, data engineers often leverage tests to detect and prevent potential data quality issues from moving further downstream.
This approach was (mostly) fine until companies began ingesting so much data that a single point of failure just wasn’t feasible.
I’ve encountered countless data teams that suffer consistent data quality issues despite a rigorous testing regime. It’s deflating and a bad use of your engineers’ time.
The reason even the best testing processes are insufficient is because there are two types of data quality issues: those you can predict (known unknowns) and those you can’t (unknown unknowns).
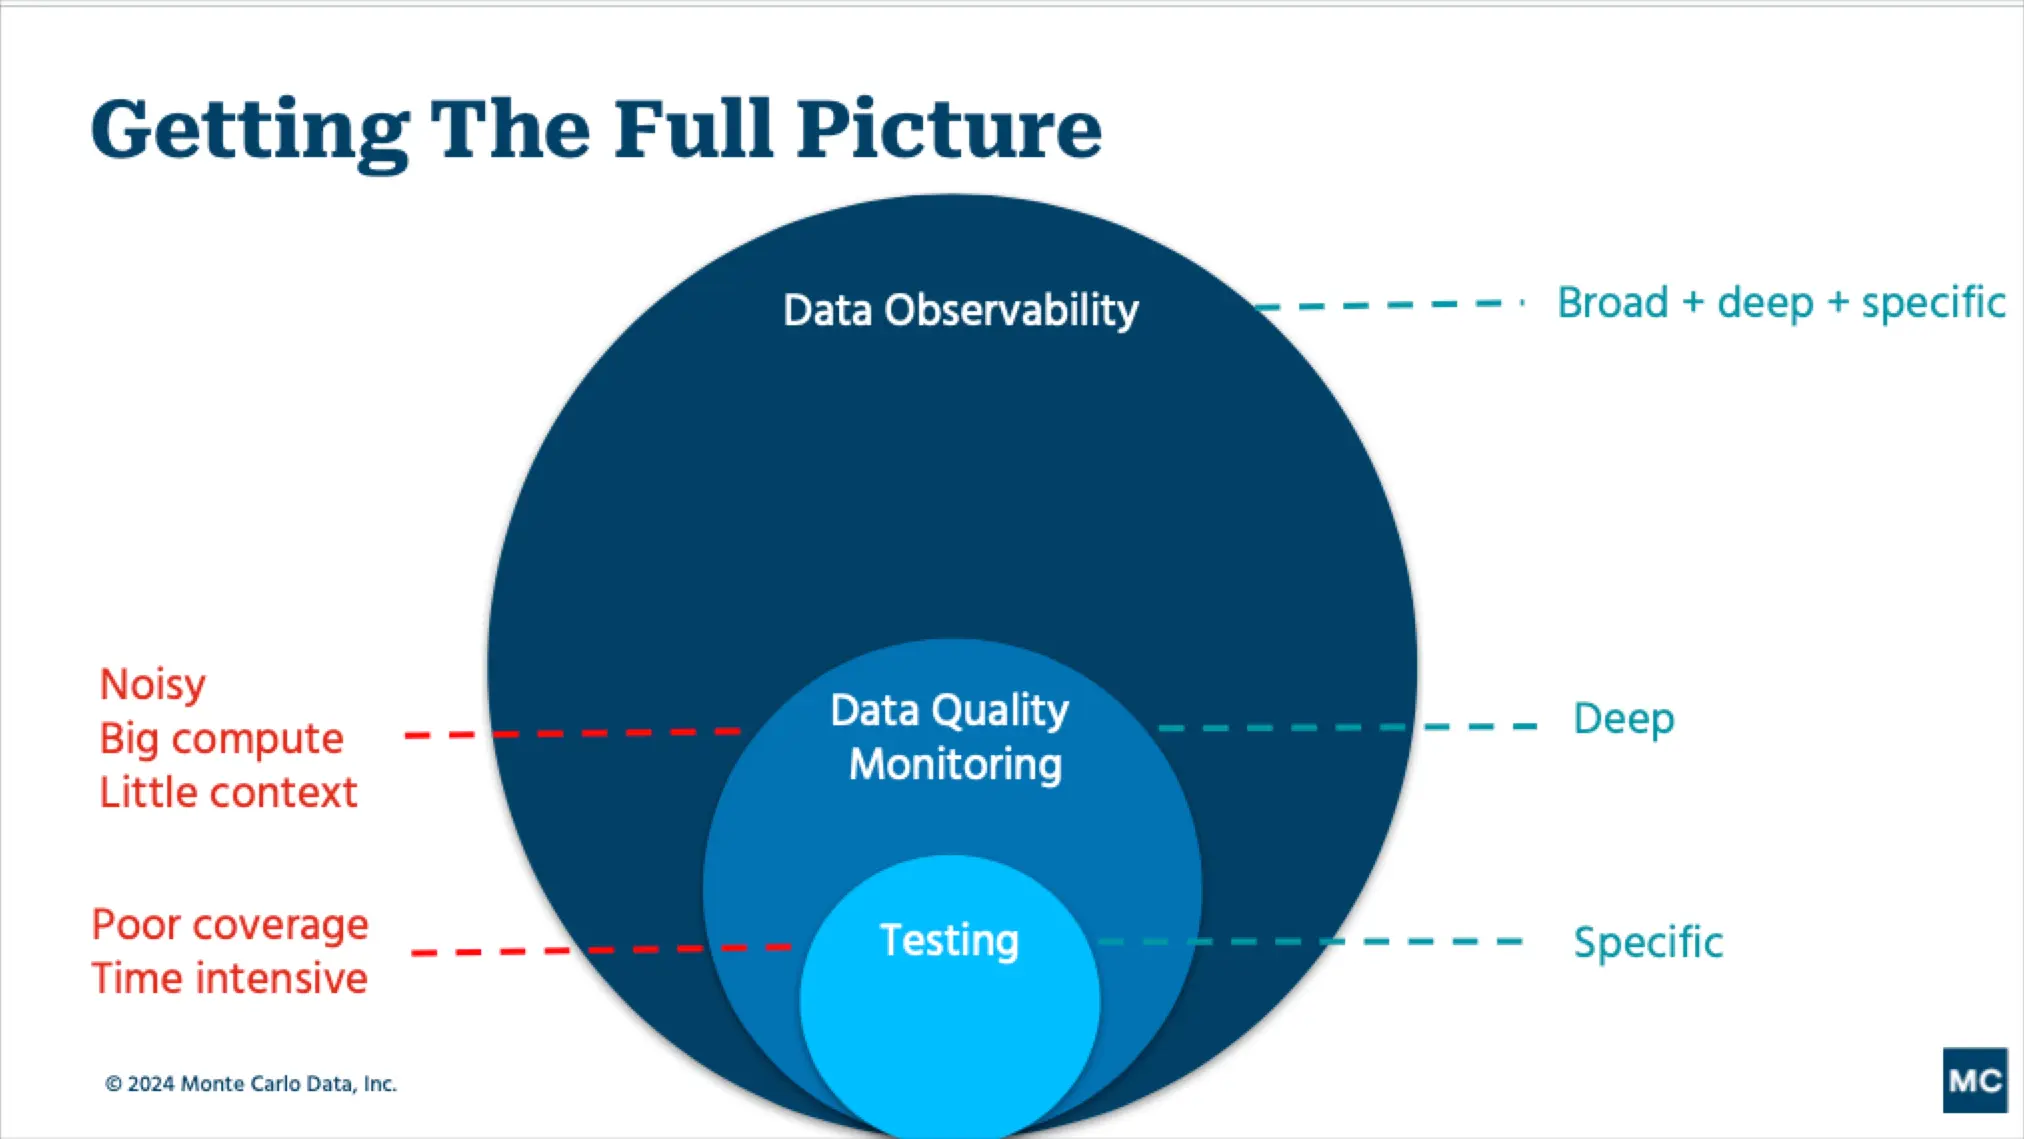
Some teams will have hundreds(!) of tests in place to cover most known unknowns but they don’t have an effective way to cover unknown unknowns.
Some examples of unknown unknowns covered by data observability include:
- A Looker dashboard or report that is not updating, and the stale data goes unnoticed for several months—until a business executive goes to access it for the end of the quarter and notices the data is wrong.
- A small change to your organization’s codebase that causes an API to stop collecting data that powers a critical field in your Tableau dashboard.
- An accidental change to your JSON schema that turns 50,000 rows into 500,000 overnight.
- An unintended change happens to your ETL, ELT or reverse ETL that causes some tests not to run, leading to data quality issues that go unnoticed for a few days.
- A test that has been a part of your pipelines for years but has not been updated recently to reflect the current business logic.
In a Medium article, Vimeo Senior Data Engineer Gilboa Reif describes how using data observability and dimension monitors at scale help address the unknown unknowns gap that open source and transformation tools leave open.
For example, if the null percentage on a certain column is anomalous, this might be a proxy of a deeper issue that is more difficult to anticipate and test.
Choozle CTO Adam Woods says data observability gives his team a deeper insight than manual testing or monitoring could provide.
Without a [data observability tool], we might have monitoring coverage on final resulting tables, but that can hide a lot of issues. You might not see something pertaining to a small fraction of the tens of thousands campaigns in that table, but the [customer] running that campaign is going to see it. With [data observability] we are at a level where we don’t have to compromise. We can have alerting on all of our 3,500 tables.
To summarize, data observability is different and more effective than testing because it provides end-to-end coverage, is scalable, and has lineage that helps with impact analysis.
Data observability vs. data monitoring
Data pipeline monitoring involves using machine learning to understand the way your data pipelines typically behave, and then send alerts when anomalies occur in that behavior (see the 5 pillars).
Some tools within the modern data stack, like Airflow for instance, will have the ability to monitor their portion of the ETL pipeline. While helpful, data teams need to monitor their entire pipeline end-to-end from ingestion to landing and through transformation all the way to consumption in the BI layer.
It is also important that data pipeline monitoring is supplemented with a process for monitoring the data quality itself. This is because while the pipeline may be operating fine, the data flowing through it may be garbage.
For example, the data values may be outside the normal historical range or there could be anomalies present in the NULL rates or percent uniques. Monitoring the data itself can be done automatically with machine learning as well as by setting custom rules, for example if you know a monetary conversion rate can never be negative.
When automated data monitoring is combined with features to accelerate incident resolution, understand the impact of those incidents, and illustrate data health over time, it then becomes data observability.
Data observability vs data quality
Data observability enables and improves data quality. Data quality is often expressed in the six dimensions of accuracy, completeness, consistency, timeliness, validity, and uniqueness.
I’ve found that among business stakeholders, the reality is data quality is considered a binary metric. Your CFO doesn’t come up to you and say, “the data was accurate but out of date so I’m considering it to be of average quality.”
Those other data quality metrics are helpful for data professionals to understand what’s not working and where to focus their resources, but for your data consumers either the data quality is good or it’s bad. Just like a SaaS solution, either it’s working or it’s not. That’s why we created the metric of data downtime.
With a data observability solution in place, data teams can ensure they have high data quality.
Data quality vs data reliability
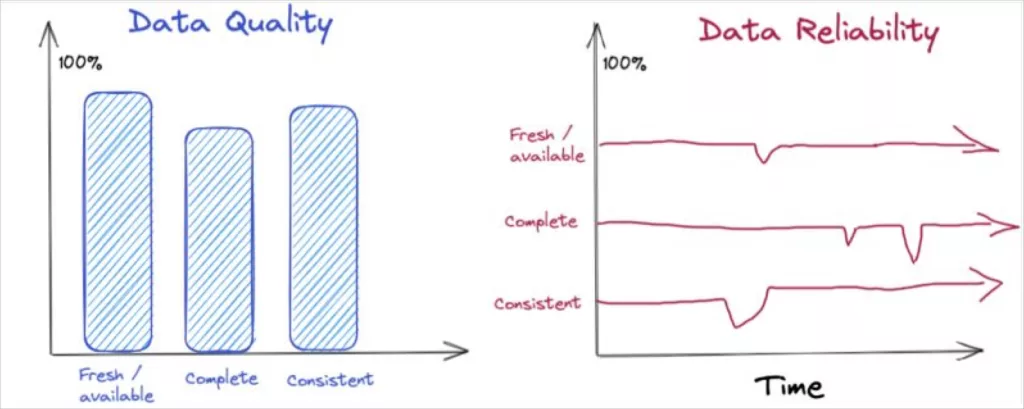
These terms are often used interchangeably, which is fine. However, another way to think about it is that solving for data quality requires you to think beyond a point in time, and consider how the quality changes over time in a variety of real-world conditions.
That is true data reliability.
For example, the quality of an airline might be measured based on its timeliness (percent of flights on-time), safety (major incidents) and food service approximating that of a diner.
But in order for the airline to be reliable, it’s expected to maintain those levels of quality consistently over time, across various routes, weather conditions and holiday weekends.
Similarly, a data product’s quality might be assessed by its availability at 9am, the completeness of records, and its consistency versus a source-of-record. For it to be reliable, you must assess whether it maintains these service levels over time, across holiday traffic spikes and product launches.
In solving for reliability you must not simply measure data quality (at a point in time and space), but also establish expected levels of quality and service (i.e. how quickly you’ll communicate and respond to incidents), and have the toolkit to rapidly diagnose and resolve data incidents.
Data observability vs data reliability engineering
Some data observability companies have started to describe themselves or their tools in the framework of data reliability engineering.
This makes sense as data observability borrows heavily from observability and other concepts of site reliability engineering (SRE). While different solutions or tools may have significant differences in features offered, there is no real difference between data observability and data reliability engineering.
Both terms are focused on the practice of ensuring healthy, high quality data across an organization.
Signs you need a data observability platform
This 2019 talk helped introduced data downtime and data observability. It is still relevant today.
From speaking with hundreds of customers over the years, I have identified seven telltale signs that suggest your data team should prioritize data quality.
They are:
- You’re data platform has recently migrated to cloud
- Your data stack is scaling with more data sources, more tables, and more complexity
- Your data team is growing
- Your team is spending at least 30% of their time firefighting data quality issues
- Your team has more data consumers than you did 1 year ago
- Your company is moving to a self-service analytics model
- Data is a key part of the customer value proposition
The future of data observability
Data observability is a rapidly maturing but still evolving space. For example, G2 Crowd created a data observability category in late 2022, but as of this writing there is not a data observability Gartner Magic Quadrant. That being said, Gartner did place data observability on their 2022 Data Management Hype Cycle.
However, multiple companies and technologies are identifying with the term data observability. There has been tremendous investor activity, and, most importantly, customer interest and values are at all-time highs.
Data observability is at the heart of the modern data stack, whether it’s enabling more self-service analytics and data team collaboration, adoption, or working alongside dbt unit tests and Airflow circuit breakers to prevent bad data from entering the data warehouse (or data lake) in the first place. It is also a core component of important and emerging data quality best practices such as data mesh, data SLAs, and data contracts.
I see a bright future for data observability as data continues its march from dusty dashboards to the boardroom, machine learning models, operational systems, customer facing products, and more.
With data observability, data quality and data engineering are finally getting a seat at the table.
[The original article that launched a category: What is data observability? Hint: it’s not just data for DevOps ]
If you want to learn more, reach out to Barr Moses and book a time to speak with us via the form below.
Our promise: we will show you the product.
Frequently Asked Questions
What is the purpose of data observability?
The purpose of data observability is to help data teams detect and resolve data quality issues in real-time in order to eliminate the impact of data downtime and foster improved trust in an organization’s data products.
Why is data observability important?
Data observability is important because it drastically reduces the impact of data quality issues and empowers data teams to programmatically scale robust end-to-end quality practices across the breadth of their data environment.
Improving the reliability of data systems is vital to accelerating the adoption of data and earning the trust of business stakeholders. Data downtime will become more costly as organizations unlock additional value from their data with analytical, machine learning, and AI use cases, thus justifying the direction of additional resources towards improving data quality.
What are the benefits of data observability?
The primary benefits of data observability are drastically improved data trust, immediate time-to-value based on automated tooling like ML monitors and lineage, more focused and efficient data teams, reduced impact of data quality issues, and the ability to maintain data quality at any scale.
What is data pipeline observability?
Data pipeline observability involves using machine learning to monitor the metadata of pipelines to for anomalies in data freshness, volume, and schema. It is also a good idea to monitor the quality of the data flowing through the pipeline in addition to monitoring the system’s behavior. A pipeline will consist of multiple tools across the data lifecycle and integrations are a core component of data pipeline observability.
What is a data observability platform?
A data observability platform features automated monitoring, root cause analysis, data lineage, and other features to proactively detect, resolve, and prevent data anomalies. This approach results in healthier data pipelines, increased team productivity, enhanced data management practices, and ultimately, higher customer satisfaction.
Is data observability part of data governance?
Data governanceYou can think of data governance as a framework in which a variety of tools and processes coalesce to determine how data is used safely and effectively. Data observability is one of the primary tools that power effective governance by enabling data teams to understand the health and efficacy of their data for a given use-case prior to be consumed or leveraged downstream.
Read more posts.