Product demo.
  What is data observability?
  What is a data mesh--and how not to mesh it up
  The ULTIMATE Guide To Data Lineage
 The Non-Engineer’s Guide to Bad Data


Scott O'Leary
Scott O'Leary is a founding member of Monte Carlo's Sales team.
According to a recent study by HFS, 75 percent of executives don’t trust their data. Here’s why and what data-reliant teams can do about it.
It’s 8:45 a.m. on a Monday morning – 15 minutes until you jump on a Zoom call with your Head of Marketing to discuss the performance of last month’s ad campaigns.
To prepare for the meeting, you refresh a dashboard in Tableau (the same one you use for this meeting every month!) to visualize the impact of a new promotion on the number of visitors to your website.
Glancing over the report, you freeze.
The data is completely wrong – how did 50,000 unique monthly visits in November dip to 500 in December?
Yikes. Are you checking the wrong dashboard?
Nope, it’s the same one (Marketing Ad Spend Report – Good- USE THIS ONE-V2). Your attempt at quick sleuthing landed you back at square one.
Your next tactic? Fire off a few Slack messages to Jill in Data.
“Why is this report wrong?”
“Am I looking at last month’s numbers?”
“Our Head of Marketing won’t be happy about this one.”
No response.
The clock strikes 9 a.m. You have no choice but to log onto Zoom, empty-handed and none the wiser. Who needs data, anyway?
If this situation feels familiar, rest assured: you’re not alone.
For many data-driven professionals, this problem, data downtime, is a regular occurrence, leading to lost trust, wasted time, and frustrated bosses everywhere. Data downtime refers to periods of time when data is missing, inaccurate, or otherwise erroneous, and it’s rarely given the diligence it deserves.
Instead of trusting your data to inform decision making, you’re forced to question whether or not your team’s reports and dashboards are reliable, and in the long-term, whether or not any of the data at your company can be trusted. In fact, according to a 2021 study by HFS Research, 75 percent of executives don’t trust their data.
But it doesn’t have to be that way.
In this article, we’ll walk through critical symptoms of data downtime at your company, highlight why data breaks in the first place, and share a better way forward for bringing trust and reliability to your dashboards.
But first: a word about the fearless data engineer.
Before we dive any deeper, I’d like to thank the unsung hero of the modern data team: the data engineer, often the first line of defense against broken dashboards and reports.
Whenever you reach out to the data engineers at your company about missing data, you probably get this response (or something very similar): “Let me investigate.”
While it would make these monthly meetings with your CMO so much easier if their primary purpose in life was to fix your reports, they have a lot on their plates, and yet time and again, the value they deliver for the organization often goes unnoticed.
Between fielding ad-hoc requests from the analytics team to building your organization’s data infrastructure (so you can understand how sticky your new landing page is or how impactful that new feature was when it came to reducing customer churn), being a data engineer is challenging. Data engineers also ensure data flows to the right places at the right time, incorporate new data sources into the data ecosystem, build new data products, and design more resilient data systems.
These responsibilities don’t even scratch the surface when it comes to tackling data downtime.
When something goes wrong with your data, they’re on the hook to figure out what happened (often referred to as root cause analysis), its impact on the business, and how to fix it.
In order to grasp the weight of this responsibility, it helps to understand the impact of broken data on your company.
The effects of bad data on your business

Inaccurate reports, feeling unprepared in meetings, or lacking important information needed for your job are a few common consequences of having bad data, but the reality carries much more weight for your company’s bottomline.
Here are a few tangible business problems associated with poor data quality – maybe they’ll resonate:
- Loss of revenue: It’s a no-brainer: data supports your business goals, from helping you re-target prospects to optimizing the customer experience. If the campaign data your marketing team is using to forecast ad spend, your marketing team could end up over or underspending on these efforts.
- Misallocated resources: One of the biggest consequences of data downtime is misallocated budgets, caused by stale or inaccurate data powering a critical report driving decision making. If your quarterly forecast suggests that the best market to open a new restaurant in is Kansas City, Missouri, you better be sure the data is right before you spend millions of dollars opening a new branch.
- Less time for innovation: On average, data engineers spend more than 20 hours per week investigating and resolving data fire drills. With over half of their time dedicated to troubleshooting data quality issues, data engineers are limited in their ability to work on value-additive activities such building experimentation platforms or other products to improve your company’s products and services.
At the end of the day, bad data costs time and money for everyone at your company, not just the data engineers.
With this context, let’s get to the bottom of our original question: why does data break – and how can you help your data engineers fix it?
So, why does data break?
There are plenty of reasons why data breaks, and more often than not, it boils down to more than one root cause. (We’ll spare you the technical jargon, but curious readers should check out O’Reilly’s new book on data quality to learn about the ins and outs of data reliability and trust).
As you partner with your data engineering friends to fix your dashboards, it helps to understand what’s going on behind the scenes. Here are some common data quality issues faced by even the most data-savvy companies:
- Failure in systems that apply business logic: Typically, data engineers run custom code to apply business logic to the data (i.e., values falling between a specific range). Sometimes, that SQL (or Python or Apache Spark) command fails altogether and sometimes it doesn’t run properly, both of which can cause bad data to slip through the cracks and break dashboards downstream.
- Bad source data: When a dataset or table includes duplicate records, incomplete data, outdated columns, or data in an inconsistent format, we call that bad source data. Bad source data can disrupt the flow of data into reports, dashboards, and products.
- Failure to validate your data: After data has been cleaned and is in the proper format for your business, it needs to be validated – or in other words, checked against business requirements to ensure the data is meaningful and correct. If engineers fail to validate their data, the likelihood of bad data entering valuable dashboards and reports increases.
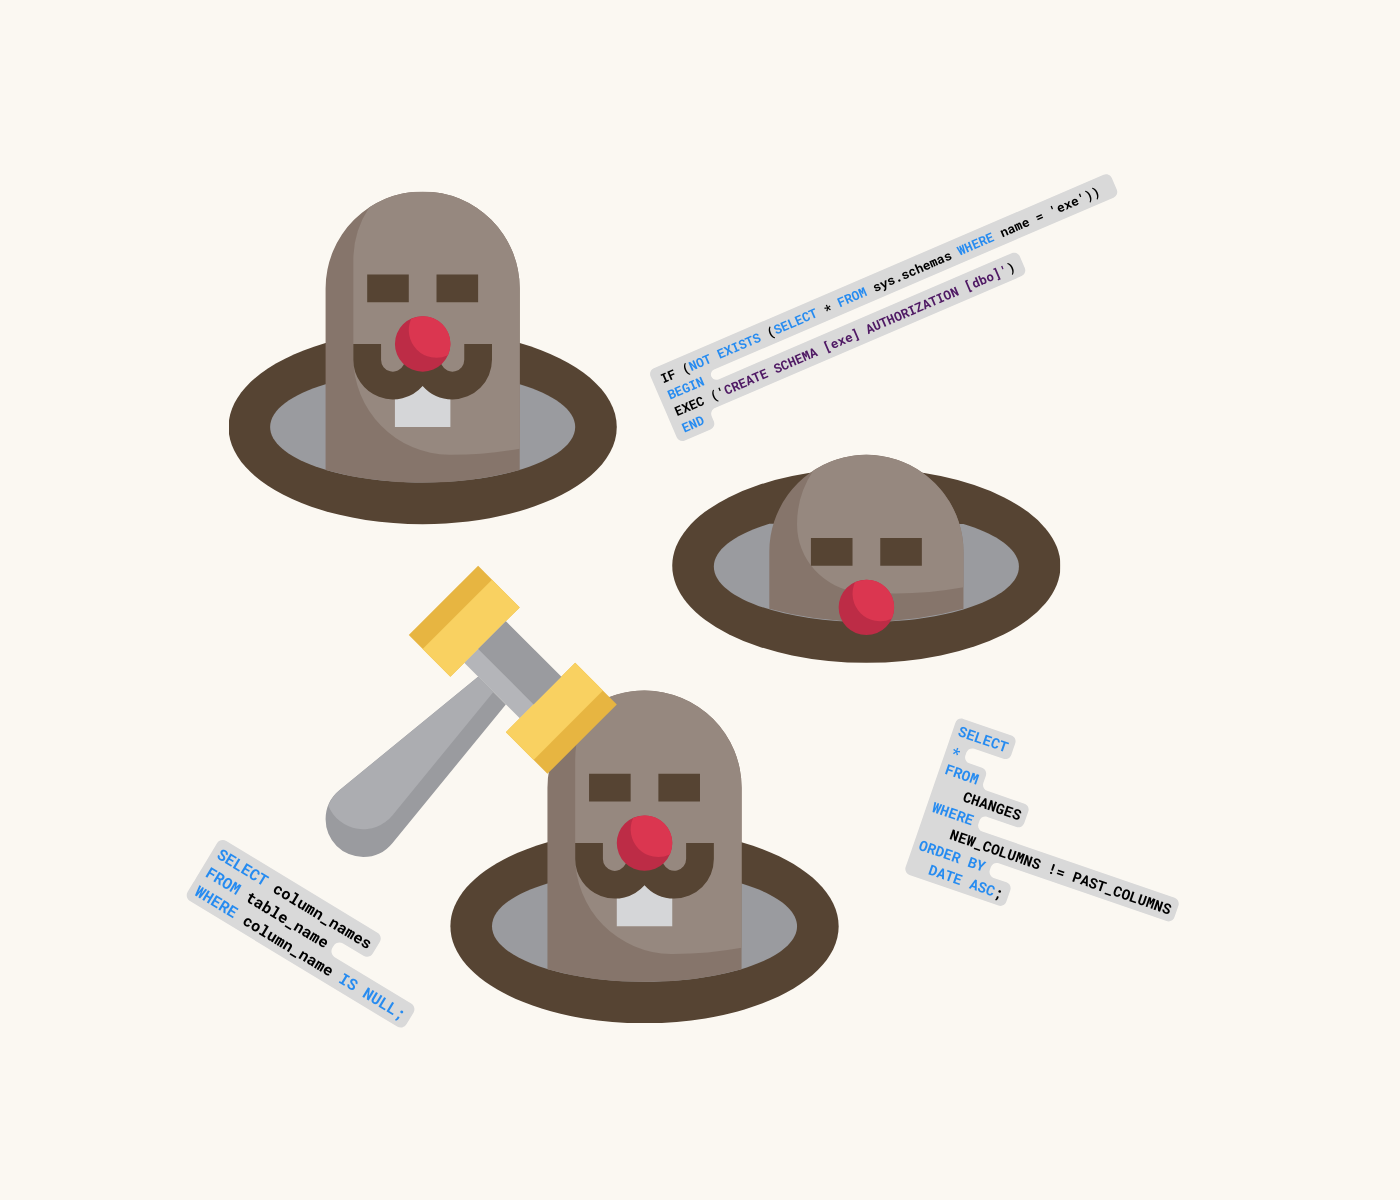
- Unexpected changes to schema: If you are not familiar with schema, it’s basically data’s DNA. Schema makes up databases and data warehouses and contains instructions on how the database is designed. At times, when pushing code to production, an engineer might have one tiny error in their code (such as changing a table name from “customer” to “customers,”) which in turn, can cause a whole series of issues down the line. These changes usually go unnoticed until after the fact and the damage is already done.
- Bugs are introduced to code: Think of a bug as an error or unexpected behavior to your code. As companies grow, it can become too challenging to predict and catch every error that might happen, especially as code becomes increasingly complex. Buggy code is a leading cause of data downtime for every industry, even causing a $125 million NASA probe to crash.
- Updates/changes to your organization’s operational environment: Another common cause of data issues is a change to the operational environment that runs data jobs, in other words, a stage in the data life cycle. The reasons behind this can vary from long-running queries to changes in the job schedule that accidentally drop or misplace data. (More on this topic via my colleague Francisco).
Now that we know the symptoms, impact, and cause of broken data, how do we actually fix it?
How to prevent bad data with observability
Fortunately, we can look beyond frantic Slack messages and harried texts to our friends in data engineering to stay ahead of broken dashboards and reports. To get there, however, we first need to understand the health of our data.
One increasingly popular way for companies to prevent data downtime is through data observability, a new approach to tackling data quality at scale in a collaborative and holistic way. By ensuring that data engineers are the first to know about bad data – before it hits your dashboards – data observability helps companies understand the reliability and trust of their data at any given point in time.
With data observability, even analysts and other data-informed business users can be alerted of critical data issues so they can avoid the frustration, embarrassment, and lost revenue caused by gut-based decision making and missing data. Data engineers can troubleshoot and fix these issues before anyone else at the company is aware that anything is wrong.
And if your data does break and cause downstream issues, observability gives your data team the ability to understand the impact of the broken report so you can correct course accordingly and prevent missing values from throwing a wrench in your Monday morning meetings.
Until then, here’s wishing you spotless dashboards, accurate forecasts, and most importantly, no data downtime.
Want to learn how data observability can fix your organization’s broken dashboards and reports?
Book a time to speak with us using the form below.
Our promise: we will show you the product.
Read more posts.