Product demo.
  What is data observability?
  What is a data mesh--and how not to mesh it up
  The ULTIMATE Guide To Data Lineage
 11 Ways To Stop Data Anomalies Dead In Their Tracks

Michael Segner
Michael writes about data engineering, data quality, and data teams.
A data anomaly is when the data is incorrect or missing as a result of bad data or broken data pipelines.
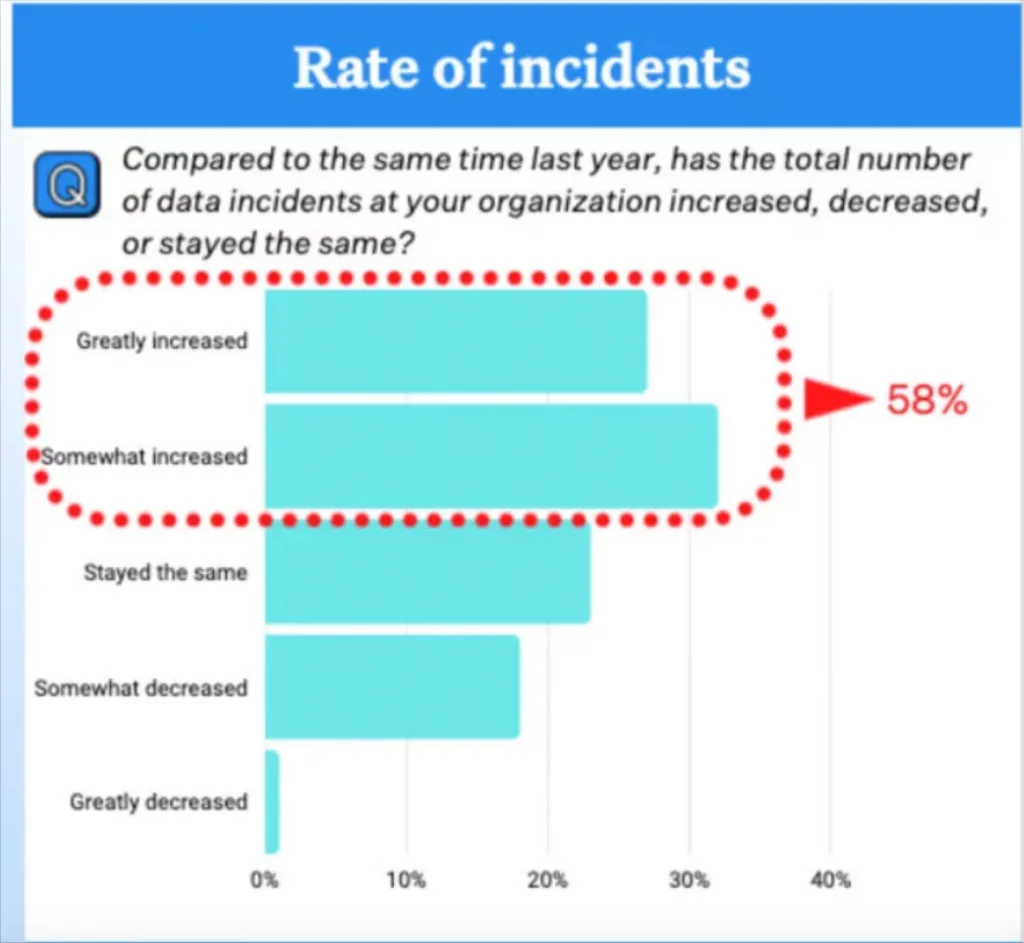
Not only are data anomalies painful, they are costly to resolve. According to our research, the average organization experiences 61 data anomalies a month and takes more than 9 hours to resolve each one.
That’s 549 engineering hours each month. Assuming an hour of a data quality analyst or data engineer’s time costs roughly $75 that totals to nearly a half million dollars in engineering time a year spent on resolving data anomalies. And that doesn’t factor in the damage data anomalies can wreck in the time between when they occur and when they are detected and resolved.
Or perhaps it makes sense to think of the math this way: every data anomaly prevented is approximately $675 saved in engineering resources that can be allocated elsewhere. As the old saying goes, an ounce of prevention is worth a pound of treatment.
So what strategies can data teams deploy to reduce the number of data anomalies they experience each month? Here are eleven ways we’ve seen data teams stop data anomalies dead in their tracks.
Interested in a deeper dive? Check out our ebook, “Shift Left: The Essential Guide To Proactive Data Quality.”
11 Ways To Prevent Data Anomalies
- Data Circuit Breakers
- Data Contracts
- Data Health Insights
- Data SLAs
- Data Ownership
- Create a semantic layer
- Promote data literacy
- Conduct post-mortems
- Document data assets
- Write clear SQL statements
- Improve Degraded Queries
Data Circuit Breakers
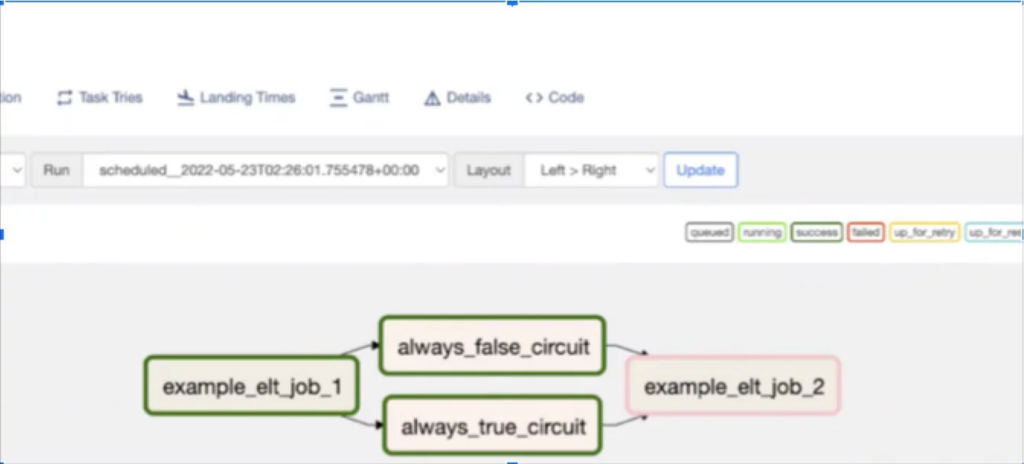
A circuit breaker is basically data testing on steroids. By leveraging the Airflow ShortCircuitOperator, you can stop the job from running if the data does not match a prescribed set of anticipated characteristics.
This is a double edged sword best wielded only for the most well-defined logic and thresholds that mandates your pipeline should stop running (for example a column should never have NULLs). Otherwise you may produce more data anomalies than you prevent.
Data Contracts
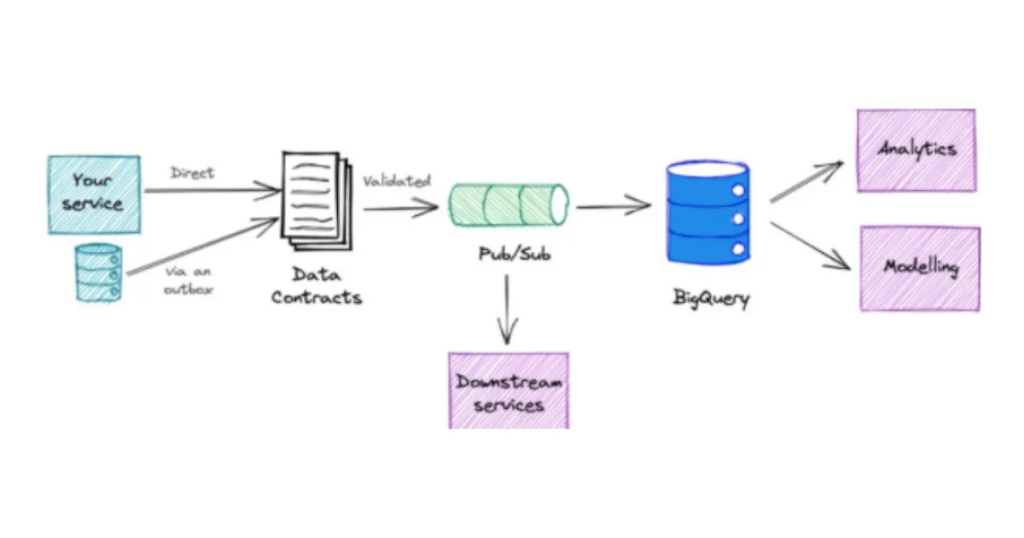
You can think of data contracts as circuit breakers, but for data schemas instead of the data itself. Data contracts also involve pre-defining schemas and preventing unexpected changes that can create data anomalies in downstream data assets.
The actual data contract itself is typically written in a templated interactive data language (IDL) such as Apache Avro or JSON. There is also a mechanism for decoupling the data architecture to avoid using production data or change data capture (CDC) events directly.
Data Health Insights
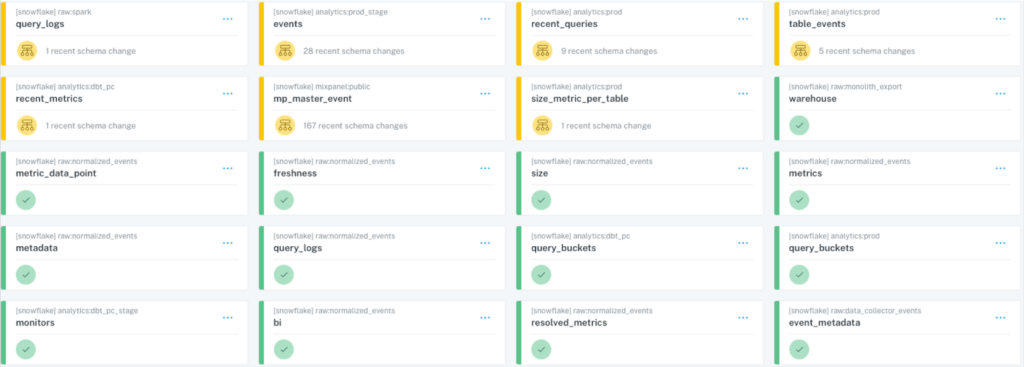
Many data architectures will have “hot spots” that generate a disproportionate amount of data anomalies. Data health insights, metadata that surfaces the data health of different data assets, can help reveal where data teams need to spend more time and resources. That may be a specific problematic table or a domain within the business with lagging data quality. Understanding the key assets also helps avoid the, “You’re Using THAT Table?!?” problem.
Data SLAs
You can’t improve what you don’t measure. The same goes for the rate of data anomalies. Data engineers need to measure data quality and data downtime just like our friends in software engineering who have addressed application downtime with specialized frameworks such as service level agreements, indicators, and objectives (SLA, SLI, SLOs).
So how do you go about setting effective data SLAs? For this, let’s turnagain to the real world experience of Brandon Beidel, director of product and data, at Red Ventures.
He met with every business team in a weekly cadence, and without ever using the term “SLA,” started having discussions around data quality and how it impacted their day to day.
He then created a SLA template for his data team to create and uphold SLAs across the business (the examples in the template below are ours) and started tracking performance of what percentage of SLAs were being met by each data warehouse in a dashboard.
Data Ownership
Most data leaders understand clear lines of ownership enable quick action to be taken and set the stage for accountability. What is routinely underestimated is the need for layers of ownership in order to prevent data anomalies.
There needs to be ownership for data quality at the organizational level, domain/project level, and even pipeline/table level. These ownership lines need to be traced back to owners of the business processes they support. Some ways to create ownership:
- Create a data team RACI for data quality.
- Create data SLAs that establish data and business team ownership for key tables and data products. Hint: data product managers are useful here.
- Where ownership lines overlap, create clarity by appointing a “custodian” who has primary ownership when data anomalies occur, but must consult other data team stakeholders for any changes.
Create a semantic layer
Here’s a hypothetical scenario: two executives meet to discuss customer churn across their respective product lines, perhaps these products have different business models.
They notice their numbers don’t make sense in the aggregate, blame the data quality, and lose trust in their dashboards. In this case it turns out each had accurate data, but just calculated the customer churn metric using a different formula and with slightly different data sources.
Creating a semantic or metric layer tackles this data anomaly problem head on and helps ensure everyone is operating from the same sheet of music. Semantic layers were introduced by Looker (LookML) and allowed data analysts and other data team members to create a layer with defined and “locked down” metrics that could be used across the business. Tools like dbt have also debuted semantic layer features to much fanfare.
Promote data literacy

Here’s another chilling anecdote from a Forrester event two years ago about breakfast sausage and why it’s important for every employee to understand a company’s data strategy.
A French food services company saw the orders of breakfast sausage spike dramatically at one site until over a short period of time it became the only item ordered. Nothing was wrong with their data pipelines and they didn’t notice any data anomalies, so the team dug deeper.
What they found was that the point of sale system allowed for the worker to punch a single button for an item rather than enter the full price, and since breakfast sausages cost as much as croissants, and because it was more strategically located on the register…well you can guess the rest.
Data quality is as strong as its weakest link, and that weakest link producing data anomalies more often than not are humans, especially those outside the data team. The answer? Data literacy programs along with building understanding of how data is actually collected in the field.
Conduct post-mortems
This may seem like a strange piece of advice in a blog about preventing data anomalies. If you are conducting a post mortem, by definition the data anomaly has already occurred.
However, the main value of post mortems is in fact preventative as they should focus more on lessons learned and actions to ensure data anomalies don’t happen again. The Mercari data team has leveraged them effectively to improve their data reliability.
“During one of our post-mortems we learned alerts were getting missed because not every domain team had as rigorous a process for tracking alerts, even if they found them informative,” said Daniel. “We now have a dedicated Slack channel and a daily stand up to review all alerts. Now, we are able to more efficiently; get information on the alerts that need to be acted upon, notify the appropriate people, and document what occurred.”
Document data assets
It’s no data engineer’s favorite task, but data anomalies occur more frequently when good documentation doesn’t exist. Additionally, documentation enables discovery and ultimately self-service.
The challenge is your ability to pipe data is virtually limitless, but you are constrained by the capacity of humans to make it sustainably meaningful. In other words, you can never document all of your data, and rarely will you have as much documentation as you’d like.
One company decided to hold off on a column level approach for their documentation since columns are often self-describing. Instead they focused on tables, views, and schemas on their key assets for a “minimum viable product.” They used their own system as well as Monte Carlo to identify key data assets and owners so they knew who to bother about documentation.
Write clear SQL statements
Let’s face it, some of the SQL formatting debates are silly. Your organization’s data quality is not going to hinge on how or if you capitalize your user-defined object names (e.g. tables).
However, data engineering is a team sport. Odds are the statement we write or modify today is going to need to be understood by another human being at some point in the future. While commas in SELECT statements may not make any tangible differences, how you format statements with multiple JOINS and subqueries does.
If the business logic is shrouded behind nonsensical line breaks or gutters not only are you wasting your colleagues time, it can introduce errors into the process. Your poor future colleague may make a wrong assumption or even hunt for another, less appropriate source because they don’t realize what they need is right in front of them. I highly recommend Benn Stancil’s definitive take on the topic.
Improve Degraded Queries
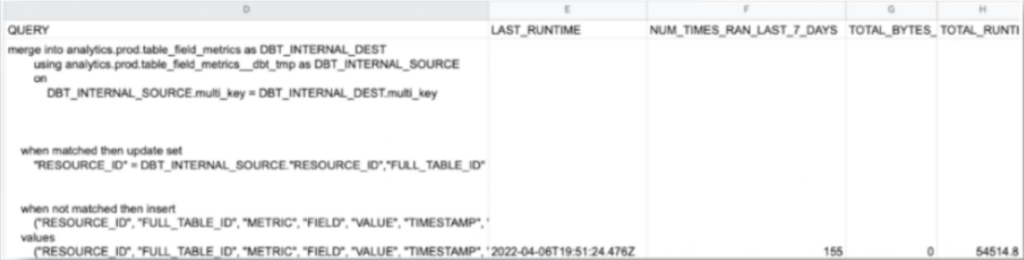
Back in the Hadoop days, queries were carefully constructed and optimized to ensure limited storage and compute resources were maximized. Today, data clouds have made the most precious and costly resource data engineer’s time.
As a result, queries are quickly slapped together, modified, and run. Most of the time, this gets the job done. However, every once in a while, there is a query that has become heavier and more brittle over time. Essentially, it is a piece of gum holding together an incredibly intricate machine. It works until…it doesn’t.
You can’t out-architect bad data, but you should still stop what you can
it’s important to realize, no matter how smart your team, no matter how great your execution, now matter how robust your architecture, bad data is inevitable.
One of the best ways to leverage all three levers to lower your data downtime is to adopt a data observability platform.
By leveraging machine learning anomaly detectors, these solutions can act as a safety net allowing you to quickly catch any bad data that WILL squeak through your layers of defense.
Data observability platforms also provide a variety of features that accelerate root cause analysis including data lineage, query change detection, correlation insights, anomalous row detection, and more that can speed up. Finally, through data health insights and other features, data observability platforms can play an active role in many of the strategies we listed in this blog.
You can schedule time to talk to us about preventing data anomalies and data observability using the form below. Until then good luck on your data quality journey.
Our promise: we will show you the product.
Read more posts.