Product demo.
  What is data observability?
  What is a data mesh--and how not to mesh it up
  The ULTIMATE Guide To Data Lineage
 4 Native Snowflake Data Quality Checks & Features You Should Know


Matt Sulkis
Matt is the head of partnerships at Monte Carlo.

Francisco Alberini
Francisco is a product manager at Monte Carlo.
Adopting a cloud data warehouse like Snowflake is an important investment for any organization that wants to get the most value out of their data. But as teams ingest and transform significant amounts of data across more complex pipelines, it’s crucial that teams leverage native Snowflake data quality features to help ensure data is trustworthy and reliable.
When data quality is neglected, data teams end up spending valuable time responding to broken dashboards and unreliable reports. Organizational trust in data plummets, and business leaders revert to relying on instincts and anecdotal evidence instead of data-driven decision-making.
The unfortunate truth is that data quality can be compromised in countless ways.
Schema changes can corrupt downstream data products. APIs can break and halt the flow of important data into your warehouse. Data can be stale or duplicative.
And when things go wrong, data teams may have no idea until a panicked Slack message or email arrives, asking why a critical report or tool isn’t functioning as expected.
The good news is that Snowflake provides a number of helpful features that, when used correctly and consistently, can help improve data quality.
If you are interested in taking your Snowflake data quality to the next level and enabling automated end-to-end coverage across your stack, we have 6 more ways to solve for Snowflake data quality in our latest eBook.
Table of Contents
- Snowflake Data Quality Feature #1: Access History
- Snowflake Data Quality Feature #2: Data Quality Queries
- Snowflake Data Quality Feature #3: Object Tagging
- Snowflake Data Quality Feature #4: Snowsight
- How Data Observability Improves Snowflake Data Quality
Snowflake Data Quality Feature #1: Access History
Regular data audits help ensure your data is being stored and accessed securely and in compliance with regulatory requirements—but audits also play an important role in ensuring data quality.
By evaluating and documenting the state of your data within Snowflake, you can identify data quality issues such as stale data, data that fall outside of expected distribution ranges, incomplete tables, and schema changes.
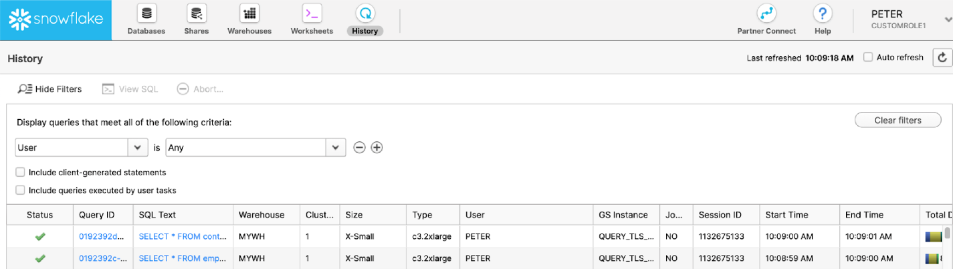
In Snowflake, you can uncover valuable insights about which tables are used, by whom, and how often with the Access History feature (available in Enterprise Edition and higher).
As Snowflake defines it, each row in the Access History view contains a single record per SQL statement that describes the columns the query accessed, including the underlying tables that the data for the query comes from.
If you don’t have the resources to conduct manual quarterly audits, you can invest in a bespoke solution that will provide end-to-end coverage from a security and data quality perspective.
There are several on the market, but many rely on an architecture that uses table-level rules to evaluate whether data quality standards are being met. For modern data teams working with vast amounts of data, this approach is difficult to scale—rules must be developed and implemented for every table, which takes considerable time to set up and continually maintain as new data sources are added.
Instead, invest in a data observability tool that handles data quality proactively through automation and machine learning.
When your solution can establish quality rules based on patterns within your data—including automatically creating new validation checks for new tables—it becomes much more feasible to scale data quality along with your Snowflake usage.
Additionally, be sure any tool you invest in leverages a hybrid deployment architecture to ensure privacy and compliance. Your data shouldn’t need to move to another location, which increases security risks.
Pro tip: DocuSign’s Director of Engineering Damien Alvarado recommends using this information to identify and drop unused tables to save money on storage costs, as well as pinpointing hotspots in your database.
Snowflake Data Quality Feature #2: Data Quality Queries
Tracking and reporting on data quality metrics within Snowflake will help your team understand the health of your data on a quantitative level. There are a few steps you can take to extract and analyze these metrics:
Map your Snowflake inventory
Mapping all the tables in your warehouse allows you to know what needs to be tracked in the first place. This query will fetch a list of all tables within a database, along with helpful metadata about their settings.
Use this query to extract table schema, then use this query to extract view and external table metadata.
Monitor for data freshness and volume
Snowflake tracks volume and freshness as writes are made to tables in the warehouse. Use this query to pull how many bytes and rows tables have, as well as the time they were most recently updated.
Build up your Snowflake query history
Analyzing your query logs helps you understand which users use which assets and map lineage, which can help you speed up troubleshooting when issues arise.
Use this query to extract query logs while filtering out system and faulty queries to reduce noise. To understand how data is loaded and moved around, use this query to extract copy logs.
Check the health of your most important data in Snowflake
Once you’ve identified your critical tables, it’s worth running additional data quality checks to make sure all fields are populated properly and have healthy values.
By tracking health metrics over time and comparing them to past batches, you can find a range of quality issues as soon as they appear in your data. Use this query to extract health metrics like completeness, distinctness, and UUID rate.
Pro tip: Keep track of your Snowflake credit consumption to ensure these sizable queries aren’t running up unexpected bills.
Snowflake Data Quality Feature #3: Object Tagging
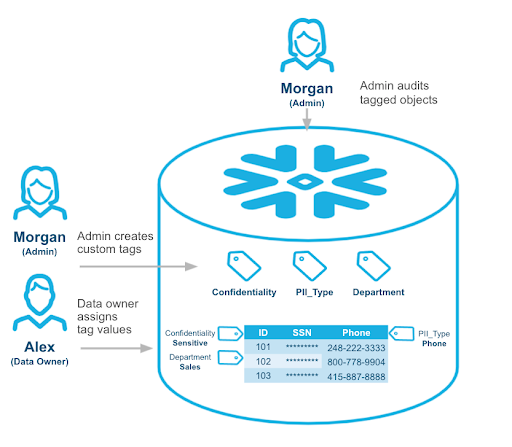
As Snowflake defines it, object tagging allows data engineers and governance leads to track sensitive data for compliance, discovery, protection, and resource usage.
Available for Enterprise Edition and up, object tagging allows you to set up tags as key-value pairs that can indicate data classification or sensitivity.
Having accurate object tagging in place makes it much easier to identify and monitor higher-risk data, and for governance teams to implement additional security measures like dynamic data masking or row-level access restrictions.
Our customers in particular find this feature useful for tagging personally identifiable information (PII) data. For example, tagging a column with phone numbers as PII = “Phone Number.” Other helpful governance features include Dynamic Data Masking and Row Access Policies.
Pro tip: Snowflake data architect Laina Worth recommends starting with object tags by laying out your set of tags and acceptable values in a separate framework. You’ll want to consistently tag objects at the lowest level possible (account, database, schema, table, or column) so that you can apply masking and row-level access policies only to the data that needs it.
Snowflake Data Quality Feature #4: Snowsight
Data quality isn’t simply about accuracy—it’s about providing value to the business. That’s why high-quality data also needs to be accessible, understandable, and discoverable.
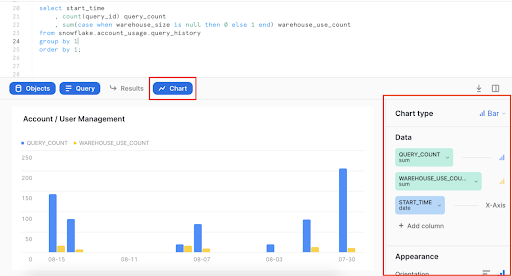
To improve data discovery for Snowflake assets, you can leverage Snowsight, the platform’s visual, metadata-driven analytics interface.
Snowsight allows your team to see metadata information for any query result, including filled/empty meters, frequency distributions, key distributions, and histograms. You can drill down further into these metadata-based contextual statistics by filtering to particular subsets of data or applying contextual filters within the UI.
Snowsight also provides data visualizations to help deliver more context and additional ways of understanding and sharing insights with the larger organization.
Together, these features empower more robust discovery and exploration of your data assets within Snowflake. But to enable the fullest understanding of your data, you’ll need to leverage a more holistic solution that ensures end-to-end coverage. Data observability tools that sit across your entire data ecosystem can help bridge these gaps.
How Data Observability Improves Snowflake Data Quality
While open-source tools and bespoke solutions can help you address some of these steps to addressing Snowflake data quality, a robust data observability platform will enable you to achieve every item on this list—across your entire data ecosystem.
Snowflake selected Monte Carlo as its first-ever data observability partner, and together, these tools are charting the path forward for data reliability in the modern data stack.
Teams that use Monte Carlo and Snowflake are able to improve data quality, drastically reduce time-consuming fire drills, and spend more time and attention on adding value to their organizations through data.
Remember, we have 6 more ways to solve for Snowflake data quality in our latest eBook. Check it out!
Ready to learn more? Book a time to speak with us in the form below and learn how Monte Carlo can help ensure the reliability of your data in Snowflake—and beyond.
Our promise: we will show you the product.
Read more posts.