Product demo.
  What is data observability?
  What is a data mesh--and how not to mesh it up
  The ULTIMATE Guide To Data Lineage
 Monte Carlo’s New Sigma Integration Helps Data Teams Prevent Broken, Stale Dashboards

Michael Segner
Michael writes about data engineering, data quality, and data teams.
In the battle against data downtime, data teams must be equipped with full visibility into their data pipelines from ingestion and orchestration to transformation and visualization. Each interconnected layer can introduce and be impacted by poor data quality.
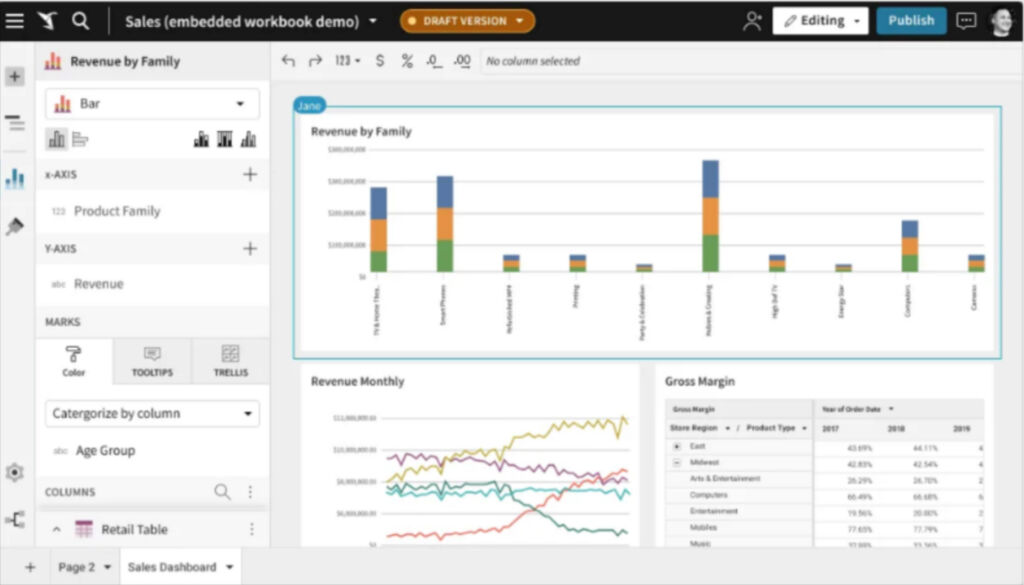
That’s why we are excited to announce our data observability platform’s new integration with Sigma Computing. The cloud native no-code analytics and business intelligence (BI) platform is a favorite of data teams for its familiar spreadsheet interface and ability to give business users instant access to explore and get insights.
However, the insights within any BI tool are only actionable if they can be accessed and trusted. With this integration, Sigma and Monte Carlo users can be confident that the upstream data systems powering their analytics are being monitored so any data incident or anomaly is quickly detected and resolved, or prevented altogether.
Even better, the integration requires no setup or configuration. Sigma Workbook Pages will automatically surface as lineage nodes and catalog entries once users have connected their Monte Carlo environment to Snowflake, BigQuery, Redshift, or Athena.
“Sigma empowers our data and business teams meet to collaborate and turn analytics into business value. Getting insight into how the impact of an incident could reverberate downstream to our Workbook Pages is essential to maintaining and expanding that collaboration,” said Lior Solomon, VP of Data at Drata. “We’re excited to leverage Monte Carlo’s Sigma integration to bring data trust to the downstream dashboards and reports our company relies on to power growth and decision making.”
“Sigma is the nexus where our data and business teams meet to collaborate and turn analytics into business value. Getting insight into how the impact of an incident could reverberate downstream to our Workbook Pages is essential to maintaining and expanding that collaboration,” said Mark Stange-Tregear, VP of Data, Babylist. “Monte Carlo’s integration is already proving valuable in providing us end-to-end visibility across our data assets.”
To get the full picture you can watch the minute and a half video above and we will explore some interesting use cases from this integration in this post as well.
Be first to know
Monte Carlo was inspired in large part by Barr’s painful experience trying to provide error free analytics to her then CEO.
In her words, “Seemingly every Monday morning, I would wake up to a series of emails about errors in the data. It felt like every time we fixed a problem, we found three other things that went wrong. What’s worse, we weren’t catching the issues on our own.”
Her experience isn’t unique. Monte Carlo’s surveys have revealed that 47% of data professionals reported business stakeholders were impacted by data incidents they didn’t catch “all or most” of the time.
There will always be data quality issues. Airflow jobs fail, schemas change, and bad query code happens. Unfortunately, these issues are often caught by business stakeholders and are at their most visible within the BI application.
Stale dashboards and nonsensical data lead to an erosion of data trust, which can become an existential crisis for a growing data team. It can also lead to ad-hoc fire drills for the data team to try and find the root cause for why the Workbook Page showed an inadvertent 20% jump in a key business metric.
Monte Carlo’s data observability platform automatically alerts you to these anomalies so you know of any issues before your business stakeholders. The data team member responding to the incident can quickly assign an owner, severity level, and incident status, such as, “investigating,” within Monte Carlo and have the updates visible for Workbook Page users in Slack, Microsoft Teams, or the collaboration tool of choice for the organization.
You can also set custom freshness monitors so, for example, you can be assured the data was refreshed on the CEO’s Workbook Page at 7:00am before they check it first thing in the morning.
Understand business impact
If incidents are at their most visible at the BI level, a data observability platform should provide the ability to understand the impact on those downstream analytics and business teams when a data incident or anomaly occurs.
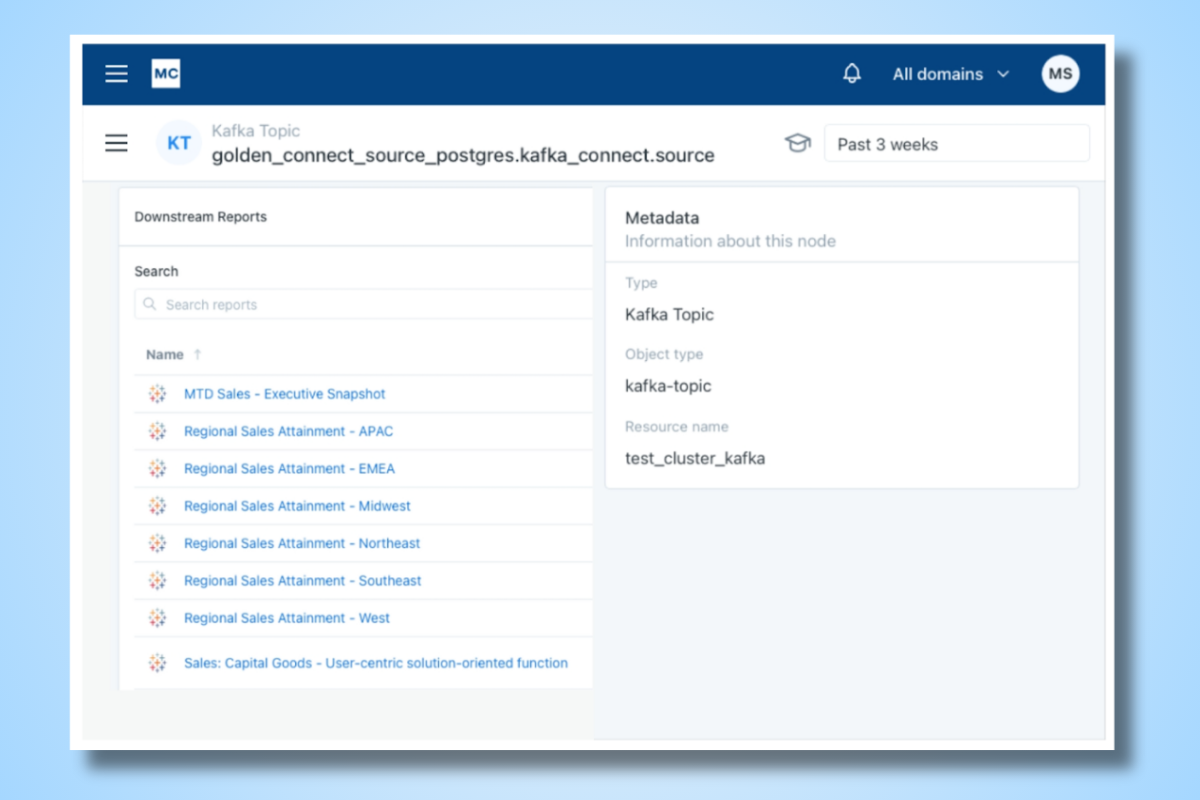
With data lineage, data teams are able to quickly understand relationships between tables, views, and Workbook Pages, including upstream sources and downstream dependencies. You can trace an incident from the stale dashboard all the way to the furthest impacted upstream table to more quickly determine the root cause.
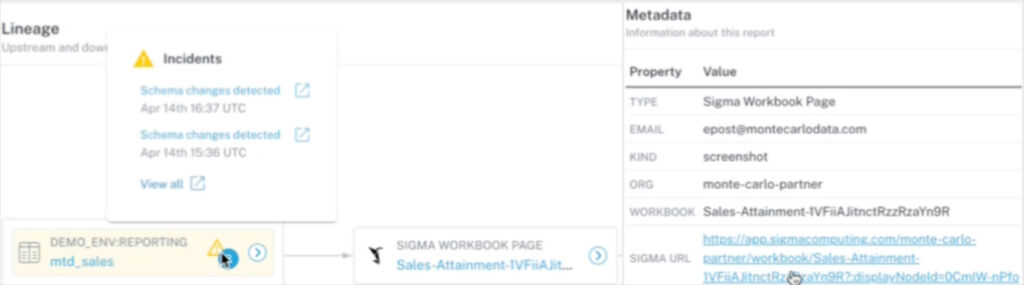
In the case of the image below, we can see the Sigma Workbook Page “Sales Attainment” is downstream of the table mtd_sales, which is experiencing an incident from an unexpected schema change. We can quickly click into the Workbook Page node and surface helpful metadata on the owner, organization, Sigma URL and more.
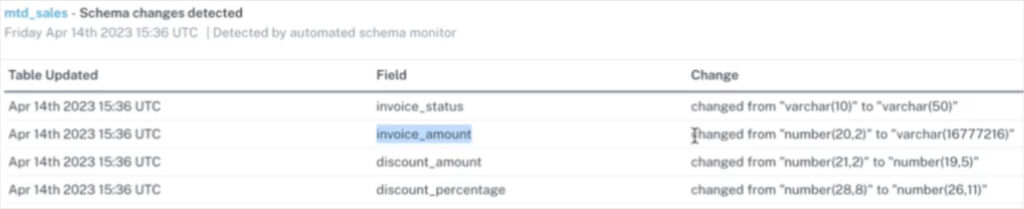
Looks like the field invoice_amount changed from a number to varchar on April 14th. If users have built transformations or logic based on this field, those assets are likely broken.
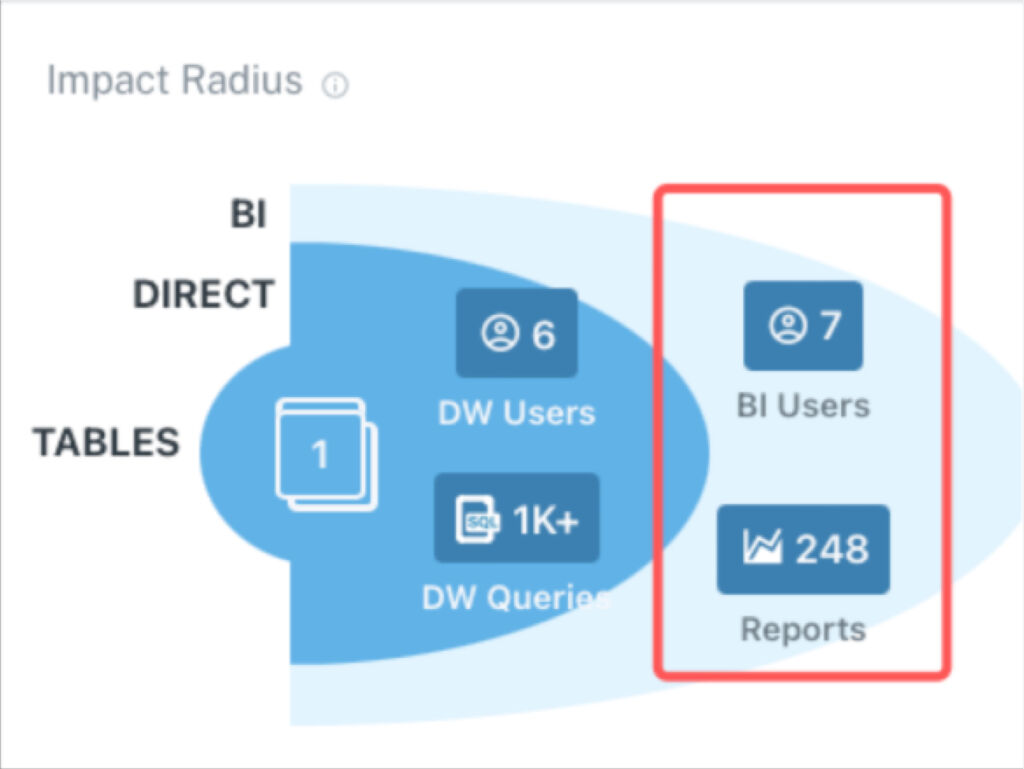
Thanks to a proactive alert from Monte Carlo, we are now aware of this incident, understand what was broken, and identified a dashboard that has been impacted. We can also see the overall “blast radius” of this incident on downstream users to make smart triaging decisions.
Planning schema changes
Data teams can also assess potential impact to Sigma Workbook Pages prior to making a field, table, or schema change.
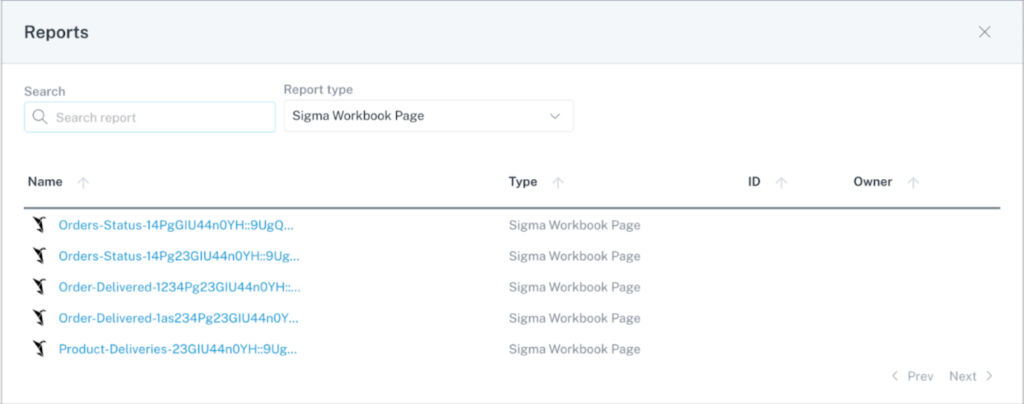
With lineage, data teams can quickly view Workbook Pages that could be impacted prior to making a schema change or when migrating tables to a new cloud data warehouse. In the example below of Monte Carlo’s Catalog page, we can see that a change, if done incorrectly, could impact a number of order and product related Workbook Pages.
More To Come
We’re excited for this announcement and the opportunity to continue to deliver more Sigma capabilities in collaboration with our customers. To learn more you can visit our document page and see our full list of integrations.
Our promise: we will show you the product.
Read more posts.