Product demo.
  What is data observability?
  What is a data mesh--and how not to mesh it up
  The ULTIMATE Guide To Data Lineage
 How the Founder of Monte Carlo Measures Data Team Success—And You Can Too

Tim Osborn
Tim is a content creator at Monte Carlo who writes about data quality, technology, and snacks—occasionally in that order.
You can’t prove what you don’t measure. So, in the constant race to prove our value to customers, how should we be measuring a data team’s success?
Reviews? Surveys? Anonymous floral arrangements?
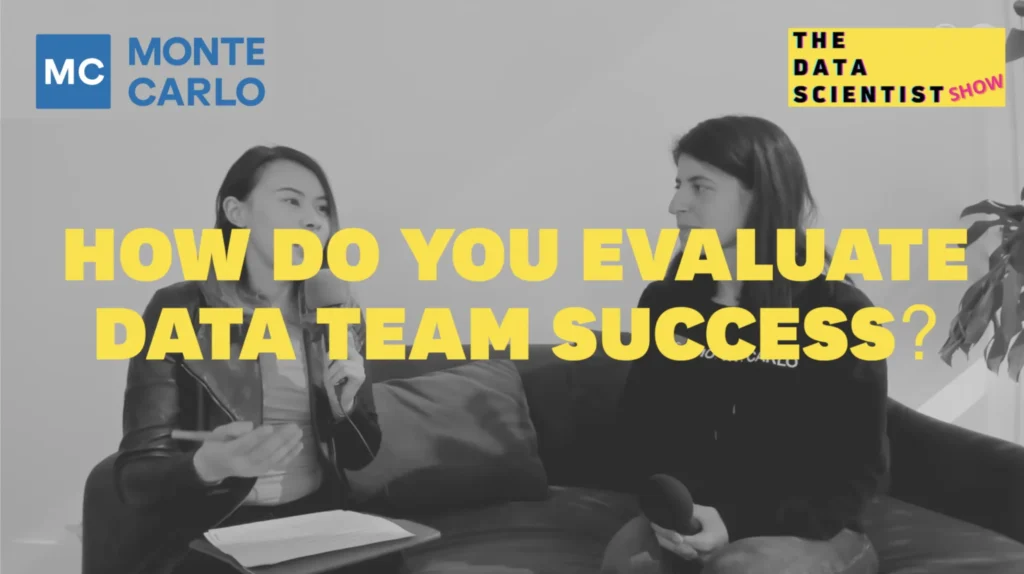
It’s like that age-old maxim says…the customer is always right. We measure the success of our data teams by measuring the actions of our customers. In her latest interview with the Data Scientist Podcast, Monte Carlo Founder Barr Moses shares her tips for measuring customer success and what she’s been doing at Monte Carlo to make her customers as happy as possible.
Click to watch or check out the transcript below!
Transcript
Daliana:
How did you evaluate the success of data teams?
Barr:
Great question. So 10, 15 years ago, the way in which businesses did business was really relationship-driven. So like, “Hey, I’ll take you out to dinner and let’s go talk and be friends and then we can do business together.” And the way that people thought about how to expand businesses and expand relationships was also very, very qualitative and very based on, “How do we think this customer is feeling? How do we think they are enjoying our product or not?” And really not data-driven. And with the creation of customer success, there was also a really strong effort to strengthen those and back that up with data. So what could I do today? I could start actually analyzing what does the data tell me about the happiness or the value or the ROI of my customer.
So I’ll just give you an example. The most obvious is to look at product metrics, right? Like, how often is a customer using the product? But then there’s some data that you maybe not have thought about that could tell you a different story about that customer. For example, the number of support tickets that a particular customer is using. So the initial analysis, this is just kind of an anecdote, was that, you might think that a particular, how the customer engages with the support team tells you about the level of engagement and value. And obviously, if there’s so many tickets, there’s maybe, I don’t know, tens of tickets a day per customer, that probably means that this customer is struggling and needs help, right?
Daliana:
Right. Mm-hmm.
Barr:
But that’s not the only sign of distress. What if there’s no tickets at all? That actually might mean a sign of disengagement. So someone who’s totally not working with your product. So what is the right number of tickets per day per customer that indicates a healthy customer? And what tells us that the customer is not in a good shape? And how do we use that across every single function? We can learn from the behavior to find leading indicators of health and leading indicators of a customer that would want to expand and renew and a customer that actually is asking for help in a way.
Organizations have been saying we are data-driven for a long time, but it’s really in the last five to 10 years that we’re actually using data. And I remember these were the first years where we’re like, “Oh, we have data about our business, let’s start using it.” And that obviously sort of created a whole chain of events. But I think that was a tipping point when people really, really started using data to inform their work.
Daliana:
Yeah. And I like the example you mentioned, how many customer support ticket is a good amount. So for example, when you tried to interpret those stories, when you try to understand and communicate with the customer or the business, a lot of times you don’t know what is right. So how do you iterate the interpretation of the metrics and arrive at the correct answer?
Barr:
Oh, great question. If you know the answer, then let me know. I think anyone knows how to solve that. But I can tell you some mistakes that I’ve made that I’ve learned from. Maybe the first mistake is to think that you can get the answer by studying it deeply for a really long time. It’s like, “If only I analyze the data a little bit more and sit on this in my room and stare at it, the answer will just come.” No, that’s not how it works. Actually, coming up with an initial model as fast as possible and testing it in the field and getting feedback from real customers.
So for example, let’s say you put together a hypothesis that there’s some threshold, let’s say two tickets or less. It’s really bad. Between two to 10 is great, and 10 or more is also bad, right?
Daliana:
Mm-hmm.
Barr:
So there’s some distribution. And so the first thing you should do is go to a customer and ask, “Does this resonate with you? Am I crazy? Tell me a little bit about this.” And then maybe talking to customers from each of those groups, the disengage and the engage groups and testing that out. And so as soon as possible can you get into the hands of real customers, the sort of get out of the building and actually test it, the more informed your model, the better your model will be. I think that’s sort of maybe my biggest learning and how to get this right, so to speak. But also recognizing that it’s actually less about getting it right. There’s the academic idea of, “Can I get something perfect?” when actually in reality people are not perfect and businesses are not perfect, but making progress and improving. If the outcome of that exercise is that you identified a hundred customers that were struggling and you move them from the red zone to the yellow zone to the green zone, that’s a huge win, right?
Daliana:
Yeah.
Barr:
And so maybe your analysis wasn’t perfect and your thresholds were not perfect, but you actually made a difference and made more customers happy using that. That’s huge, right? I’ll take that any day over the alternative.
I have a hypothesis that everyone inside is a recovering perfectionist and we all don’t want to screw it up. And so we sit on it so much until we think it’s perfect. And I think definitely there’s a balance to it, right? It’s definitely you don’t want to put something in front of a customer that’s not going to be helpful to them or not represent you well, right? I think that makes sense.
But also there’s a saying like, “If you’re not shipping something that you’re not embarrassed by, then you’re kind of shipping too late.” I think the most important thing is being frank and honest about that. So you can go to a customer and say like, “Hey, this is actually not done. It’s very early thinking. It’s very likely wrong in many areas. What I’d love your help on is focusing and narrowing in on what are the things to fix or what are the things that are important to get right?”
I’ll just give an example from our world actually. So at Monte Carlo, we spend a lot of time on making sure that the data that we are servicing to our customers is actually valuable, and part of it is actually getting the model right. So making sure that there’s a very low percentage of alerts that are actually false positives or not meaningful to customers. But over time, what we’ve learned is that there are additional ways to make data valuable to customers, which is actually understanding which data is owned by which team.
So for example, let’s say a specific person owns the marketing data. They don’t care about anything that’s related to the financial data. That actually has nothing to do with how we’re analyzing the data or modeling it. It has to do with the organization of that business and that process and how the people are working. And that is a learning that we would never have if we didn’t actually talk to customers and actually take it to the next level and really understand what it means to make this data relevant to this person.
Read more posts.