Product demo.
  What is data observability?
  What is a data mesh--and how not to mesh it up
  The ULTIMATE Guide To Data Lineage
 Data Vault Architecture, Data Quality Challenges, And How To Solve Them

Michael Segner
Michael writes about data engineering, data quality, and data teams.

Lior Gavish
CTO and Co-founder, Monte Carlo. Programming wizard and lover of cats.
Over the past several years, data warehouses have evolved dramatically, but that doesn’t mean the fundamentals underpinning sound data architecture needs to be thrown out the window.
In fact, with increasingly strict data regulations like GDPR and a renewed emphasis on optimizing technology costs, we’re now seeing a revitalization of “Data Vault 2.0” data modeling.
While data vault has many benefits, it is a sophisticated and complex methodology that can present challenges to data quality. In this blog post we’ll dive into data vault architecture; challenges and best practices for maintaining data quality; and how data observability can help.
What is a Data Vault model?
For those unfamiliar, data vault is a data warehouse modeling methodology created by Dan Linstedt (you may be familiar with Kimball or Imon models) created in 2000 and updated in 2013. Data vault collects and organizes raw data as underlying structure to act as the source to feed Kimball or Inmon dimensional models.
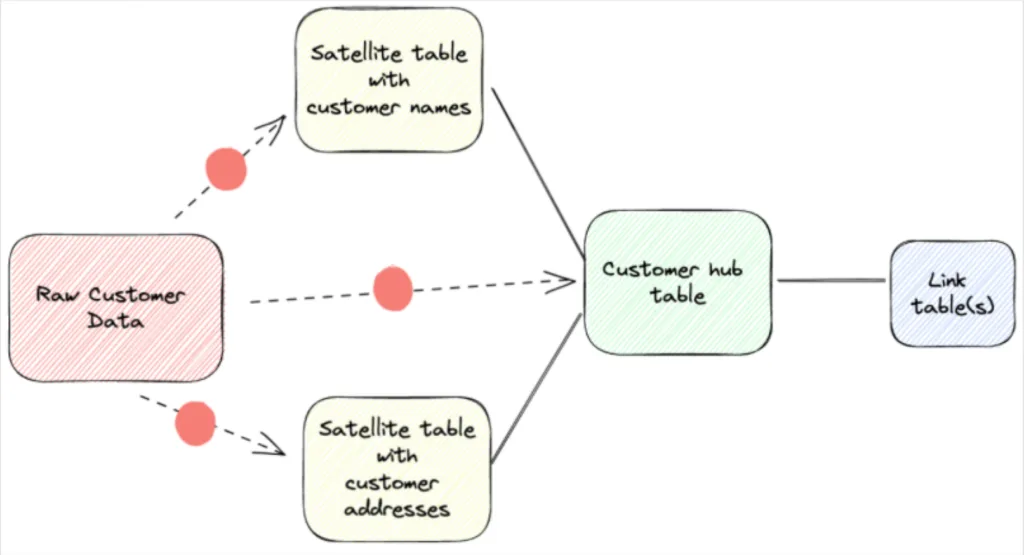
The data vault paradigm addresses the desire to overlay organization on top of semi-permanent raw data storage. There are 3 components to a data vault model:
- Satellite tables: contain information related to a particular business concept.
- Hub tables: link satellite tables together either through standard key relationships, composite keys, or more security conscious approaches incorporating hashes.
- Link tables: maps different hub tables together through keys (or equivalent).

Data vault benefits
Data vault modeling has a lot of advantages compared to other methodologies (or not modeling at all!) such as its suitability for auditing, quickly redefining relationships, and easily adding new datasets.
Pie Insurance, a leading small business insurtech, leverages a data vault 2.0 architecture (with some minor deviations) to achieve their data integration objectives around scalability and use of metadata.
“A data vault data model is intended to be a physical implementation of the organization’s business model so it becomes a standard place to plug-in data from multiple sources. As new data is added into our data warehouse, we are able to plug in the data to our model by adding Satellite tables. Or as new subject areas become in-scope, we can add new Hub and Link tables based on our business model,” said Ken Wood, staff data engineer in data architecture, Pie.
“The other advantage is because we follow a standard design, we are able to generate a lot of our code using code templates and metadata. The metadata contains our data mappings and the code templates contain the expected structure of our ETL code scripts/files,” he said.
Other advantages Pie has experienced from their data vault implementation include:
- Organizational – Pie can find data they need quickly because it is organized to their business model.
- Foundational – Data vault provides a solid foundation that allows for fast “speed-to-insights.” When new questions arise they can build dimensional tables downstream from data vault tables, and even virtualize downstream content (views).
- History – The design of Satellite tables allows Pie to search and query changes to data over time, essentially providing the data needed for slowly changing dimensions and fact history views of the data.
How do you implement a data vault architecture?
While deployments will vary, Pie’s data vault architecture implementation includes 4 conceptual layers of data architecture that make up their data pipeline ecosystem:
- Ingestion Layer– Landing and Staging raw data from source systems.
- Landing – Source files landed in AWS S3 buckets
- Staging – Raw Source Data stored in VARIANT columns within Snowflake tables.
- Curation Layer – Organizes the raw data.
- Raw Data Vault – Within Snowflake environment and has minor transformations mapping it into Hub, Satellite, and Link tables as recommended by the Data Vault 2.0 methodology.
- Business Data Model – Pie’s data vault design is the physical model of their business data model – as opposed to trying to design based on each source system’s data. This gives them a single model to conform to, regardless of the source.
- Transformation Layer – Transform and cleans data using business logic.
- Business Vault – Pre-Transformed data, following business transformation rules.
- Information Warehouse – This layer alone follows the dimensional (or Kimball) star (or snowflaked) data model.
- Presentation Layer – Reporting layer for the vast majority of users. This layer has minimal transformation rules.
- BI/Reporting Tool(s) – Pie uses Looker, which has a metadata layer that reflects the “Information Warehouse” (transformed data).
- Future Reporting Tool Plug-in – This allows future reporting or querying tools to be added without major development, because the data is already transformed in the database-layer.
- Dynamic Rules – Dynamic rules or calculations that need to change depending on different grains or aggregated views self-service users need to see their information.
“We think of our architecture from left to right. The far left is data in its most raw form and the far right is information that has been fully transformed, cleansed, and is ready to be consumed by the business,” said Ken.
Data quality faults with your data vault

There are many benefits to data vault architecture, but it does create more tables with more complex transformations and relationships between upstream and downstream assets than other methodologies. This can create data quality challenges if not addressed properly.
Some challenges can include:
Code maintenance
The ETL code for Hub, Satellite, and Link tables must follow the same rules for common column value definitions (like business and hash key definitions) to enable them to load independently. As a result, any changes to code may have to be done in multiple places to ensure consistency.
One tip? “Our code generation is metadata driven so when we change the metadata in one place it regenerates the ETL code wherever that particular metadata is used,” said Ken.
Multiple, complex transformations between layers
Transformations are a necessary step in any data engineering pipeline using any methodology, but they can create data quality incidents. This can happen either as transformation code gets modified (perhaps incorrectly) or the input data isn’t aligned with the underlying expectations of the transformation model (perhaps there has been an unexpected schema change or the data doesn’t arrive on time).
Long blocks of transformation code at multiple layers within a data vault architecture can compound these errors and make root cause analysis more difficult. A best practice here is to keep transformations as simple as possible.
“We are working to evolve our design to apply complex transformations in only one place, the Information Warehouse, within the data pipeline,” said Ken. “As the raw data vault scales the transformation logic becomes more complex, so we are designing ways to reduce complexity.”
Maintaining integrity across hub, link, and satellite tables
Any load (or other errors) in the data vault hub, link, and satellite tables will mar downstream queries with outputs showing partial or missing data.
“The key is to have automated validation checks or data observability in place to detect these anomalies when they happen,” said Ken.
Understanding dependencies
Mapping all the dependencies within a data vault architecture can be challenging, especially if you don’t understand the source data to map it to target Hub, Satellite, and Link tables or if the source systems have additional, unexpected business keys that aren’t in the target model.
“We deal with this by using multi-active Satellite tables. These add a key to the Satellite table to match the grain,” said Ken.” Or, we add Hub and Link tables as new keys are introduced AND it aligns with our business model.”
Scaling testing
Developing and maintaining a series of data unit tests or data quality checks across your data warehouse is already a headache, but with data vault it’s especially difficult.
That’s because no human can possibly anticipate and write tests for all the ways data can break, and if they could, it is virtually impossible to scale across all of the tables and pipelines in your environment.
That is especially true when it comes to data vault architectures since there is 3x the surface area to cover and the multiple layers and transformations add even more unknown unknown data quality issues.
How data observability improves data vault reliability
Data observability tools can address data vault data quality challenges in several other key areas :
- One of the hallmarks of Data Vault architecture is that it “collects 100% of the data 100% of the time,” which can make backfilling bad data in the raw vault a pain. Data observability reduces time to detection to enable data teams to close the spigot of broken pipelines and stop the flow of bad data flowing into the raw vault thereby reducing the data backfilling burden. Even better, using strategies such as circuit breakers and health insights, data teams can prevent issues from occurring in the first place.
- From raw data landing zones down to reporting tables, data observability solutions can make sure that your range of numbers and types of values are as expected.
- Transformation queries that move data across layers are monitored to make sure they run at the expected times with the expected load volumes, defined in either rows or bytes. Monte Carlo features like automatic data lineage and query change detection will enable Pie (and other organizations utilizing data vault) to greatly accelerate their root cause analysis. No longer will it be necessary to manually trace tables upstream or determine what changes to a large SQL query introduced data anomalies.
- With more table and column references created by the data vault architecture, the need to monitor for schema changes, such as table or column name changes, also increases.
- Finally, data observability tools should also be easy to implement across your entire stack, and continue to monitor beyond the initial implementation, so that future satellites and hubs that are added in the future can be certified as safeguarded without the need for more stakeholder review meetings and time spent implementing future tests.
Avoid faults to get the data quality score you deserve

Gymnasts perform in front of some tough judges (like this judge from the 2016 Rio Olympics!), but Dan from Finance is an even harsher critic when his quarterly reports are wrong.
Following the advice of leaders in the data vault space, like Pie, is a good next step. For Ken, success comes down to constant alignment with the business and the business model.
“Avoid the temptation to just model Data Vault tables to easily fit the data coming from a source system – unless that source system’s data model was built based on your business’s data model,” he advised.
Your team has invested significant time and expertise into developing and maintaining a data vault architecture, and ensuring data trust at each step of the way will justify the fruits of your hard-earned labor.
Interested in how data observability can help the data quality challenges posed by your data vault architecture? Schedule a time to talk to us below.
Our promise: we will show you the product.
Read more posts.