Product demo.
  What is data observability?
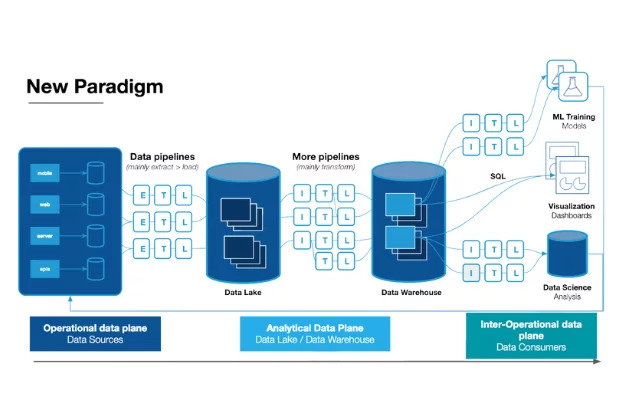
  What is a data mesh--and how not to mesh it up
  The ULTIMATE Guide To Data Lineage
 5 Helpful Data Quality Frameworks You Need to Know

Michael Segner
Michael writes about data engineering, data quality, and data teams.
A data quality framework is the methodology an organization puts in place to assess and improve its level of data quality.
In the movie Inception, the main character Cobb uses a framework of rules and procedures to enter people’s dreams and extract information. He has to navigate the dream world with a well-defined framework.

Similarly, a data quality framework provides a set of guidelines and best practices that enable organizations to collect, analyze, and interpret data in a standardized and consistent manner.
Different data quality frameworks offer unique approaches to managing and assessing data quality. Let’s dive deeper into four popular frameworks and see how they compare.
Table of Contents
- Data Quality Assessment Framework (DQAF)
- Total Data Quality Management (TDQM)
- Data Quality Scorecard (DQS)
- Data Quality Maturity Model (DQMM)
- Data Downtime (DDT)
- Supercharge your data quality framework with data observability
Data Quality Assessment Framework (DQAF)
The DQAF, designed by the United Nations, was developed with a focus on statistical data. This data quality framework has five data quality dimensions – assurances of integrity, methodological soundness, accuracy and reliability, serviceability, and accessibility.
Strengths:
- Designed specifically for evaluating the quality of data collected for statistical purposes – think censuses, unemployment rates, inflation rates, etc.
- Provides clear dimensions to focus on, making it easy to understand and apply.
- Developed by the UN, lending credibility to the framework.
Weaknesses:
- Primarily tailored for statistical data, making it less suitable for other types of data.
- Lacks a data governance focus.
Total Data Quality Management (TDQM)
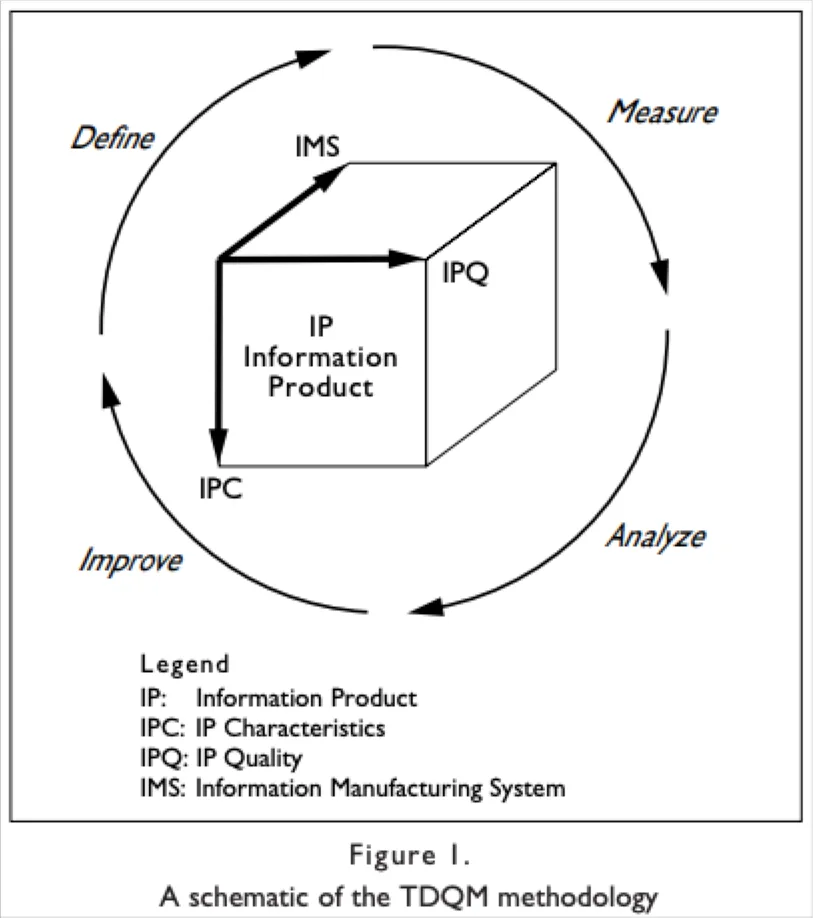
TDQM, developed by Richard Y. Wang, a professor at MIT, takes a more holistic approach. The framework does not explicitly define a fixed set of data quality dimensions, but instead revolves around four stages: defining, measuring, analyzing, and improving. Organizations using TDQM define their own set of dimensions relevant to them.
Strengths:
- Encourages organizations to be proactive in managing data quality from the beginning.
- Highly adaptable to various organizational needs and data types.
Weaknesses:
- Can be more complex to implement, as it requires a thorough understanding of the entire data life cycle.
- May require significant resources and time to execute effectively.
Data Quality Scorecard (DQS)
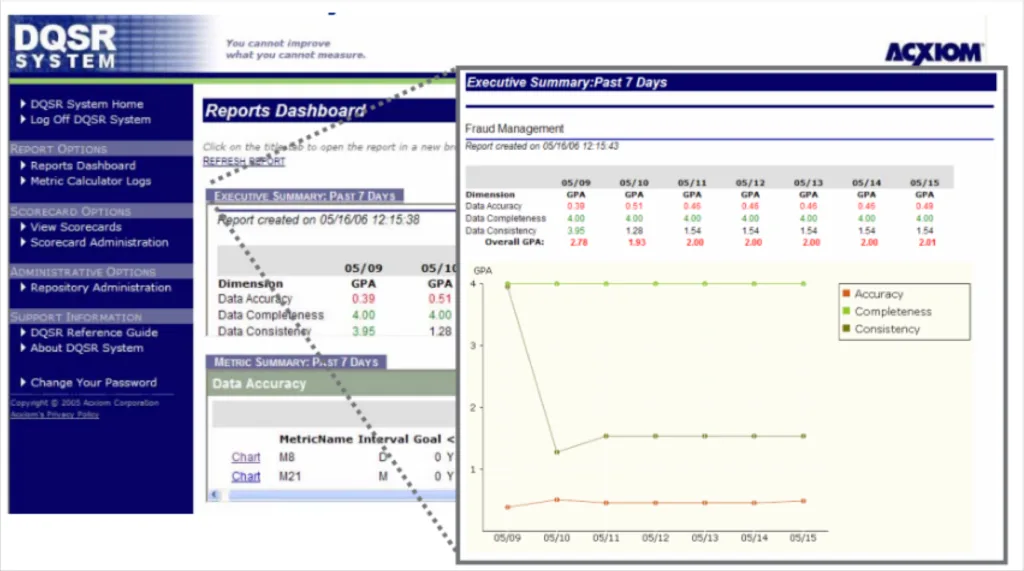
The DQS doesn’t have a specific origin or single developer, but rather was adapted by management consultants from other scorecards such as the Balanced Scorecard. Organizations customize their own scorecards by selecting relevant metrics and measuring the quality of their data and track improvements over time.
Strengths:
- Provides specific data quality metrics for a clear way to assess progress.
- Encourages organizations to establish data quality benchmarks and track improvements over time.
- Can be used in conjunction with other frameworks to provide a more comprehensive approach.
Weaknesses:
- Focuses primarily on measurement, rather than providing guidance for improving data quality.
- May not address data governance aspects or the data life cycle.
Data Quality Maturity Model (DQMM)
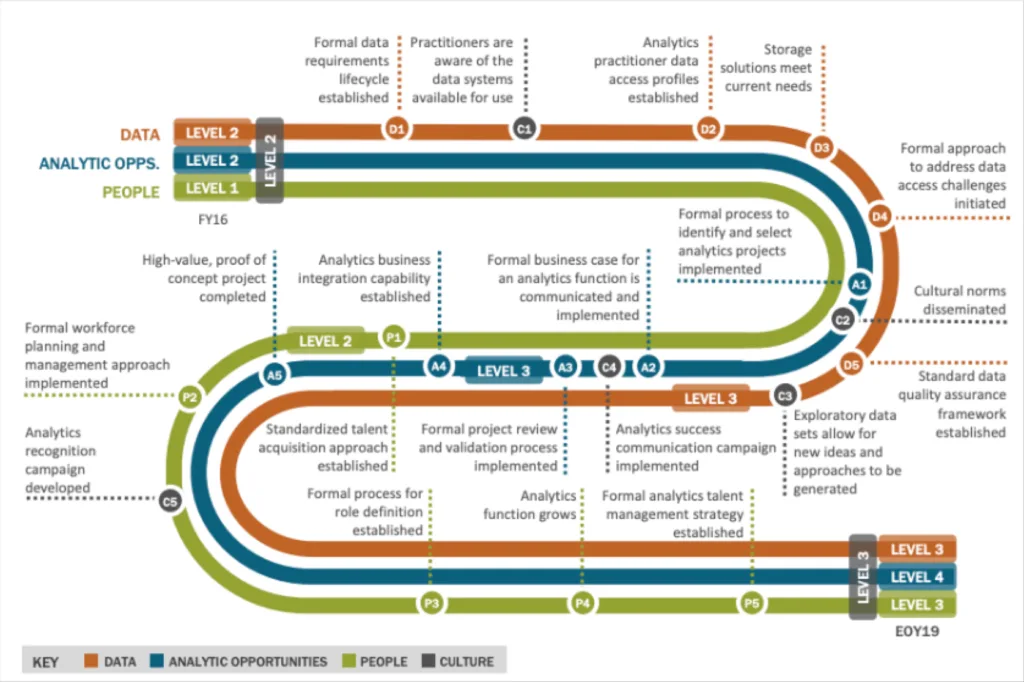
A DQMM provides a structured roadmap for organizations looking to enhance their data quality management practices. There is no single, definitive DQMM. Multiple researchers and consultants have proposed different versions of maturity models to help organizations assess and improve their data quality management practices.
One example is the Capability Maturity Model Integration (CMMI), which was originally developed for software development processes but has been adapted to various other domains, including data quality. Another example is the Data Management Maturity (DMM) Model which encompasses data quality as one of its key components.
Strengths:
- Helps organizations identify their current maturity level and areas for improvement.
- Offers a clear roadmap for improving data quality management practices.
- Encourages a methodical, step-by-step approach to enhancing data quality.
Weaknesses:
- May not provide specific metrics for measuring data quality, making it challenging to assess progress.
- Requires a long-term commitment to improvement, which might be difficult for organizations with limited resources or competing priorities.
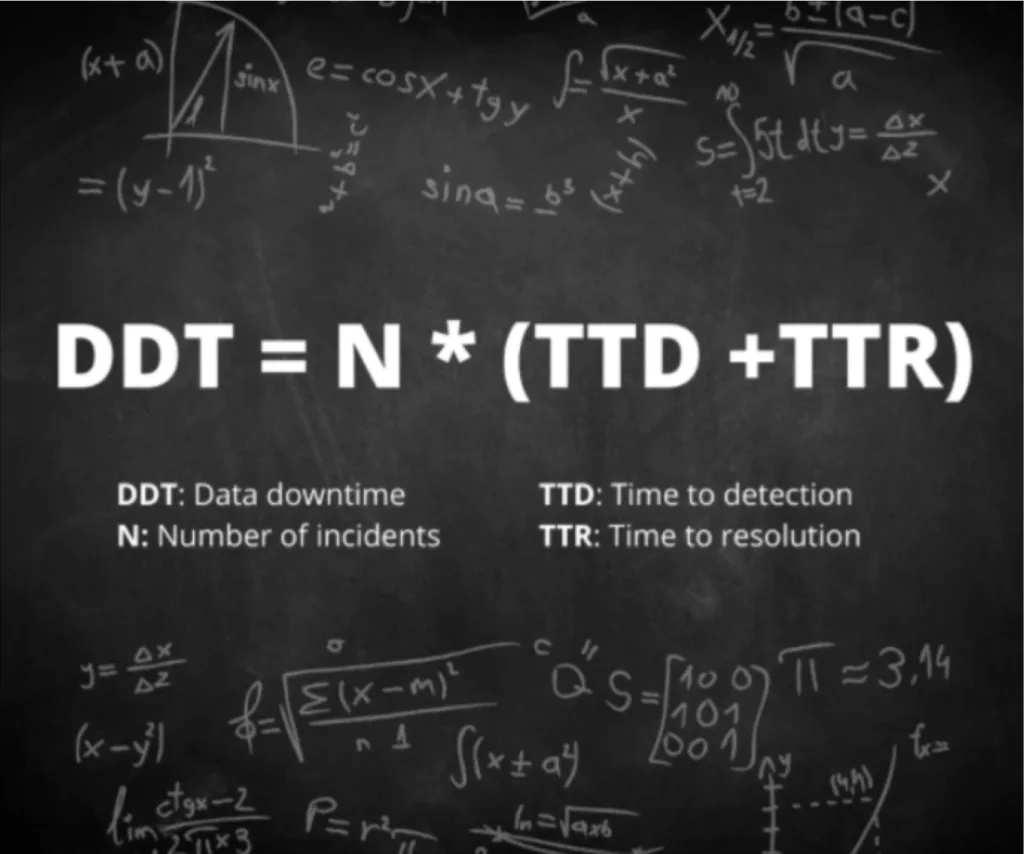
Data Downtime (DDT)
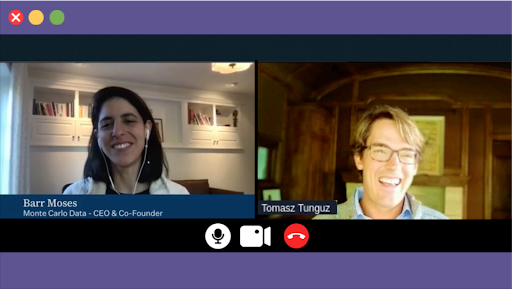
After interviewing hundreds of data leaders, Barr Moses developed the data downtime framework alongside the creation of the data observability category.
The framework is built around the observation that in the cloud-based modern data stack, data quality issues result from issues in the data pipeline as well as the data itself often materializing in these four general buckets:
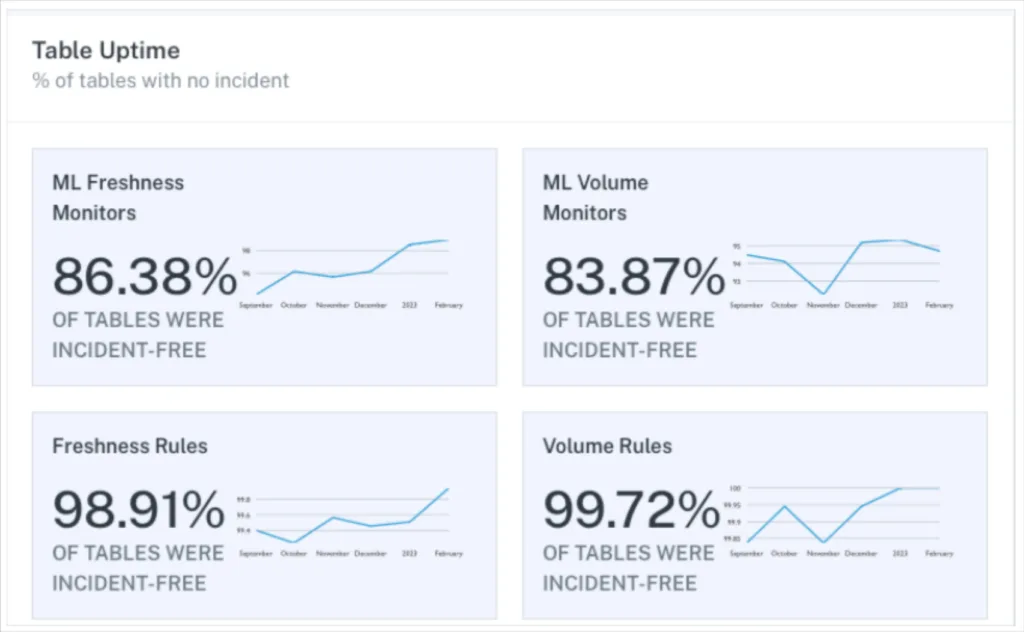
- Freshness: The data doesn’t arrive when it should.
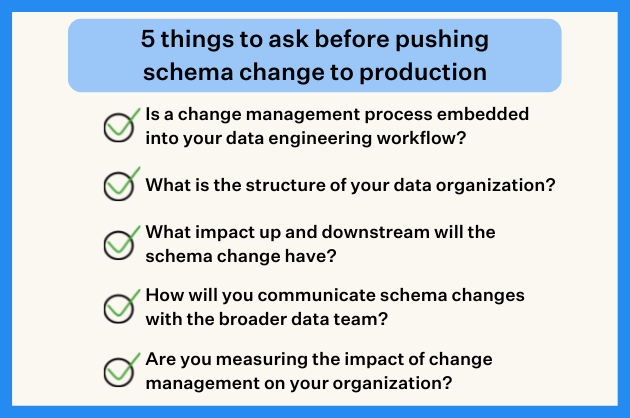
- Schema: The data organization changes, breaking downstream data assets.
- Volume: There are too many or too few rows.
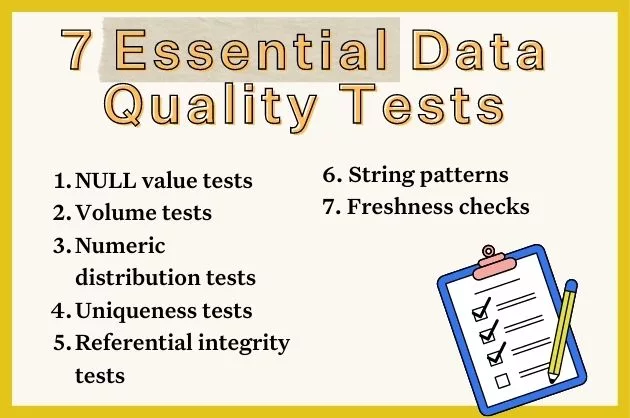
- Quality: The data itself is wonky. Too many NULLs, low unique%, an outlier value distribution, etc.
The data downtime framework measures the amount of time data is wrong, incomplete, or otherwise inaccessible. It is a helpful leading indicator for data trust. It is measured by taking the number of incidents and multiplying it by the average time to detection and average time to resolution.
Strengths:
- Shaped by the data quality experiences specific to the modern data stack
- Simple formula that highlights the levers for improved data quality: the improved detection, resolution, and prevention of data incidents.
- Can help calculate the cost of poor data quality and justify investments to improve it.
Weaknesses:
- It can be challenging for data teams to evaluate how many data incidents they aren’t catching.
- The aggregate metric treats downtime equally although the true severity of the incident will vary depending on the importance of the data asset impacted.
Supercharge your data quality framework with data observability
Just as Cobb in Inception had to carefully choose his tactics, selecting the right data quality framework depends on your organization’s unique needs and goals.
Keep in mind though that all of the data quality frameworks discussed were designed back in the day when data didn’t move nearly as fast as it does today, and when there was less data flowing through the systems. They were built for the on-prem era, and let’s face it, things have changed quite a bit since then. While the concepts are still valuable, if you’re like most organizations these days, you run on a modern data stack and data quality issues crop up faster and the root causes are more complex.
To gain real-time insights into data health in order to address issues more proactively, you need data observability. It’s like having a superpower that allows you to keep an eye on your data health throughout your entire data infrastructure. It’s the perfect companion for your data quality framework, tailored to the fast-paced, data-driven world we live in today.
Interested in learning more about the Monte Carlo data observability platform? Schedule a time to talk to us below!
Our promise: we will show you the product.
Read more posts.