Product demo.
  What is data observability?
  What is a data mesh--and how not to mesh it up
  The ULTIMATE Guide To Data Lineage
 Getting Started: Automatic Detection and Alerting for Data Incidents with Monte Carlo


Scott O'Leary
Scott O'Leary is a founding member of Monte Carlo's Sales team.
In this series, we highlight the critical steps your business must follow when building a data incident management workflow, including incident detection, response, root cause analysis & resolution (RCA), and a blameless post-mortem.
Let’s start with incident detection and alerting, your first line of defense against data downtime and broken data pipelines.
As companies increasingly rely on data to fuel decision-making, the onus on data to be accurate and reliable has never been higher. And with more and more data entering your data ecosystem, the chance for error only increases, costing organizations upwards of $12 million per year, not to mention precious time and stakeholder trust.
For decades, software engineering and DevOps teams have relied on a multi-step process to identify, triage, resolve, and prevent software issues from taking down their applications. As data operations mature, it’s time we treat data downtime, in other words, periods of time when data is missing, inaccurate, or otherwise erroneous, with the same diligence, particularly when it comes to building more reliable and resilient data systems.
The first step? Incident detection and alerting, your first line of defense against broken data pipelines and the inevitable early morning pings from your executives (“why is the data wrong?”) and stakeholders (“what happened to this dashboard?”) when pipelines do break.
Fortunately, with the right processes, technology, and culture in place, your data team can foster a collaborative, efficient workflow for identifying, remediating, and preventing issues from consuming too much precious time and energy and eroding data trust for the rest of the organization.
Step 1. Write your data incident runbook
Before you can detect incidents, you need to establish processes and develop good (enough) documentation to communicate responsibilities, roles, and a clear path forward for when you do get that dreaded Slack message or PagerDuty notification. To quote Benjamin Franklin, “failing to plan is planning to fail,” and this certainly holds true when it comes to managing the unknown unknowns in your data pipeline.
Regardless of how much testing you set up for your data pipelines, incidents are bound to happen, and having a plan in place will help you when an issue does arise. Just like site reliability engineers (SREs) utilize runbooks for when applications break, modern data engineers should put plans in place for when pipelines break, too.
At a bare minimum, I recommend your runbook address the following:
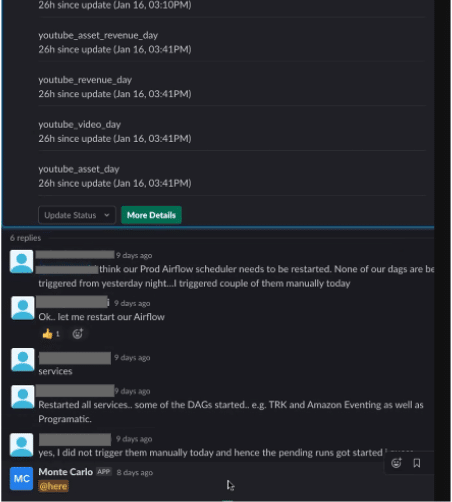
- What does your organization consider to be a data incident? This allows your team to determine if it is something you should be worried about. Maybe the data incident could be resolved by restarting an Airflow DAG, or maybe you need to submit a ticket to dive deeper into the issue with the rest of the data team. Either way, determining what is truly an incident and what can be deprioritized or ignored helps reduce noise and keep your team focused.
- Who is receiving alerts for when there is a data incident? This varies across organizations, so you’ll need to figure out what works best for your team. Some teams have a single person assigned to all data incidents as the first line of defense, while others have a data engineering team that is responsible for freshness and volume, and an analytics team that validates the data. Assigning ownerships for specific types of incidents or even specific aspects of an incident will pay dividends down the road, increasing your team’s ability to work together and identify the root cause of the problem. A best practice is to integrate alerts into data engineering workflows through PagerDuty, Slack, Opsgenie, and other popular channels as this ensures that all data stakeholders and end-users are alerted when issues arise.
- How will you communicate the incident to stakeholders and end-users? Some orgs take a direct approach to this, sending incident notifications to team-specific channels (such as Slack channel for incidents that impact important marketing dashboards). Other orgs keep the first line of defense within the data engineering team, and only alert stakeholders once it’s clear that the issue is “real” and does, in fact, affect downstream data consumers. Regardless of the approach, it’s critical that your first line of defense is technical-enough to understand the incident in the context of your data environment, and business savvy enough to understand the business context and impact of the issue. Checking these two boxes helps immensely, as it reduces the back-and-forth otherwise required to effectively communicate both the technical scope and business impact of an issue.
Step 2. Detect data incidents
When data pipelines break, the first step is incident detection.
It goes without saying that you should be testing your data before it enters into production and catching known unknowns, in other words, issues you can predict within range of certain thresholds.
However, testing and other circuit breaker approaches fail data teams when it comes to detecting incidents you can’t predict or account for in production — unknown unknowns. As a result, testing your data doesn’t provide true end-to-end observability, which is necessary for data-driven businesses. And as data pipelines become increasingly complex, the number of unknown unknowns will only grow for both staging and prod.
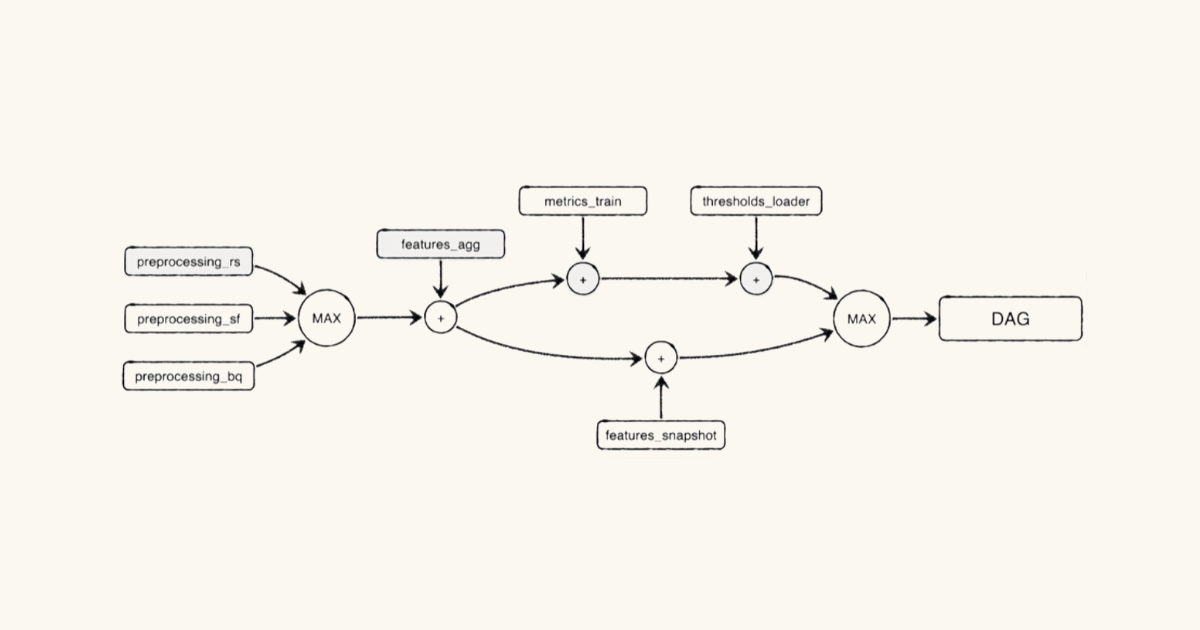
This is why data requires both testing and observability to ensure end-to-end reliability. Modern data teams must think about data as a dynamic, ever-changing entity, and apply not just on rigorous testing, but also continual data observability. With data observability, issues can be detected through automated data monitoring and alerting and triggered based on ML-generated or custom-set thresholds.
A critical aspect of data observability is anomaly detection, which allows organizations to identify when pillars of data health (i.e., volume, freshness, schema, and distribution) are not meeting expectations in production. Anomaly detection is valuable to businesses when it is implemented end-to-end (such as across your warehouses, lakes, ETL, and BI tools) as opposed to only being implemented with one or two layers of your data platform. Doing this gives your team a full picture of your organization’s data health, so if something breaks your team is the first to know and resolv
Step 3. Set up an alerting workflow for data incidents – in 5 minutes
If a pipeline breaks and nobody is around to hear it, did it really break?
In 2021, when data powers nearly every critical decision your company makes and touches teams across the organization, the answer is a resounding yes.
Jokes aside, your team should be alerted when something goes wrong, rather than spending hours or even days investigating the issue manually. Before you set up your alerts in Monte Carlo, your team should establish ground rules for consider an incident, who should be receiving certain types of alerts, and what is the best place to receive them. These guidelines and processes should be documentation in your team’s runbook.
Monte Carlo uses machine learning to automatically generate alerts based on historical data, requiring little lift on your end to get up and running. Alerts can be directly sent to Slack, email, PagerDuty, Opsgenie, Mattermost, and webhooks.
To set up alerts for your team, navigate to the “Settings” tab, and click on “Notifications” in the left-hand sidebar:
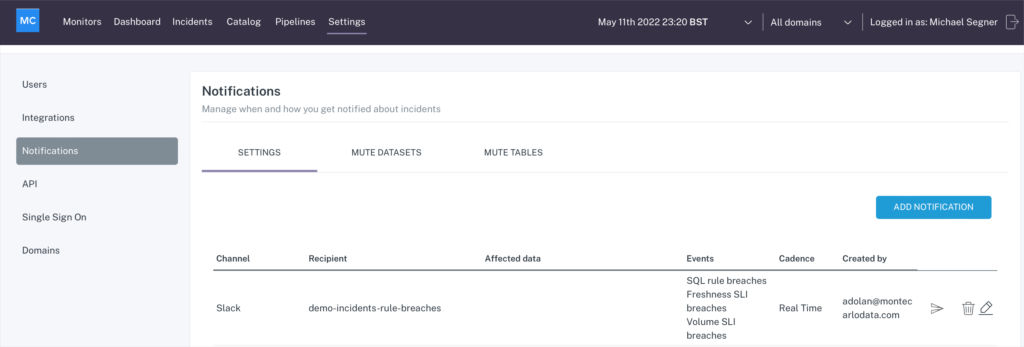
Click on “ADD NOTIFICATION” and pick the channel you want your alert to route to.
Many teams choose to set up a PagerDuty or Opsgenie notification for important tables (i.e. financial reports, product statistics, marketing spend, and operational metrics) and a Slack or email notification for less important tables. Such notifications allow your team to cut down on noisy alerts.
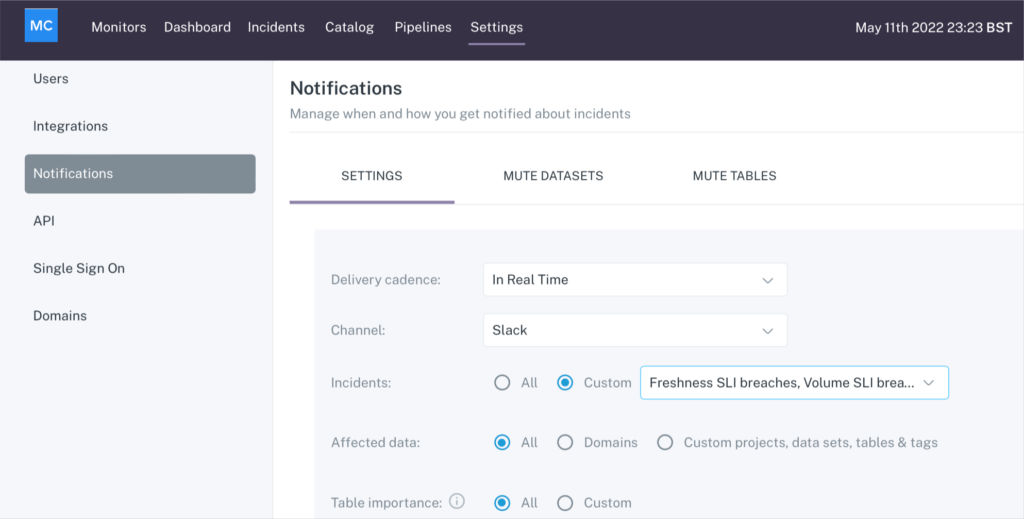
Next, choose the incidents you want routed to this channel. You can have all incidents route by default, or you can choose a custom selection, like only custom rule breaches for specific tables or reports.
If you select rule breaches, teams can route all or just a select rule breaches to specific channels:
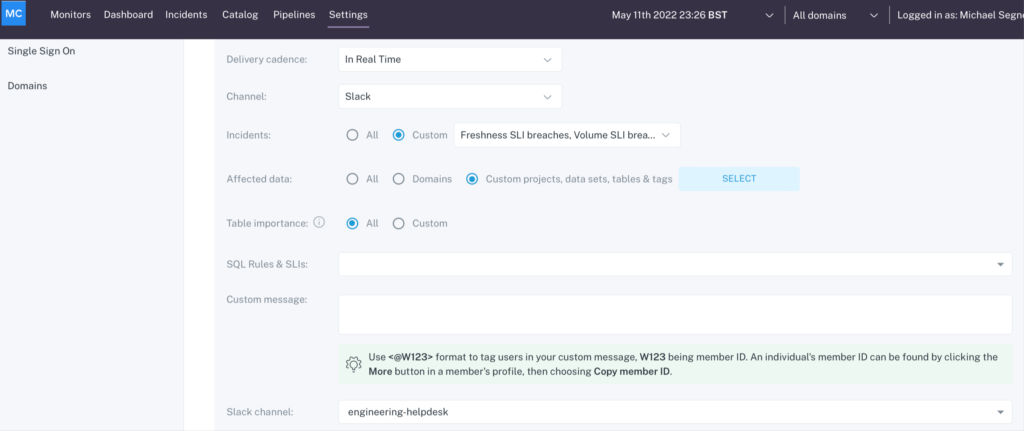
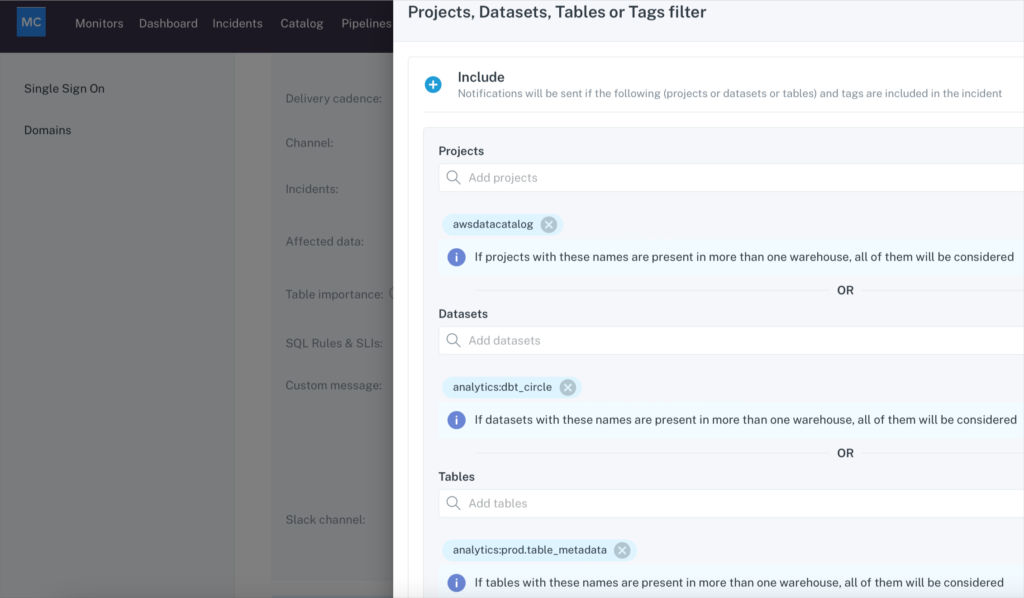
Finally, you can choose a “Custom” filter for “Datasets & tables” to narrow down the datasets or tables to be notified about:
While Monte Carlo facilitates automatic, end-to-end anomaly detection out-of-the-box based on historical patterns in your data, some teams choose to set up custom alerts based on specific business needs. As you company’s data strategy matures, I recommend leveraging both.
Moving forward
Establishing a best-in-class incident management practice requires not just the right tooling, but also a holistic approach that reduces noise, prioritizes critical assets, accounts for silent errors, and most importantly, facilitates easier collaboration across the company.
Broken data pipelines may not make a sound, but their impact can be powerful enough to fell metaphorical trees.
In part two of our incident management series, we’ll share our best practices and lessons learned from the field for responding to data incidents.
Interested in learning more about setting up a robust incident management process for your data team with Monte Carlo? Reach out to Scott and book a time to speak with us using the form below.
Our promise: we will show you the product.
Read more posts.