Product demo.
  What is data observability?
  What is a data mesh--and how not to mesh it up
  The ULTIMATE Guide To Data Lineage
 5 Steps to Operationalizing Data Observability with Monte Carlo


Will Robins
Will Robins is a member of the founding team at Monte Carlo.
“How do we scale data observability with Monte Carlo?”
I’ve heard this from hundreds of new customers. They’re excited about all that data observability can do for them, but like with any new software, they want prescriptive guidance.
“In the ‘Crawl → Walk → Run’ of software adoption, what’s the quickest way for my team to start crawling?”
If you’re a data team of 5-15 engineers or analysts, I recommend building healthy data observability muscles using our end-to-end, out-of-the-box monitors, and then pave the way for natural adoption and quick value from other powerful capabilities.
Here’s how I’d recommend getting started:
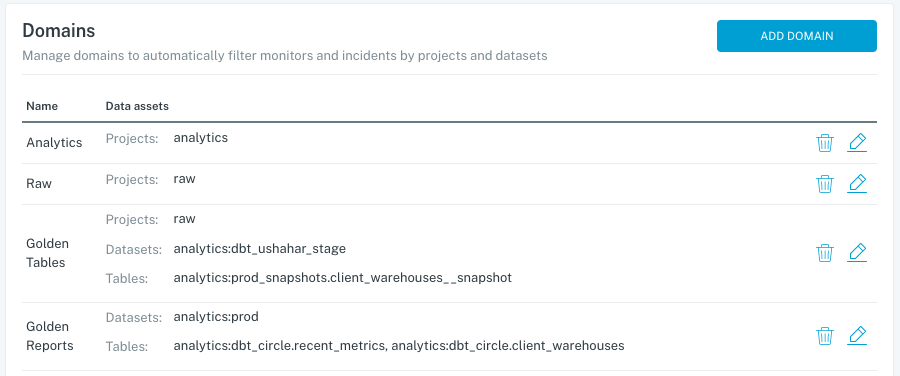
1) Set up Domains, if you have multiple teams that care about different data sets.
Domains are a functionality that gives each team their own workspace, where they only see the data and alerts that are relevant to them. If you’re just one team managing all data, this step may not be relevant to you.
This is managed in Settings > Domains and click ‘Add Domain.’
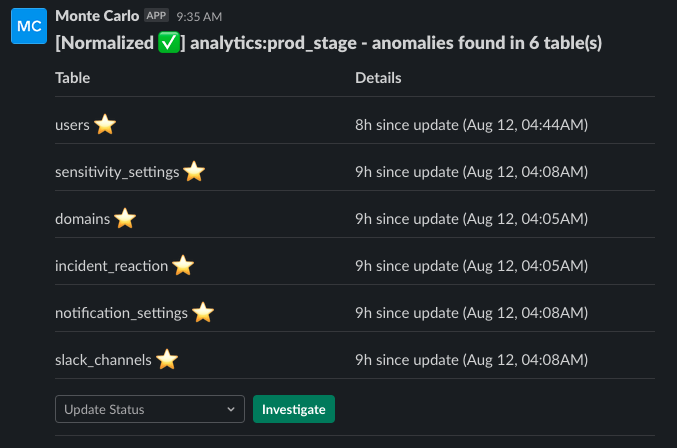
2) Set up alerts from Monte Carlo to go where your team collaborates.
Monte Carlo has native integrations with Slack, Microsoft Teams, PagerDuty, OpsGenie, email and more communication channels.
For best results, aim for an average of 1-3 alerts per day, per channel. If this number starts peaking over 5 per day, I suggest filtering the alerts into different channels, or filtering some out altogether.
Common ways to filter alerts (called “Incidents” in MC) include:
- Sending alerts from different domains, databases or schemas to different channels. For example, alerts on ingestion and processing tables go to a Data Engineering channel, and analytical or pre-BI tables go to an Analytics channel.
- Muting any dev, scratchpad, or low-value datasets or tables. Mute in Settings > Notifications > Mute Datasets.
- Filtering just for Key Assets, or sending alerts on Key Assets to a separate high-priority channel
- Routing schema changes to a different channel or using a daily digest
This is managed in Settings > Notifications and click ‘Add Notification’
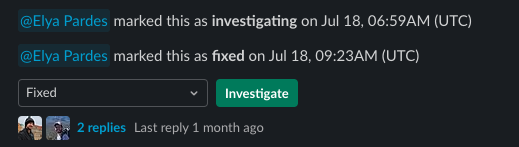
3) Establish an on-call rotation to handle critical incidents.
This person (or rotation of people) should know that they’re accountable to review alerts in a timely manner. You can update the Status of an alert to indicate that it’s been reviewed, or to let people know it’s still being investigated. Using Statuses helps to ensure no balls are dropped, since it means an alert without a Status hasn’t been reviewed.
If desired, Monte Carlo’s Customer Success team can train your company how to best utilize data observability investigate an Incident, or you can check out some of our incident management resources.
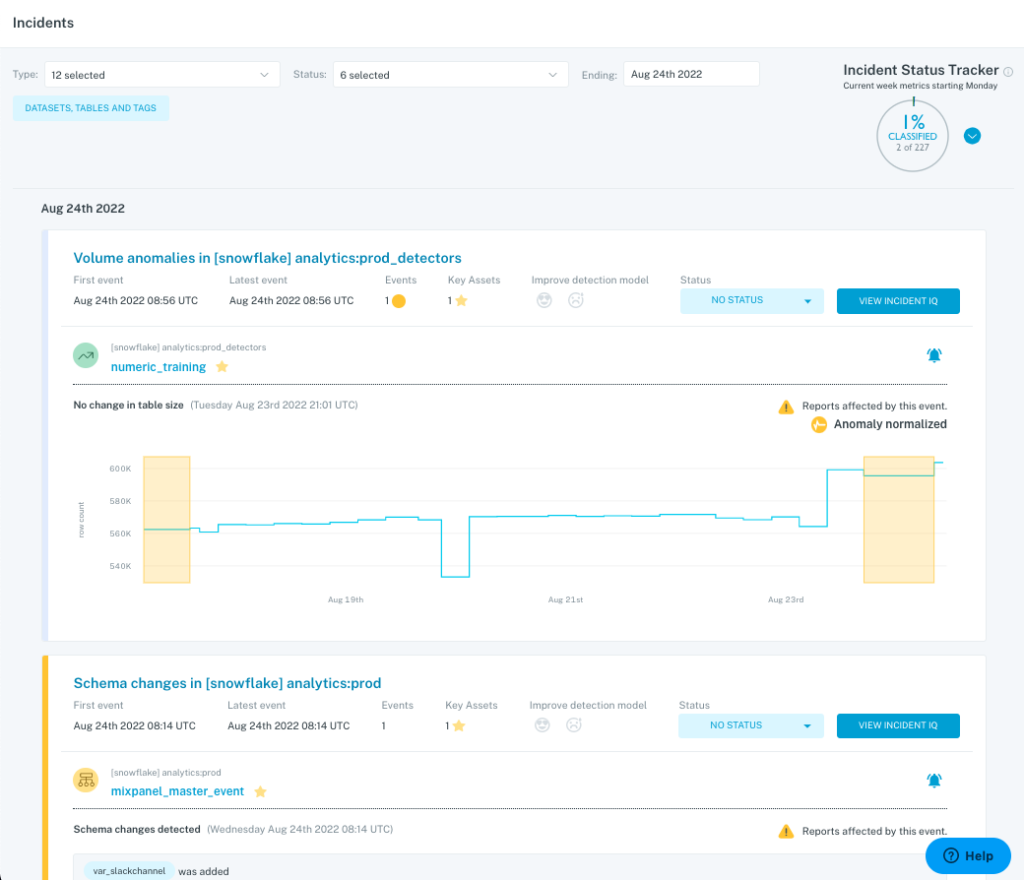
4) Have a weekly team meeting to review Incidents.
You can run this directly from the Incident feed in Monte Carlo. Knowledge sharing about what went wrong can help prevent future issues, and uncovers ways to fine-tune your strategy for which alerts should go where. These meetings are also great ways to identify any dropped balls – sometimes a meaningful alert may have been overlooked in the rush of a busy day.
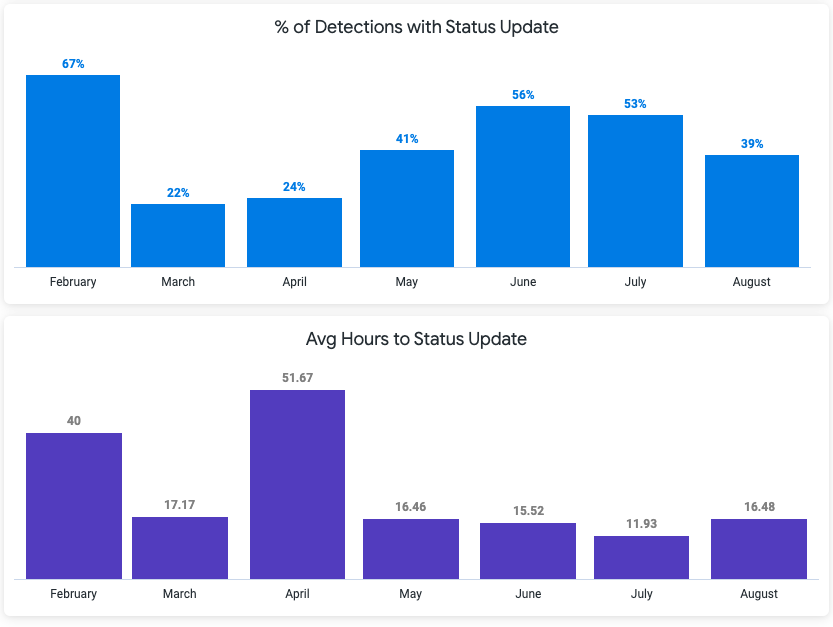
5) Set goals and track operational metrics.
Status Update Rate and Average Time-to-Response are two easy operational metrics automatically tracked by Monte Carlo that provide signal into how much time you’re spending tackling data quality issues. Depending on the incident type, I recommend targets of 80% and 12 hours, respectively. These can be tracked using Insights within Monte Carlo, or through reports we can automatically send to your inbox each week.
These 5 steps are a fast and effective way to jumpstart Monte Carlo as part of your team’s operating rhythm. It only scratches the surface of how data observability can improve your company’s data reliability, both out-of-the-box (automated monitors) and over time (custom, user-directed monitors).
Very common and easy follow-on steps from here include:
- Turn on ML-based custom data monitors on your most important data. For example, turning on Field Health for your 25 most important tables
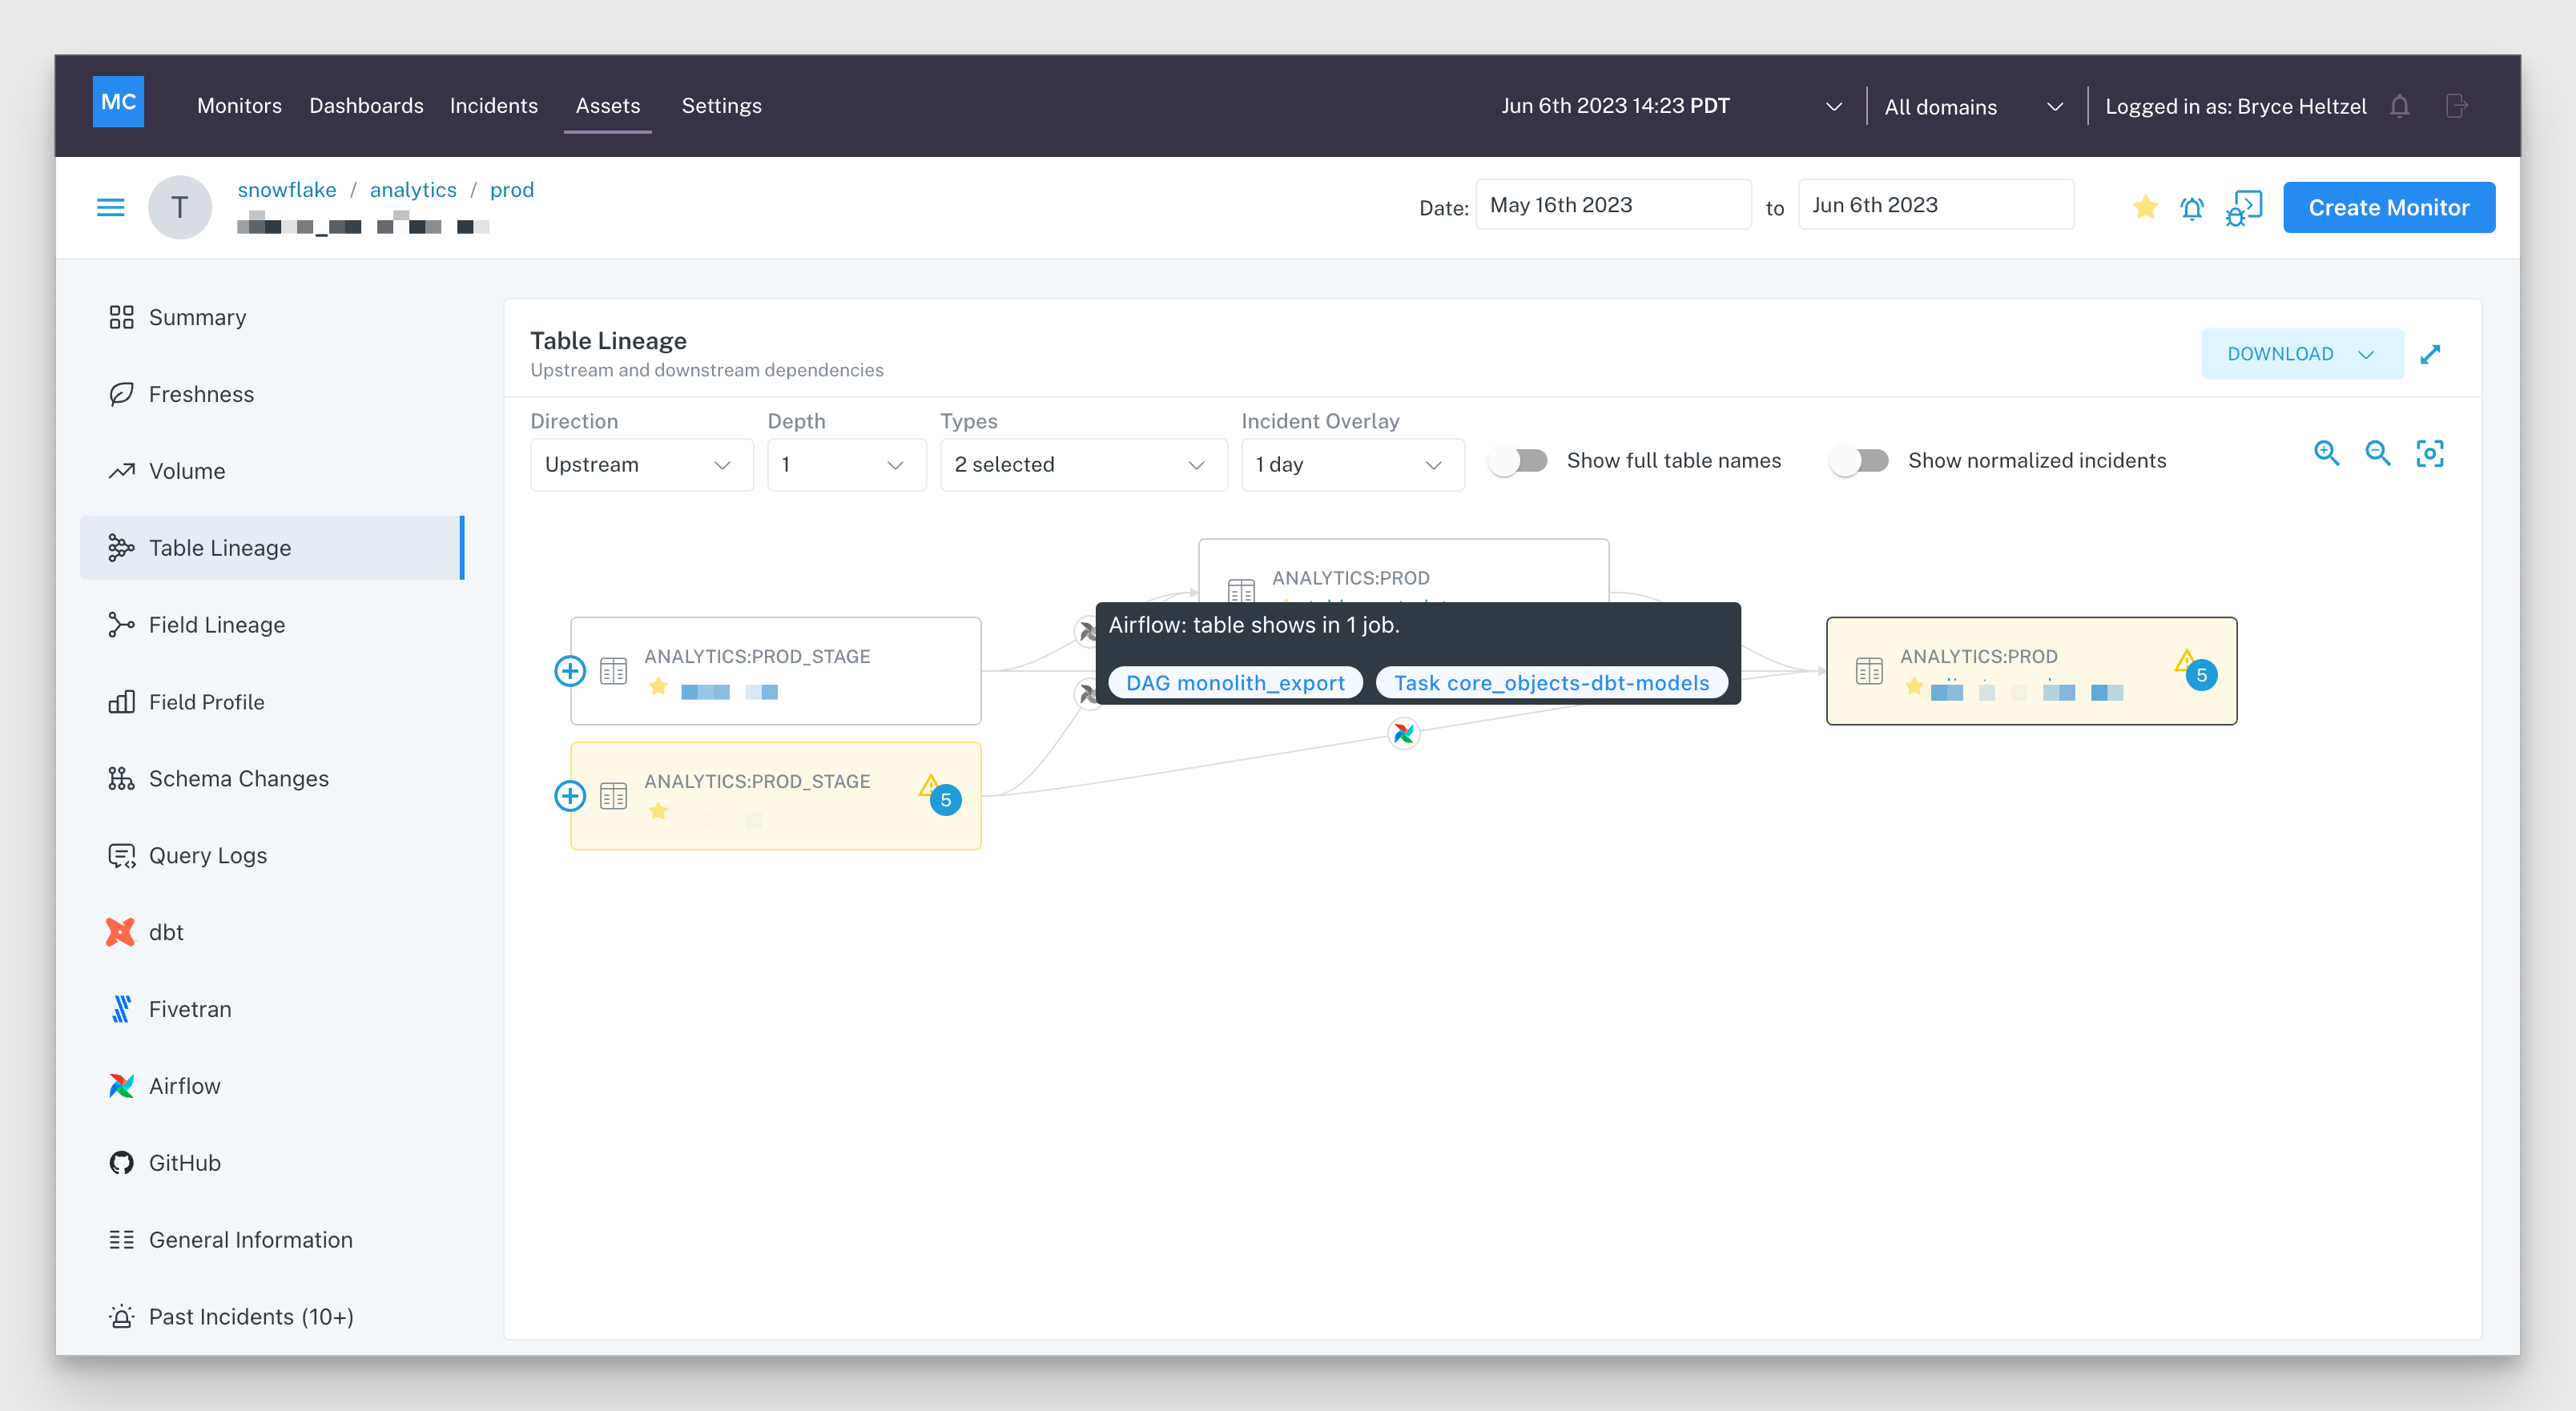
- Create a policy to check table and field-level lineage in Monte Carlo before deprecating or changing a table or field
- Build a few data-based SQL Rules or SLOs to explore how to leverage explicit checks
More advanced follow-on steps that I often see include:
- Leveraging Monitors as Code to programmatically deploy custom monitors through YAML files
- Extracting and leveraging raw Observability data about your environment. This can be done via the API, through Insights, or through our Datashare with Snowflake
- Creating a Service-Level Objective framework and operationalizing it through SLOs in Monte Carlo
With these best practices in tow, here’s wishing you no data downtime!
Interested in learning more about how Monte Carlo operationalizes data quality at scale for teams at Fox, CreditKarma, Vimeo, and other companies? Reach out to Will and the rest of the Monte Carlo team.
Our promise: we will show you the product.
Read more posts.