Product demo.
  What is data observability?
  What is a data mesh--and how not to mesh it up
  The ULTIMATE Guide To Data Lineage
 How to Solve the “You’re Using THAT Table?!” Problem


Barr Moses
CEO and Co-founder, Monte Carlo. Proponent of data reliability and action movies.
As companies increasingly rely on data to power decision making and drive innovation, it’s important that this data is timely, accurate, and reliable. When you consider that only a small fraction of the over 7.5 septillion (7,700,000,000,000,000,000,000) GB of data generated worldwide every day is usable, keeping tabs on what data assets are important has only gotten harder. In this article we introduce “Key Assets”, a new approach taken by the best data teams to surface your most important data assets for quick and reliable insights.
Have you come up with the weirdest way to name “relevant” tables such as “IMPT” or “USE THIS_V2”? Have you been 3/4ths of the way done with a data warehouse migration only to discover that you don’t know which data assets are right and which ones are wrong? Is your analytics team lost in a sea of spreadsheets, with no life vests in sight?
If you answered yes to any of these questions, you’re not alone. Over the past few years, I’ve spoken with hundreds of data teams both energized and overwhelmed by the potential of their company’s data assets, responsible for maintaining an ever-evolving ecosystem of data assets.
We call this the “You’re Using THAT Table?!” Problem, and it’s more common than you think.
Here are three tell-tale signs you might be experiencing it:
You’re migrating to a new data warehouse

As data teams increasingly make the shift from on-prem data warehouses to Snowflake, Redshift, and other cloud warehouses or between cloud warehouses, the ability to know which data is valuable and which data can go the way of the Dodos becomes evermore important.
Unfortunately, data validation and cross-referencing is often handled manually, which is costly, time-intensive, and hard to scale. One customer, a data team leader at a global financial services company currently migrating to Snowflake, revealed that they “are manually mapping tables in Redshift to reports in Tableau so we know what to migrate over to Snowflake and Looker.”
Oftentimes when data teams migrate from Redshift to Snowflake, they end up resorting to a manual gap analysis between copies of the same tables in both data warehouses because “knowing which reports are downstream from the table will help us identify and prioritize the migration, or deprecate a table that we don’t need anymore.”
Your company’s data analysts and data scientists don’t know what data to use
A second and just as common pain point for data teams is not knowing what data is most useful, let alone at all usable.
If you and your team have asked any of the following questions, they may be in the midst of a mystery not even Scoobie Doo can solve. Here is a list of common data discovery questions. Maybe they’ll resonate:
- What data should I use?
- I’m not able to find the data I need – what should I do?
- It’s hard to understand what is our “important data”… help?
- Who is using this table? Does this data even matter?
When these questions are frequently asked, there’s a clear lack of both data trust and data discovery at your company, which takes a toll on your company’s ability to leverage data as a competitive advantage.
You have significant “data debt”

Like technical debt, data debt refers to data assets that are outdated, inaccurate, or otherwise taking up precious storage space in your data warehouse. It’s an all-too-common occurrence and bogs down even the most advanced data teams, making it difficult to surface timely and relevant insights.
What does data debt look like in practice? Here are three strong indicators:
- You have old data skeletons in your closet (including outdated, inaccurate tables, and legacy data types) that teams might mistakenly use.
- You get alerts about different jobs and system checks failing but they’re ignored because “it’s always been like that.”
- You’ve updated your tech stack, migrated to Snowflake, and are using the latest new tools, but no longer leverage the same data formats, data tables or even data sources.
Introducing: Key Assets
Data teams are tasked with creating visibility into the business via data-driven insights, but when it comes to their own operations, they’re often flying blind. Instead, teams need a single view into the health of their data, Key Assets which identify the most critical data tables and datasets in your data warehouse.
Fortunately, the best data reliability and discoverability (catalog) solutions are already incorporating them into their products. By leveraging machine learning, these solutions intelligently map your company’s data assets while at-rest without requiring the extraction of data from your data store, generating a “Key Assets dashboard.”
A Key Asset might be:
- A table that is queried by many people, frequently
- A dataset that is heavily used by ETL processes to derive other datasets
- A table that feeds many or frequently used dashboards
- An external source that has important downstream dependencies
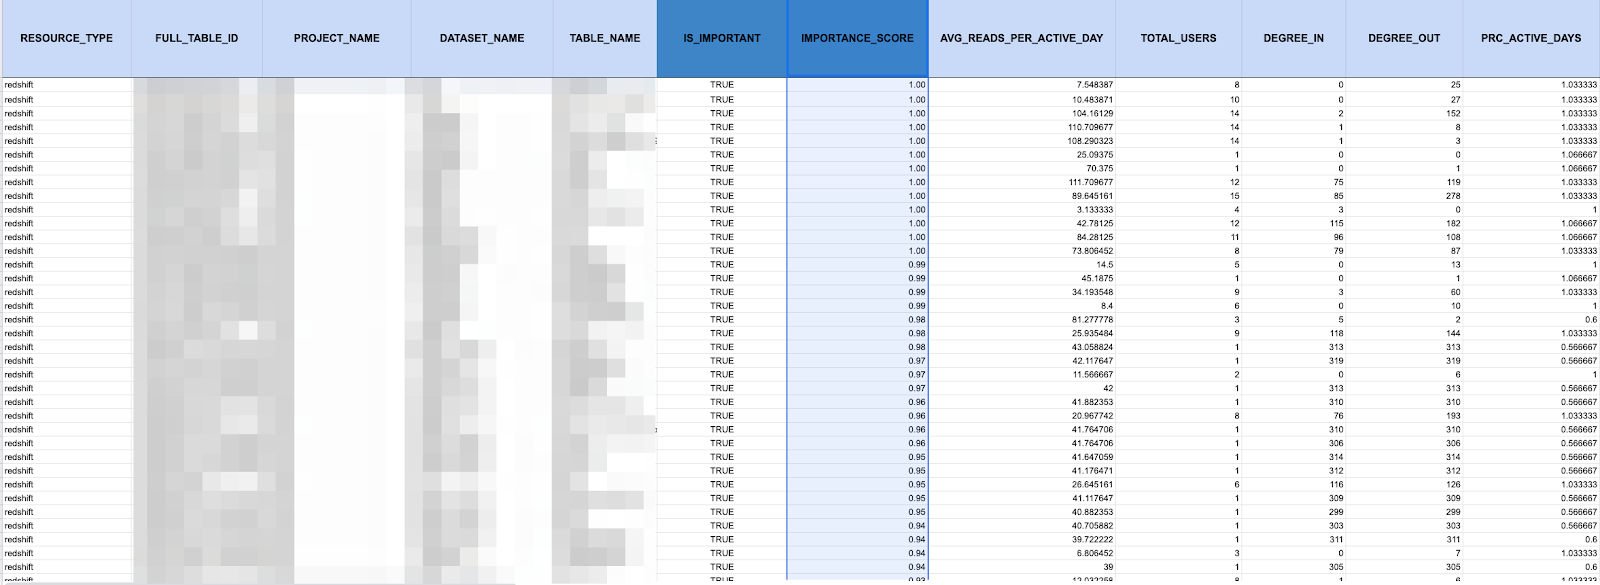
But how can teams identify their Key Assets? Among other variables, I suggest that teams look for tables and datasets that are:
- Frequently accessed (i.e., AVG_READS_PER_DAY)
- Frequently updated (i.e., AVG_WRITES_PER_DAY)
- Used by a high number of users
- Updated/used regularly (i.e., < 1-5 days since latest update)
- Leveraged by a large number of ETL processes
- Supports connectivity, in other words is read-from/written-to many other data assets
- Experiencing a high data incident rate (over days/weeks/months)
- Queried recently/frequently by BI tools
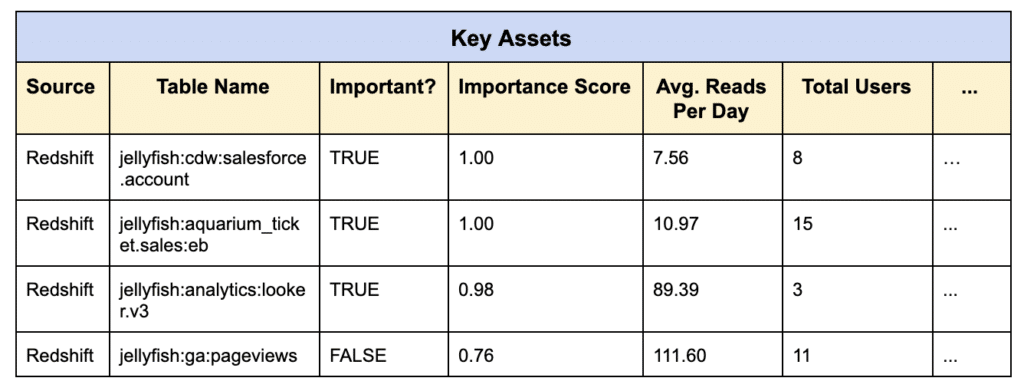
Additionally, Key Assets should include an “Importance Score” for each individual data asset. This score is a composite of key metrics about data usage that indicate which assets matter most to your organization. The higher the score, the more likely the asset is a significant resource for your team.
Unlocking data trust and discovery with Key Assets
As data architectures become increasingly siloed and distributed, Key Assets can help you optimize data discovery and restore trust in your data in the following ways, among many others:
Facilitating smoother warehouse migrations
Spearheading a data warehouse migration can be a simultaneously exciting and daunting task. More often than not, data teams are forced to handle data validation manually. With Key Assets, teams can automatically identify which tables are in-use and relied on, and which ones can be deprecated, making this process that much quicker.
Makes it easier to find important data for intelligent decision making
It’s likely that analysts across your company are making v1, v2, v3, and v4s of every data set under the sun (or rather, in your warehouse); finding and knowing which ones are actually relevant and important will make all the difference when you’re putting together critical analysis. Bonus points if users can also search for specific data assets. Key Assets support both functionalities.
Reducing data debt
Key Assets makes it easier to clean up “junk” tables and pipelines, allowing you to reduce data debt in your data warehouse or lake by highlighting which data tables are widely used and which ones are outdated or even inaccurate. Traditional methods of data debt reduction rely heavily on code-intensive integrations (i.e., open source) or ad-hoc SQL queries wrapped around workflow orchestration tools. Key Assets provide an easier and quicker way to pull these metrics and more.
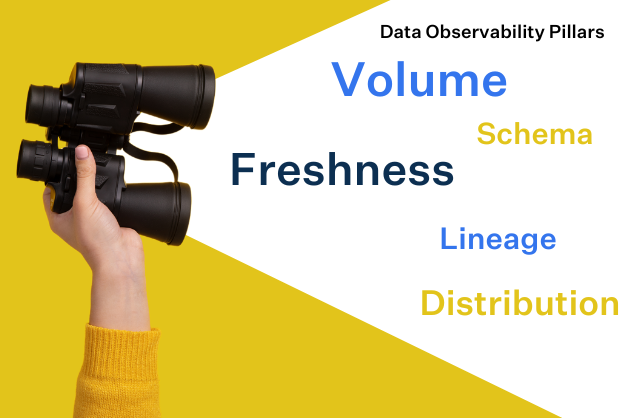
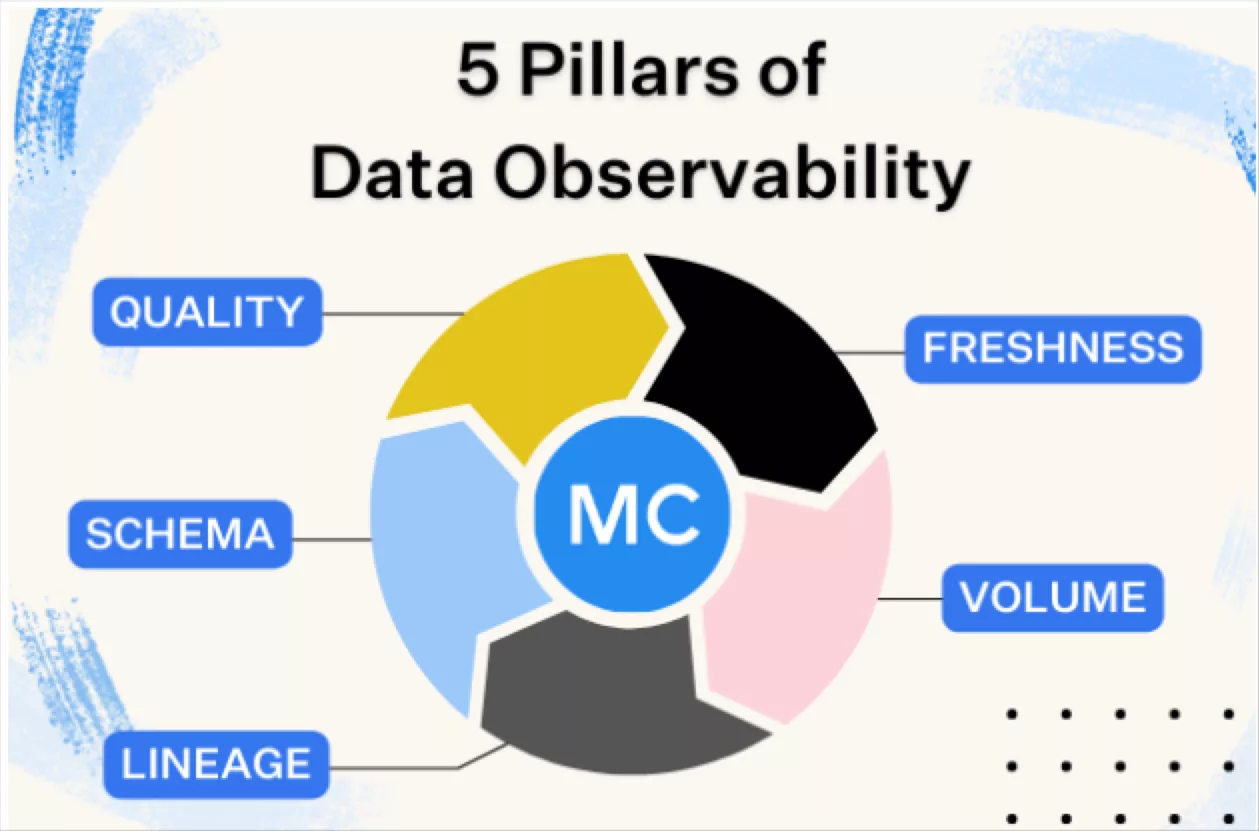
Achieving end-to-end data observability
From ingestion to analytics,end-to-end data observability is a must-have for any serious data engineering team. By understanding where your important data lives and how it’s being used at all stages of the pipeline, tables and data sets that have been deprecated can be ignored and key tables surfaced.
Automatically generating Key Assets via machine learning
In my opinion, a smart but secure Key Assets dashboard should be generated automatically, leveraging machine learning algorithms that learn and infer your data assets by taking a historical snapshot of your data ecosystem, without actually accessing the data itself.
Increases data reliability by eliminating data downtime
An automatically generated, single source of truth that such as Key Assets is a logical conclusion for understanding how tables are utilized, preventing the effects of data downtime from manifesting in your data pipelines.
With Key Assets, users can search for and identify which data assets need to be closely monitored for likely abnormalities or issues, and which ones can be put on the back-burner. Such a solution can help teams automatically mute noisy alerts for outdated data and keep tabs on only the data assets that are actively used by the business.
I don’t know about you, but I can’t wait till the “You’re Using THAT Table?!” Problem is a thing of the past.
Want to identify your own data organization’s key assets? Book a time to speak with us using the form below.
Our promise: we will show you the product.
Read more posts.